|
Sunday, December 17, 2017, 1645ET
Market Timing Charts, Analysis & Commentary for Issue #221
Timer Charts of S&P-500 Cash Index (SPX) + NASDAQ-100 Cash Index (NDX)
Most recent S&P-500 Cash Index (SPX): 2675.81 up +24.31 (up 0.92%) for the week ending on Friday, December 15, 2017, which closed at its +1.5 sigma.
SPX ALL TIME INTRADAY HIGH = 2679.63 (reached on Friday, Dec 15, 2017)
SPX ALL TIME CLOSING HIGH = 2675.81 (reached on Friday, Dec 15, 2017)
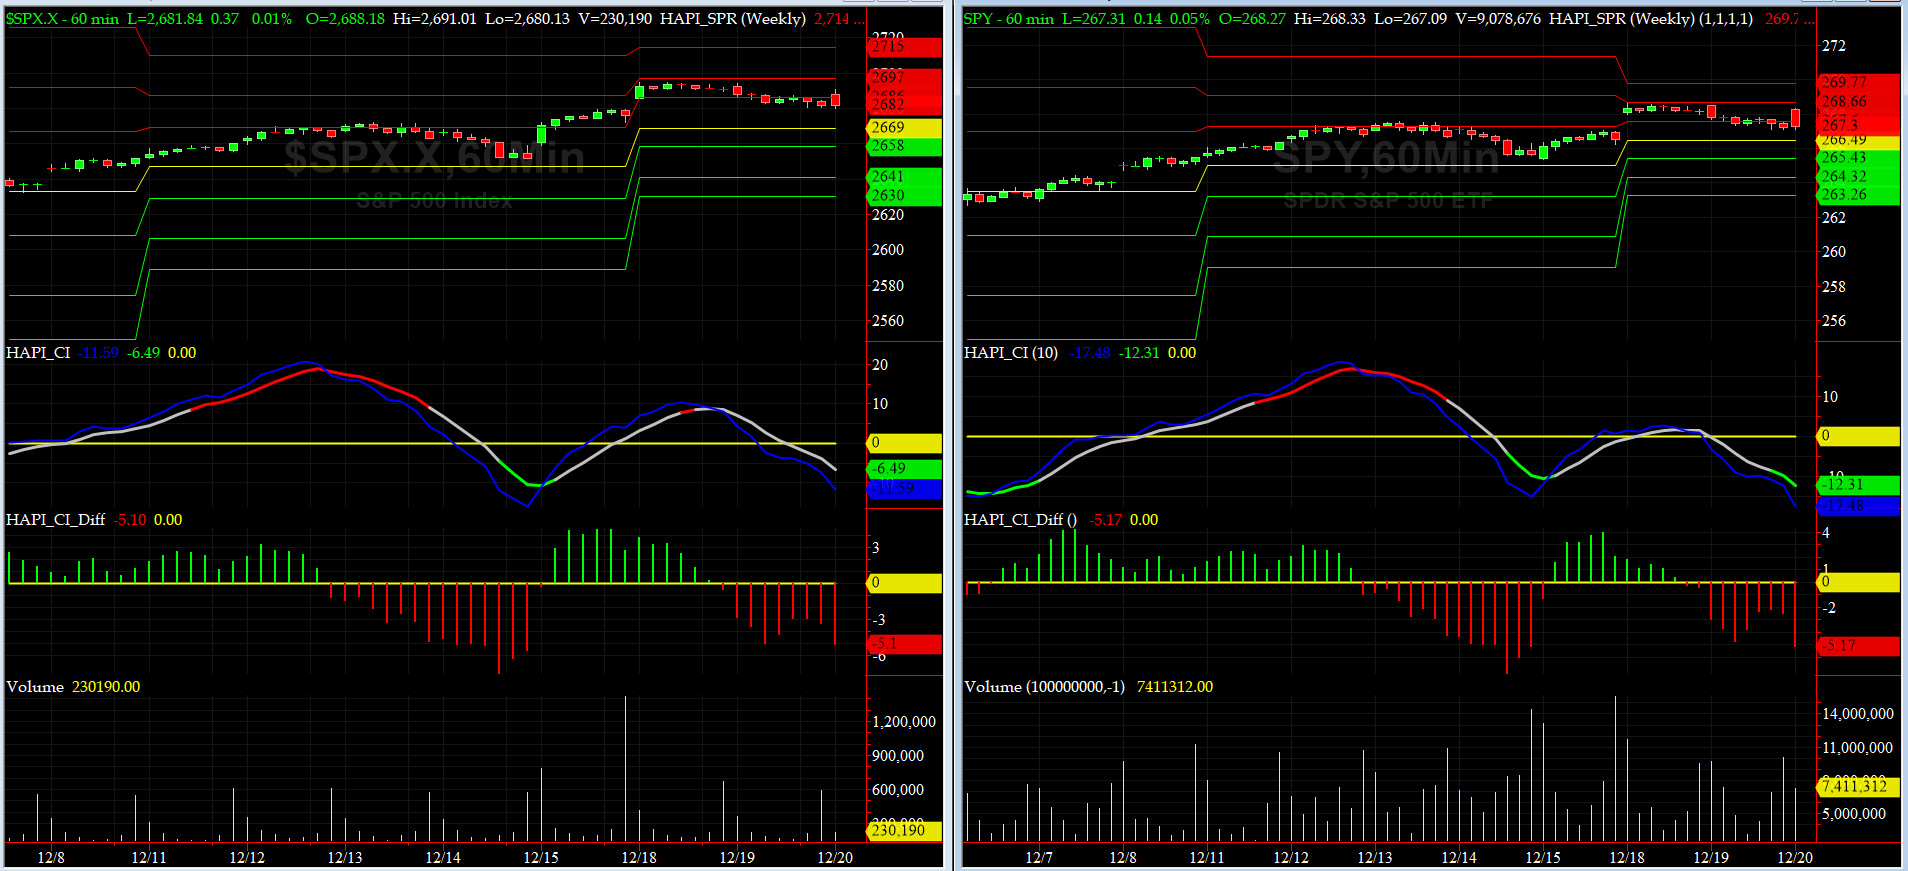
Current DAILY +2 Sigma SPX = 2686 with WEEKLY +2 Sigma = 2685
Current DAILY 0 Sigma (20 day MA) SPX = 2630 with WEEKLY 0 Sigma = 2541
Current DAILY -2 Sigma SPX = 2575 with WEEKLY -2 Sigma = 2397
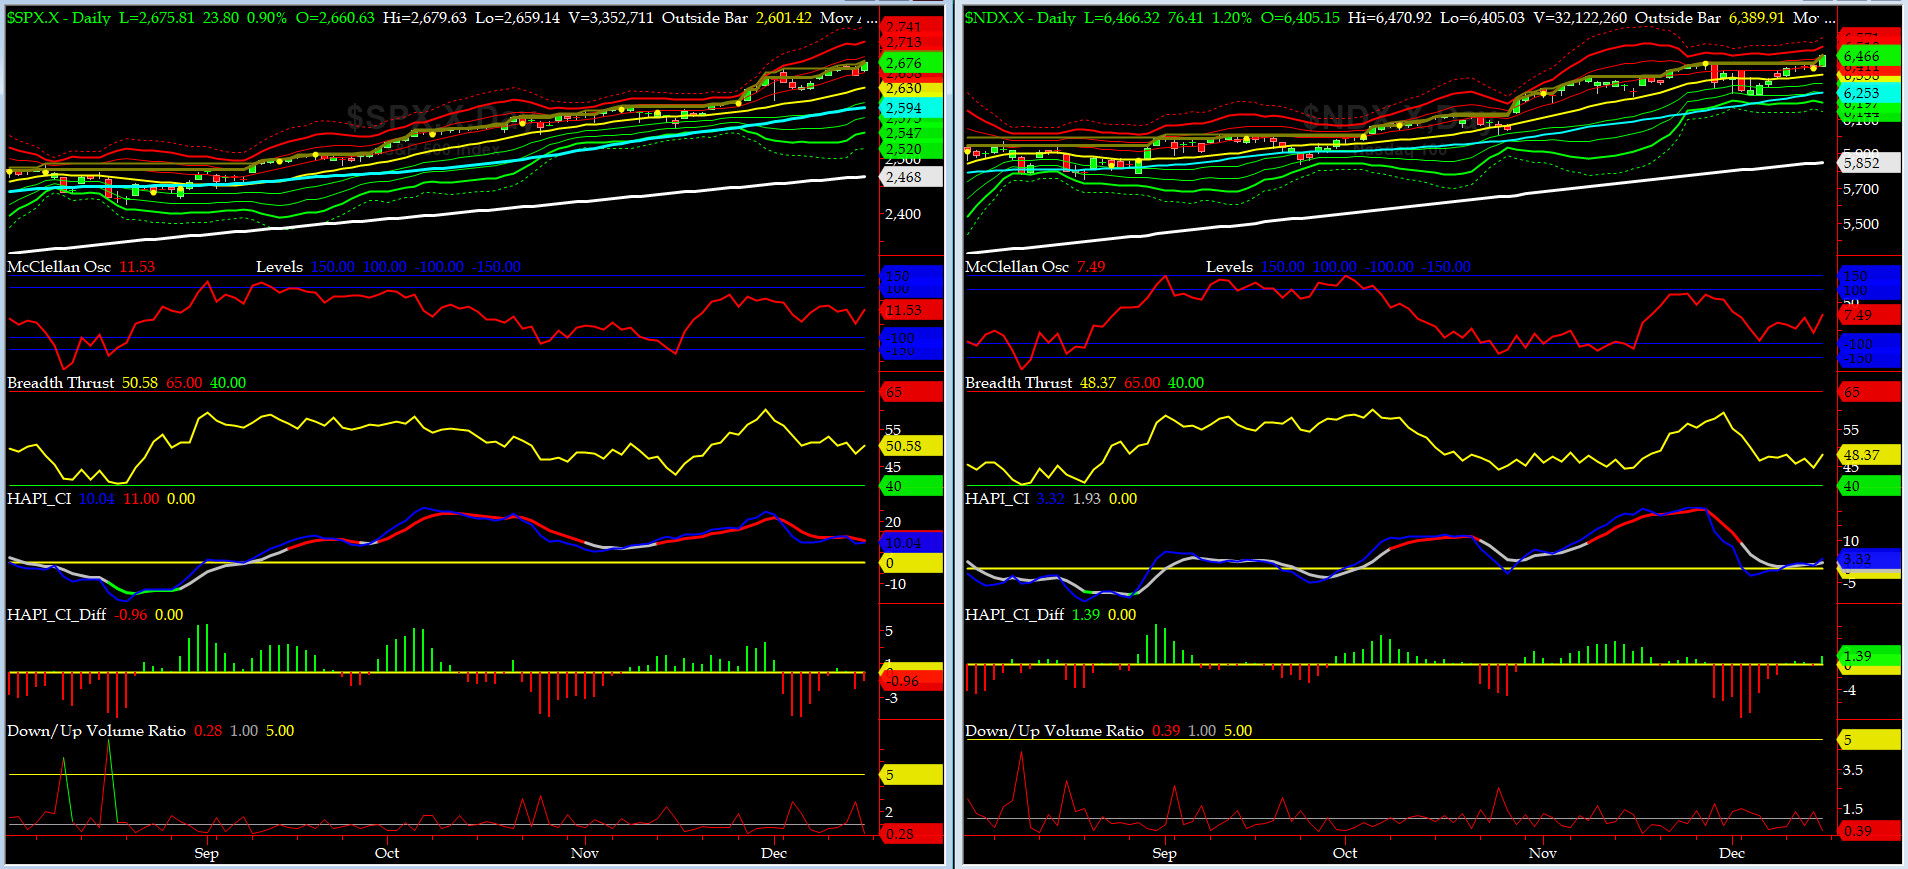
NYSE McClellan Oscillator = +11.5 (-150 is start of the O/S area; around -275 to -300 area or lower, we go into the �launch-pad� mode, over +150, we are in O/B area)
NYSE Breadth Thrust = 50.6 (40 is considered as oversold and 65 as overbought)
More volatility this past week, and again, they bought the dips. This game will work until it does not. Stay Alert & Be Defensive 24/6.
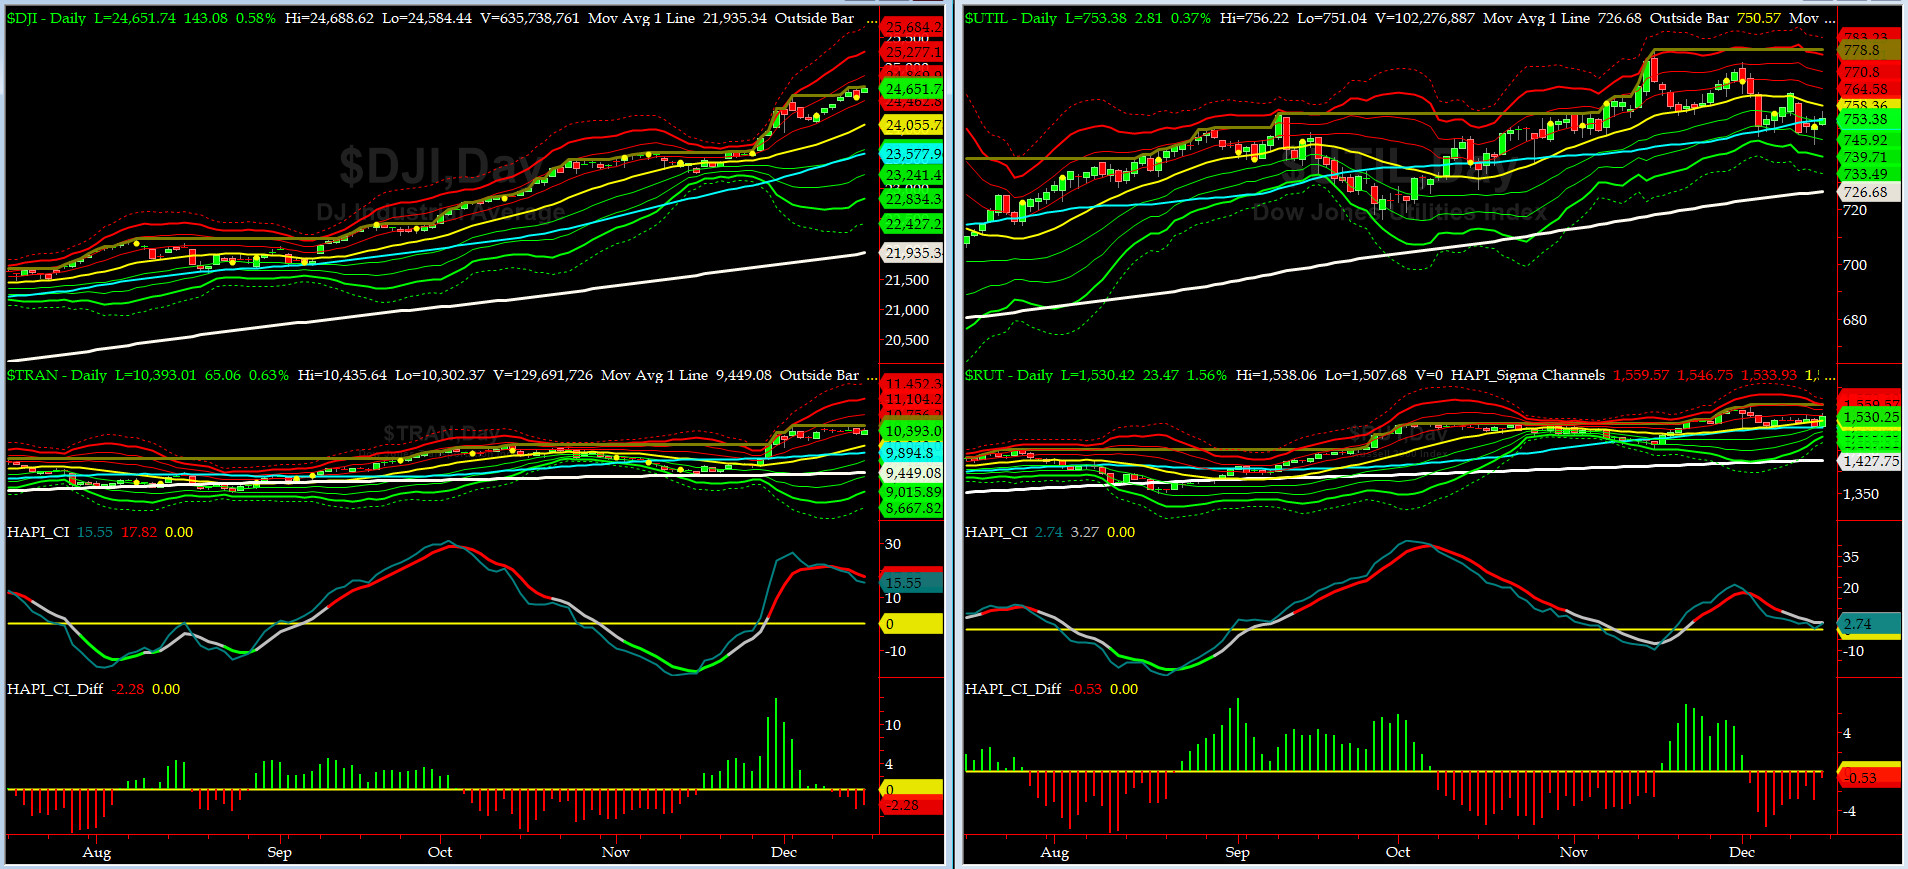
Canaries [in the Coal Mine] Chart for DJ TRAN & RUT Indices
200-Day MA DJ TRAN = 9449 or 10% above DJ TRAN (max observed in last 7 yrs = 20.2%, min = -20.3%)
200-Day MA RUT = 1427 or 7.2% above RUT (max observed in last 7 yrs = 21.3%, min = -22.6%)
DJ Transportation Index (proxy for economic conditions 6 to 9 months hence) volatility also hit DJ Tran and they bought that too. New ATHs ahead? yes, we think so.
Russell 2000 Small Caps Index (proxy for Risk ON/OFF) sold off more but again nothing to write home about. On Friday, it rallied hard. RISK is definitely still ON.
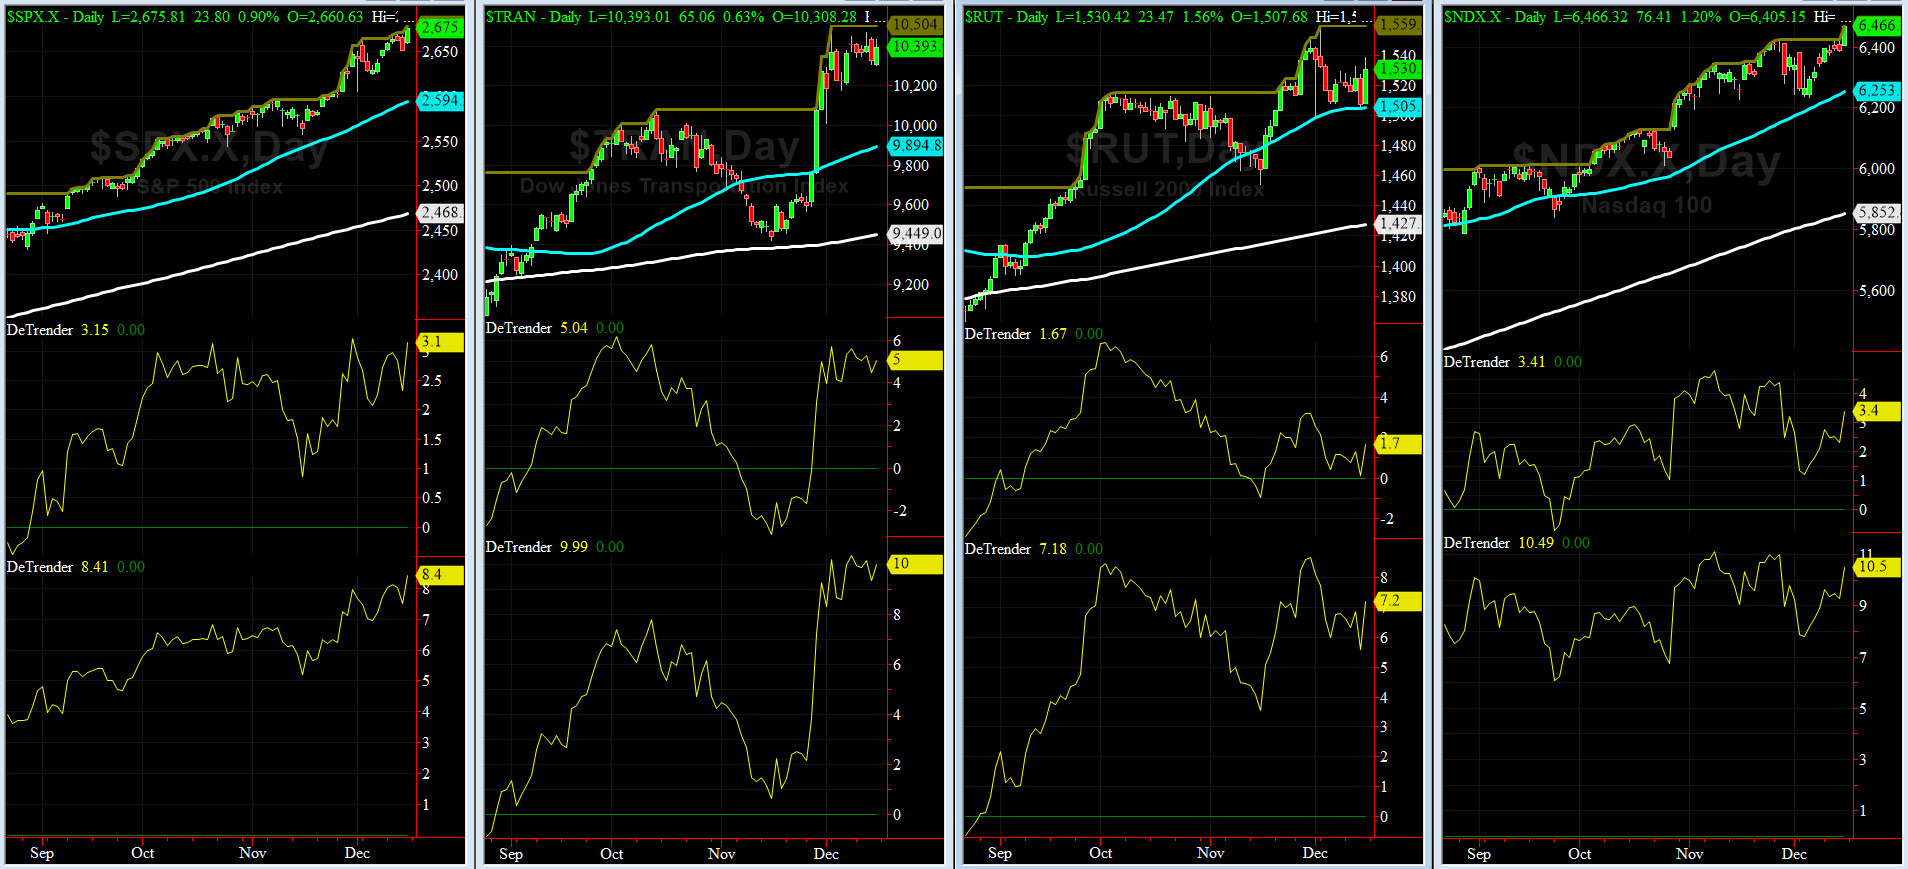
DeTrenders Charts for SPX, NDX, TRAN & RUT Indices
50-Day MA SPX = 2594 or 3.1% below SPX (max observed in last 7 yrs = +8.6%, min = -9.3%)
200-Day MA SPX = 2468 or 8.4% below SPX (max observed in last 7 yrs = 15.2%, min = -14%)
All of our EIGHT DeTrenders are in POSITIVE territory. The DeTrenders for DJ Tran & RUT will continue to be harbingers of future price behavior in broad indices.
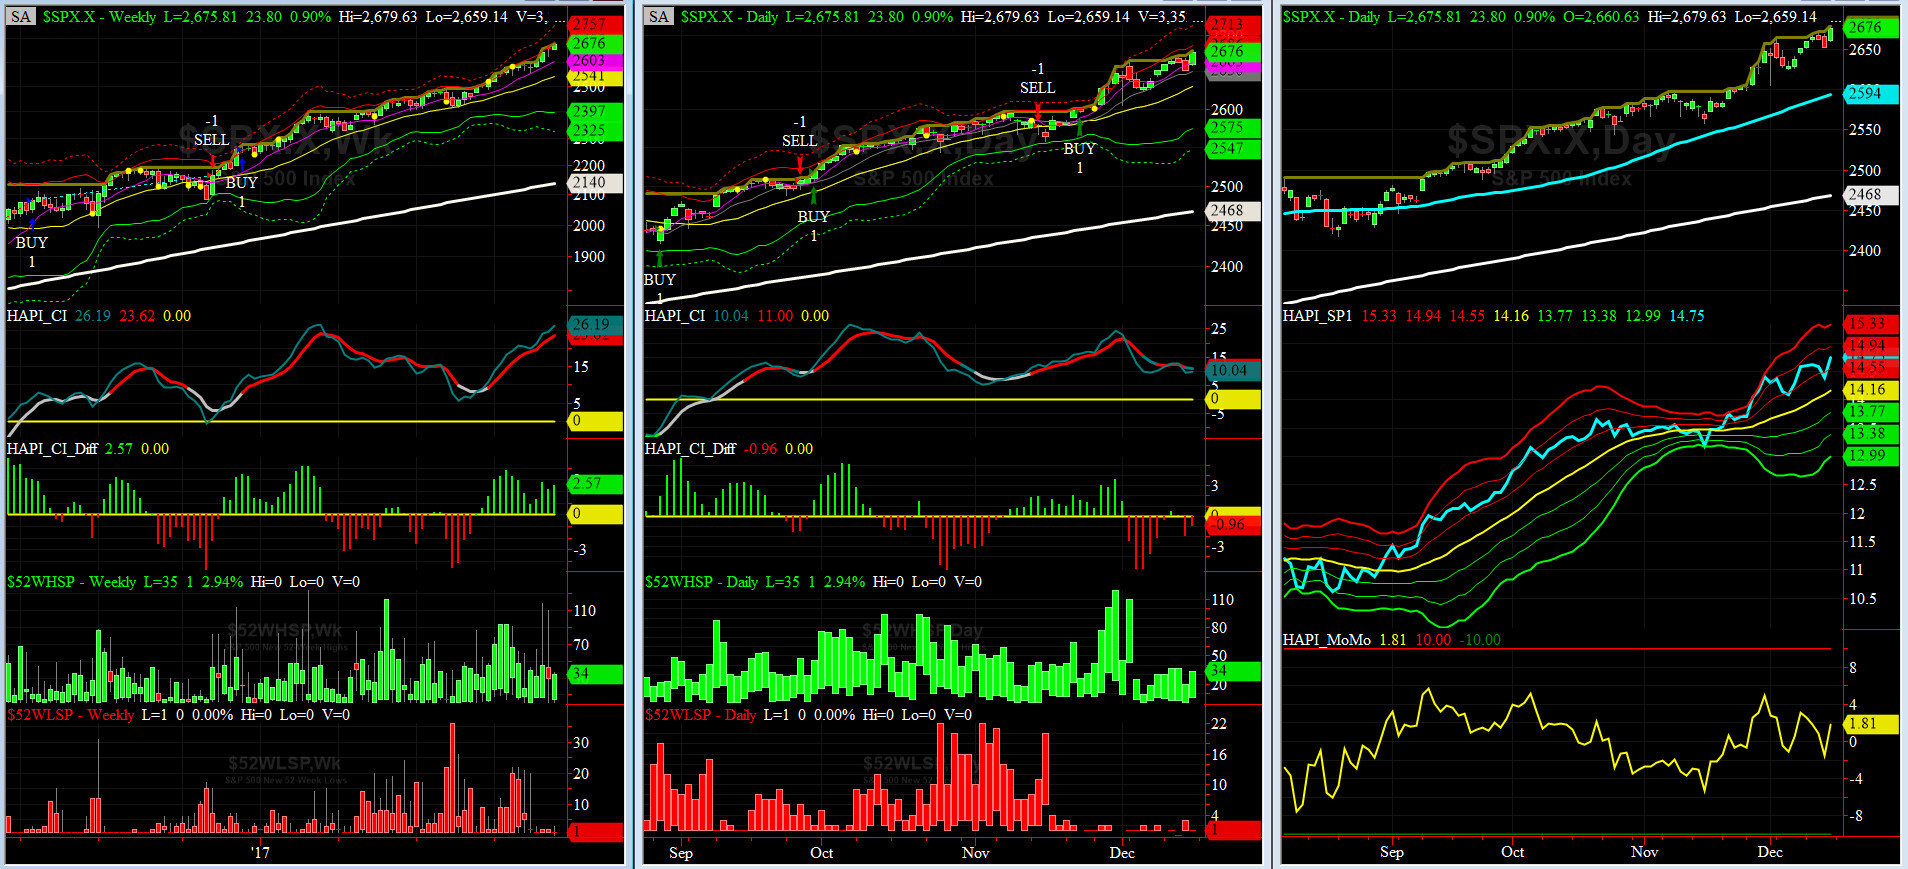
HA_SP1_Momo Chart
WEEKLY Timing Model = on a BUY Signal since Friday 12/16/16 CLOSE at 2258
DAILY Timing Model = on a BUY Signal since Wednesday 11/22/17 CLOSE at 2597
Max SPX 52wk-highs reading last week = 37 (over 120-140, the local maxima is in)
Max SPX 52wk-Lows reading last week = 3 (over 40-60, the local minima is in)
HA_SP1 closed near its +1.5 sigma channels
HA_Momo = +1.8 (reversals most likely occur above +10 or below -10)
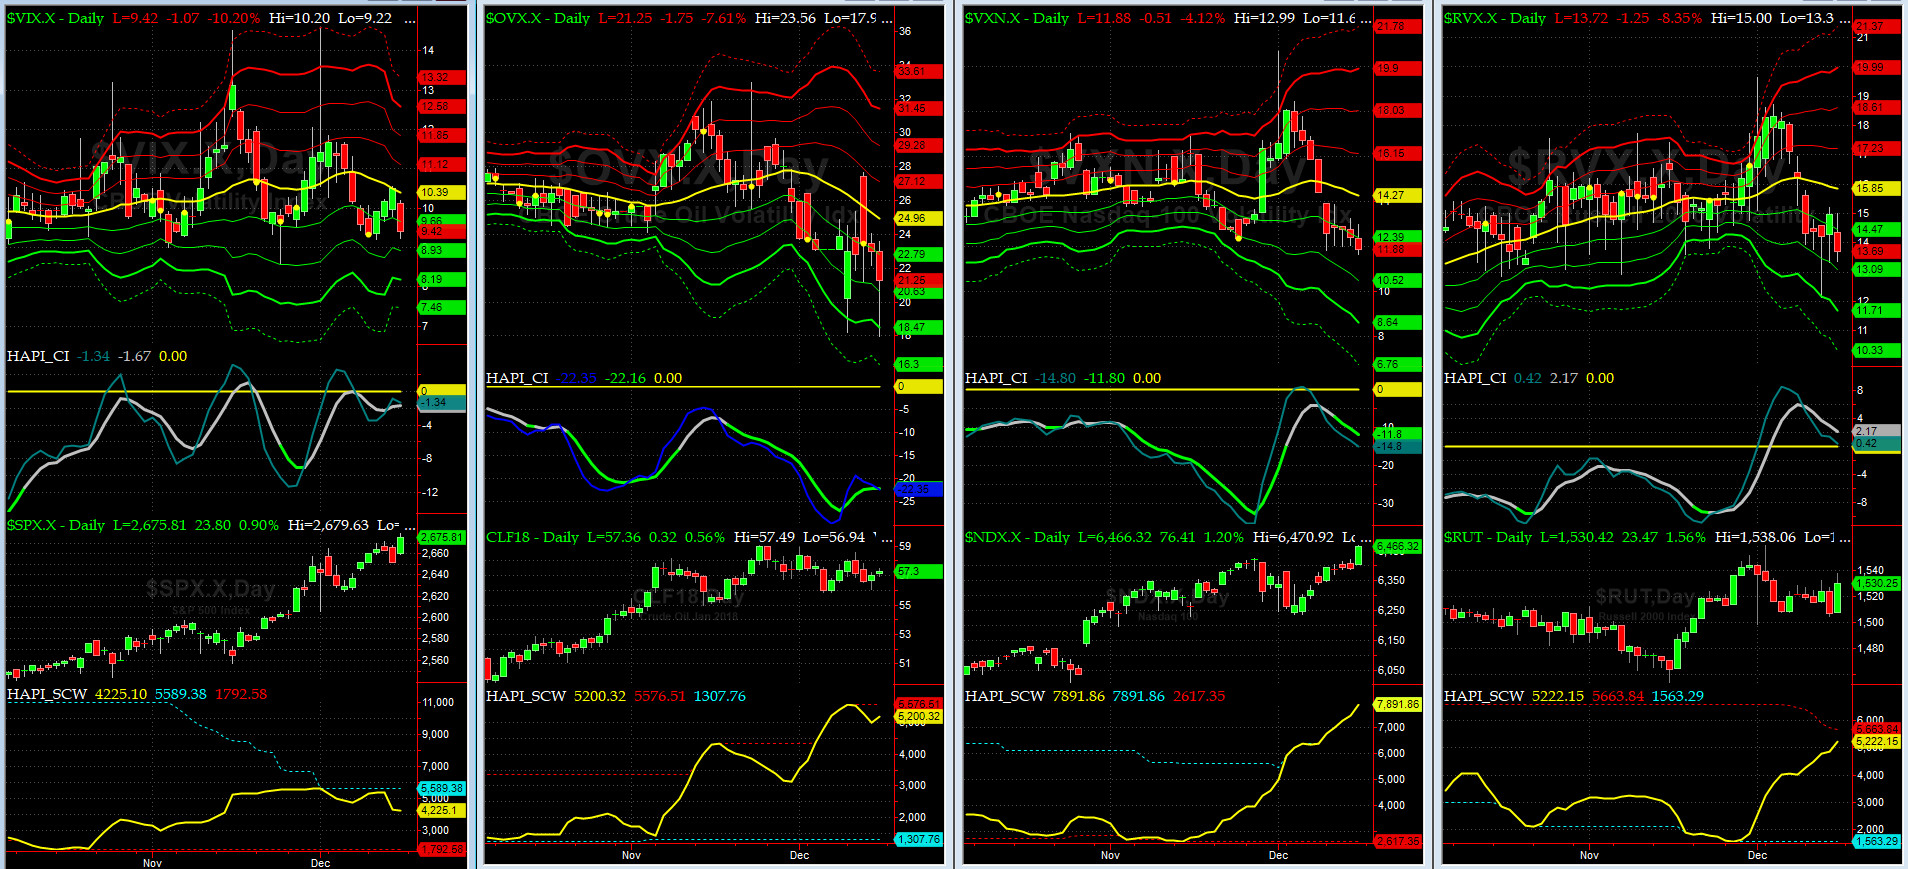
Vol of the Vols Chart
VIX currently stands at 9.42, at about its -1.5 sigma (remember it's the VIX volatility pattern ( its sigma channels) that matters, and not the level of VIX itself (this is per Dr. Robert Whaley, a great mentor and inventor of original VIX, now called VXO ). VIX usually peaks around a test of its +4 sigma).
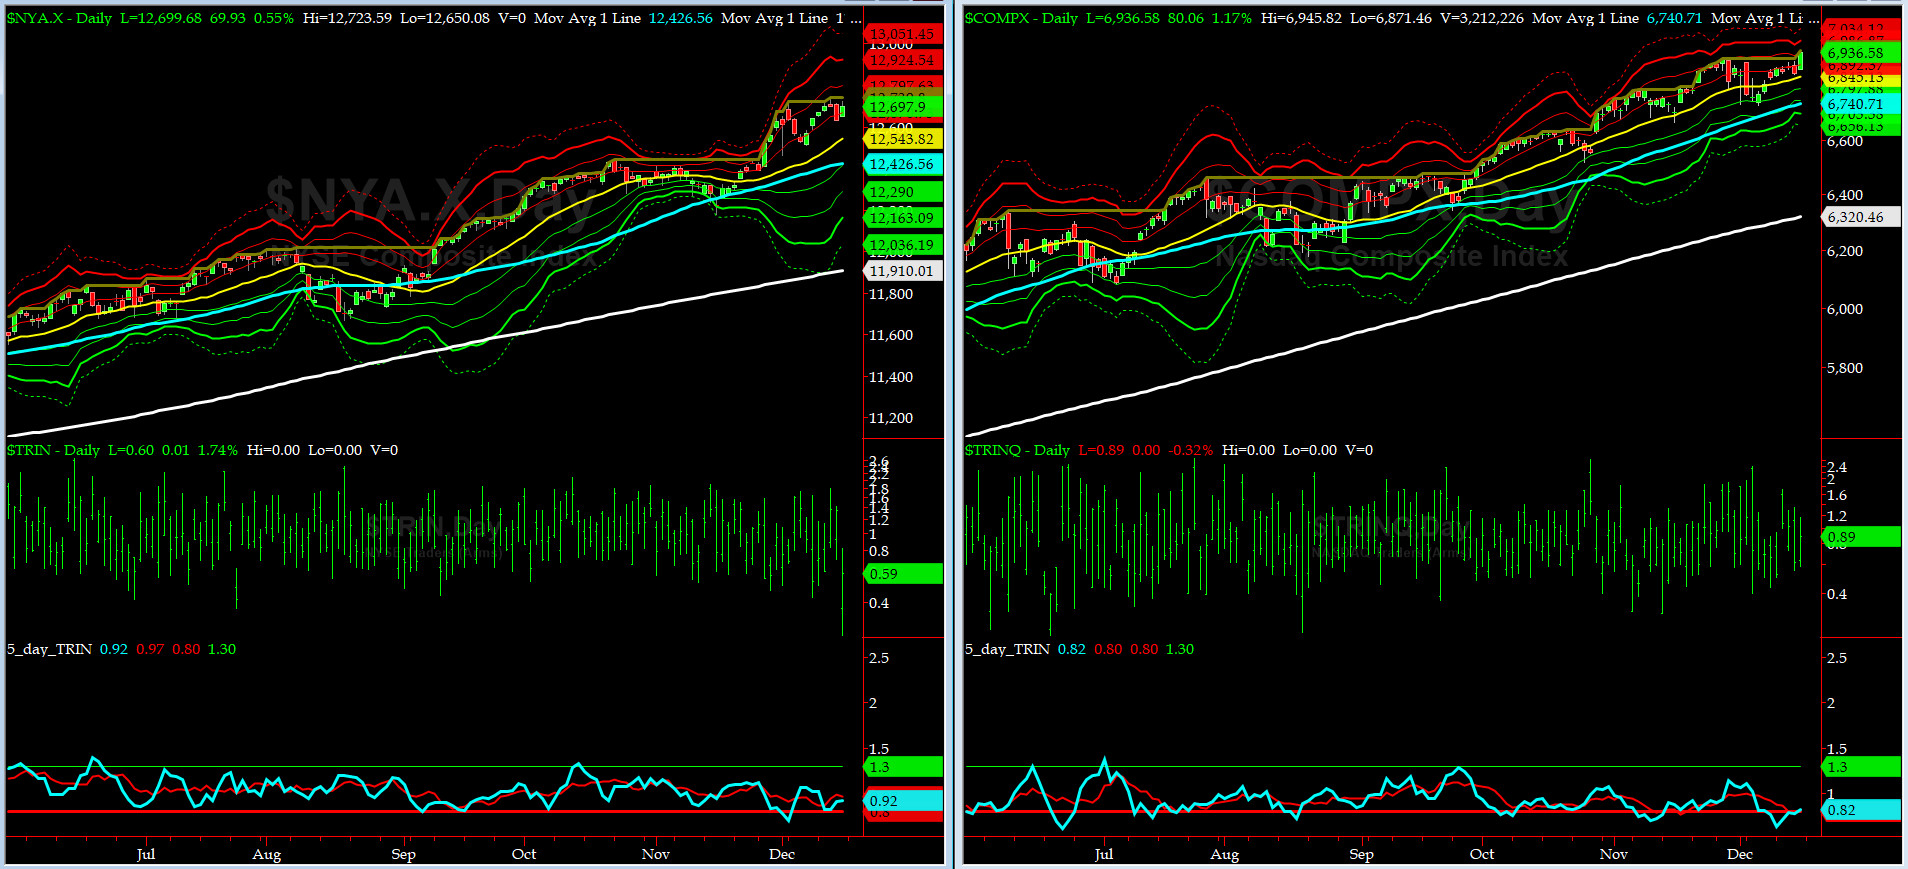
5-day TRIN & TRINQ Charts
Again, NYSE 5-day TRIN is in the NEUTRAL zone but its NASDAQ brethren is stuck in SELL zone.
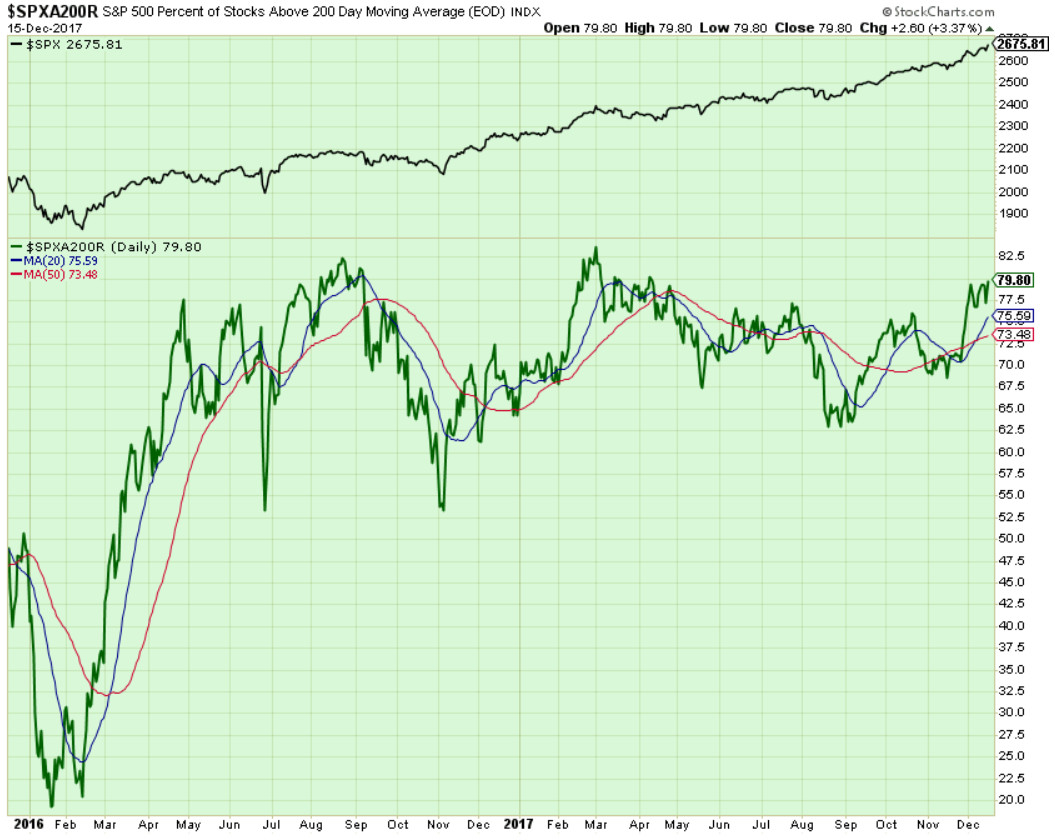
Components of SPX above their respective 200day MA Chart
This scoring indicator went sideways this past week & closed at 79.80.
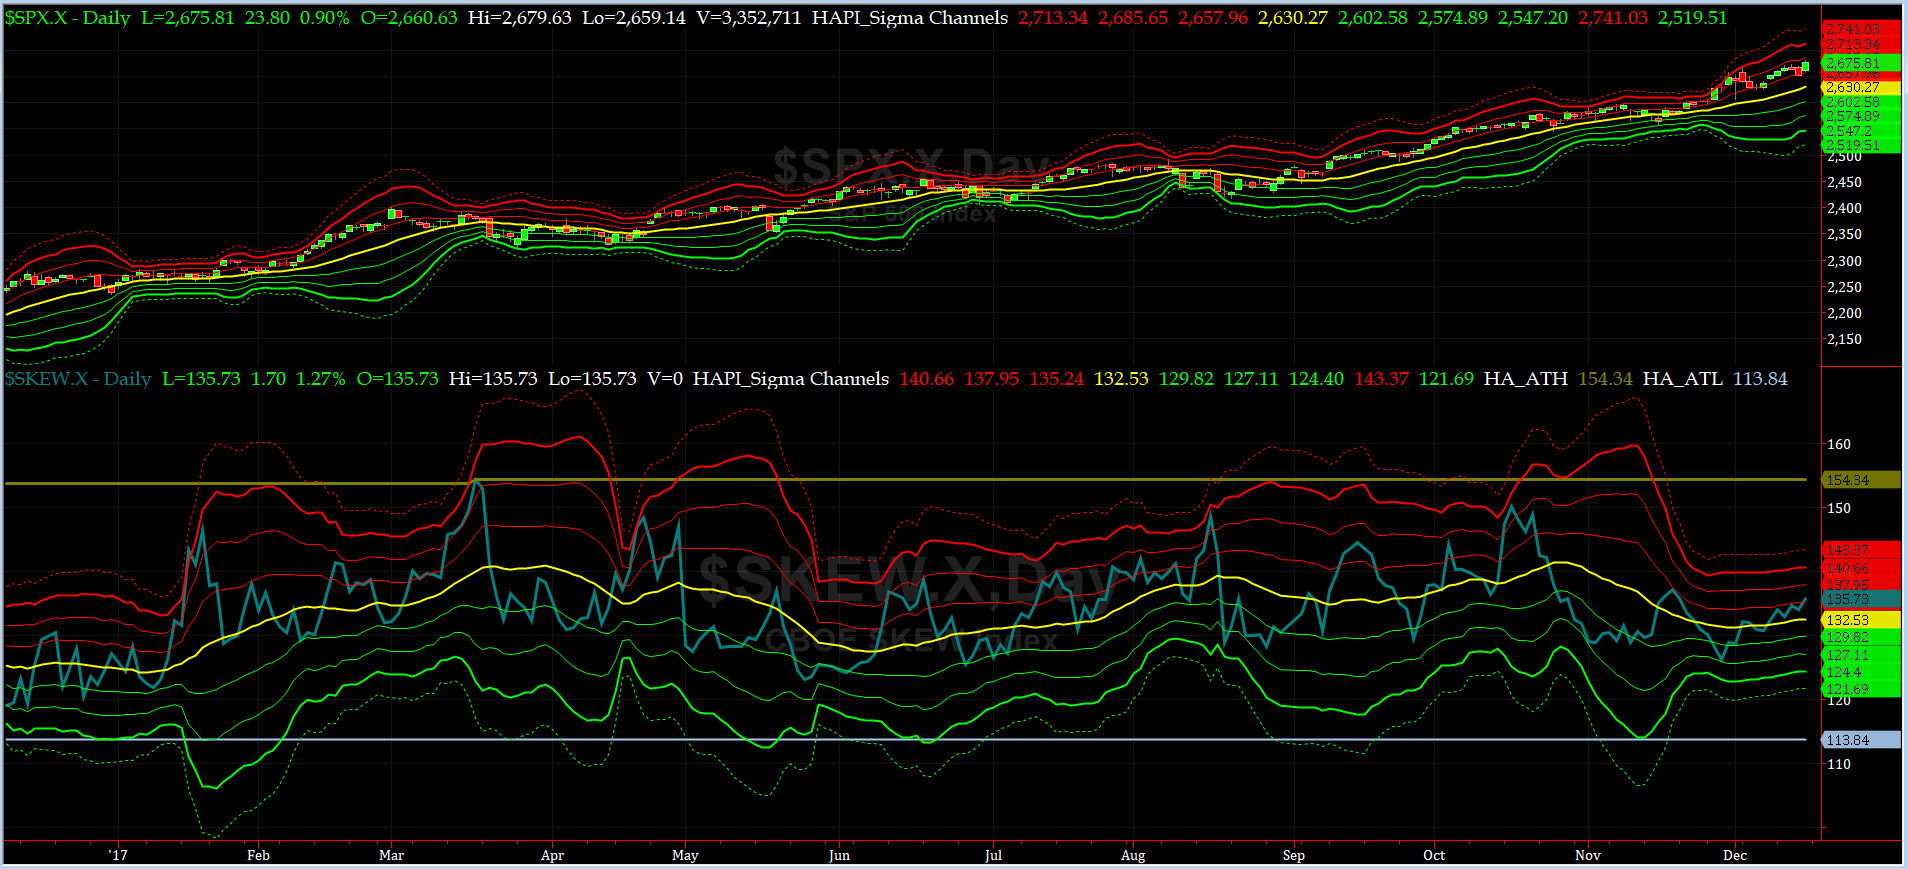
SPX SKEW (Tail Risk) Chart
Last week SPX SKEW (Tail Risk) closed at ~135, or about its +1 sigma (normal = 120-125, range 100-150).
Is all quiet on the Eastern & Mid-Western Fronts? Smart Money says 'maybe.'
How to interpret the value of SPX SKEW? (from CBOE white paper on SKEW)

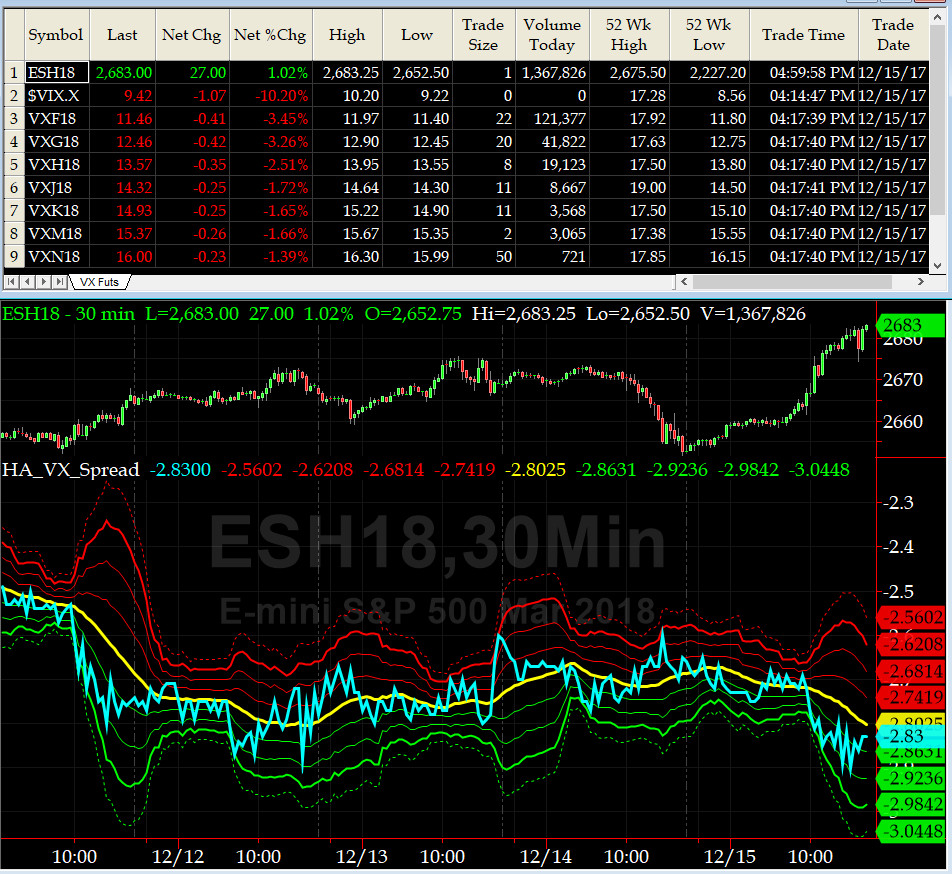
3-month VIX Futures Spread(VX) Chart
This popular timing indicator (now rolled to LONG JAN18 + SHORT APR18 VX Futures) closing at -2.86. Equity markets are still in short-term overbought zone.
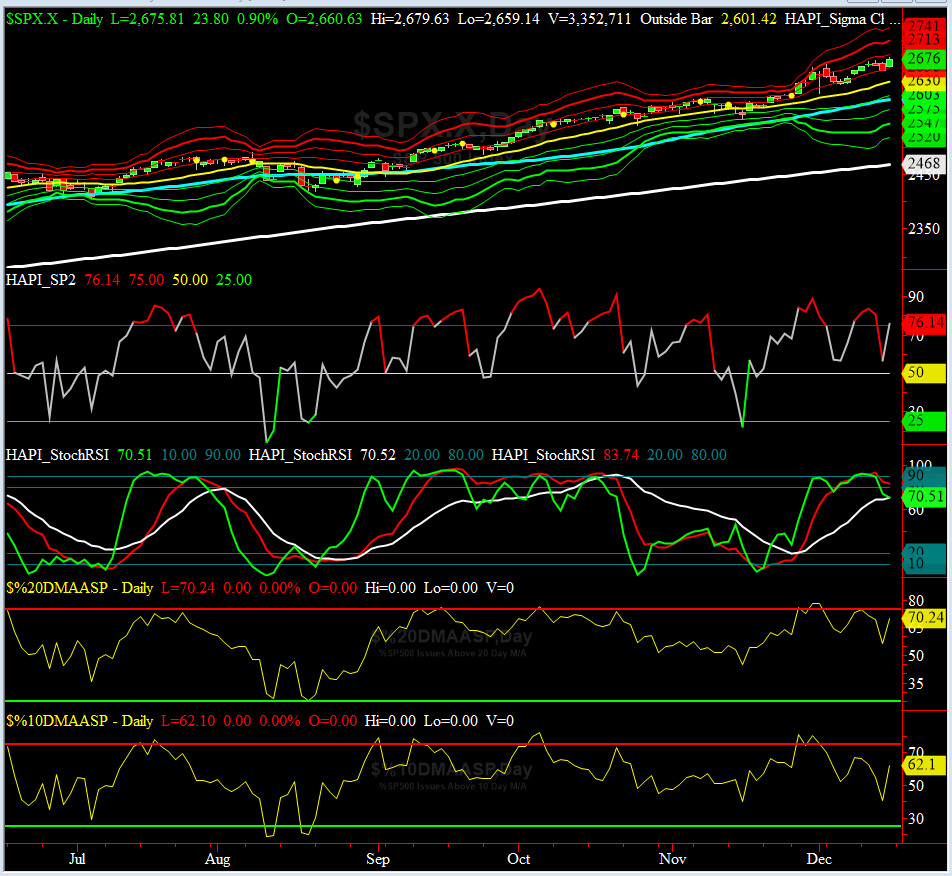
HA_SP2 Chart
HA_SP2 = 76.14 (Buy signal <= 25, Sell Signal >= 75)
While this coveted timing indicator rallied from 77 to ~84 and then plunged to 56, it managed to rally up on Friday to close at 76. Yes, we are still in mildly overbought condition.
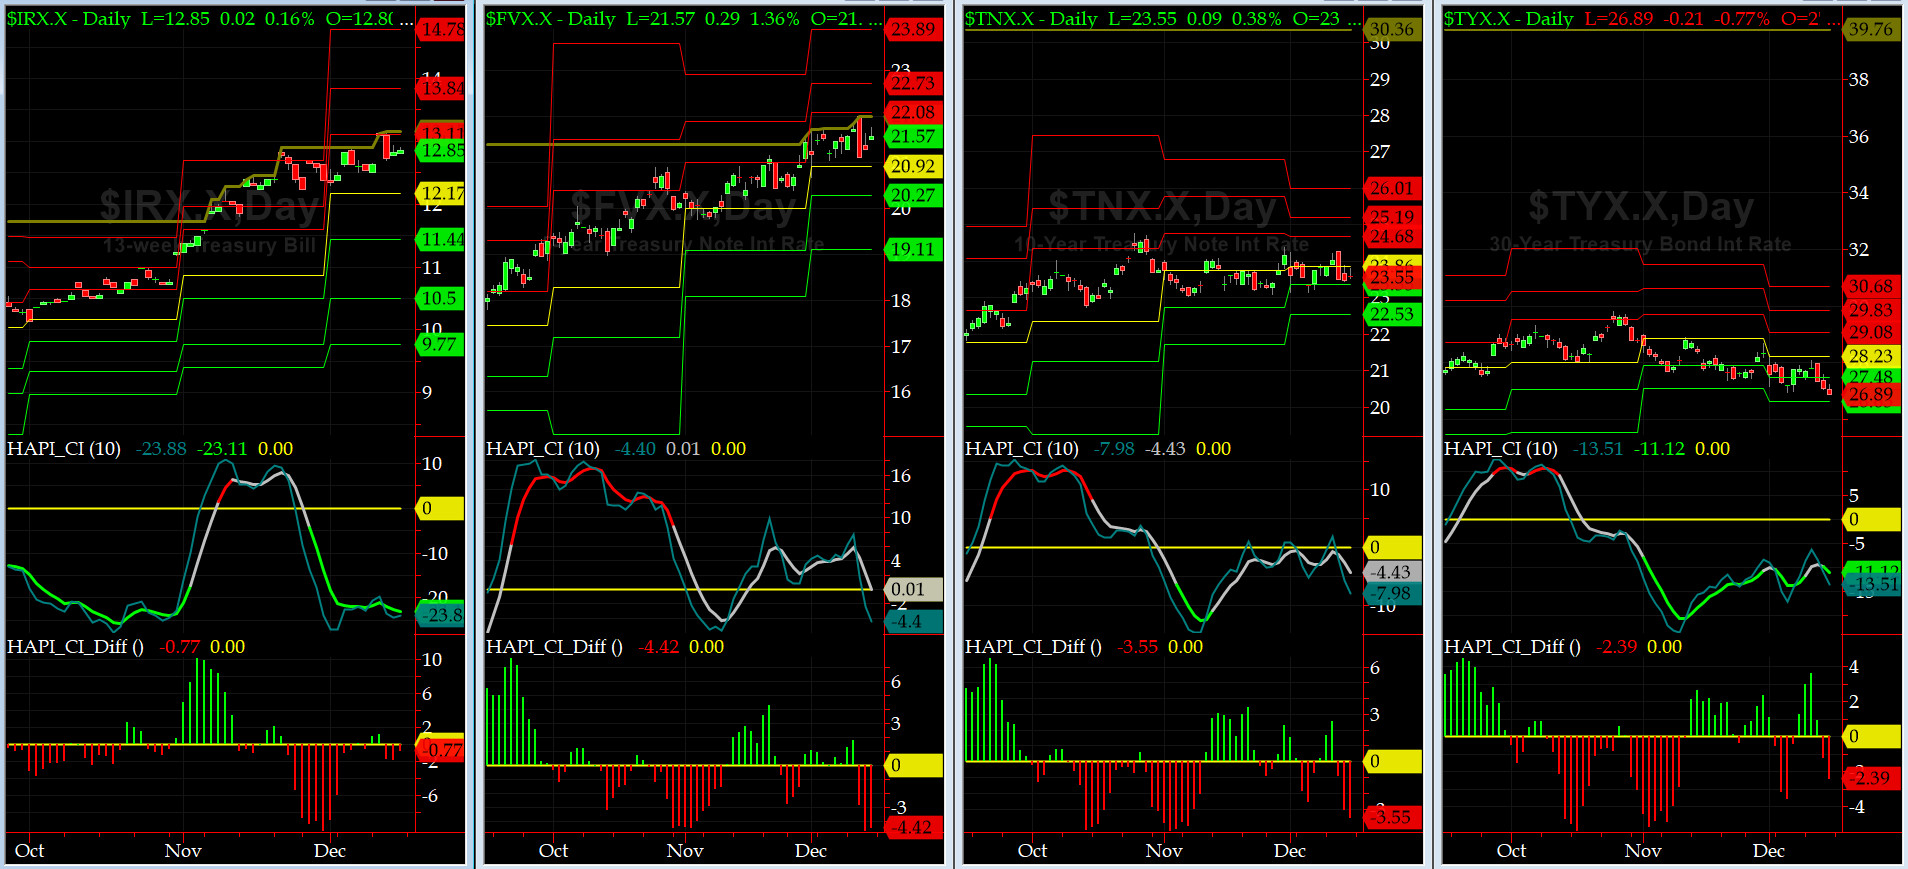
US Treasury T-Notes & T-Bonds Yields Chart
During this past week, while the front-end of the Treasury Curve rose to new 5-year highs, on balance, the Yield Curve went nowhere fast.
Fari Hamzei
|


 Proactive Market Timing