|
Monday, January 15, 2018, 2230ET
Market Timing Charts, Analysis & Commentary for Issue #224
Timer Charts of S&P-500 Cash Index (SPX) + NASDAQ-100 Cash Index (NDX)
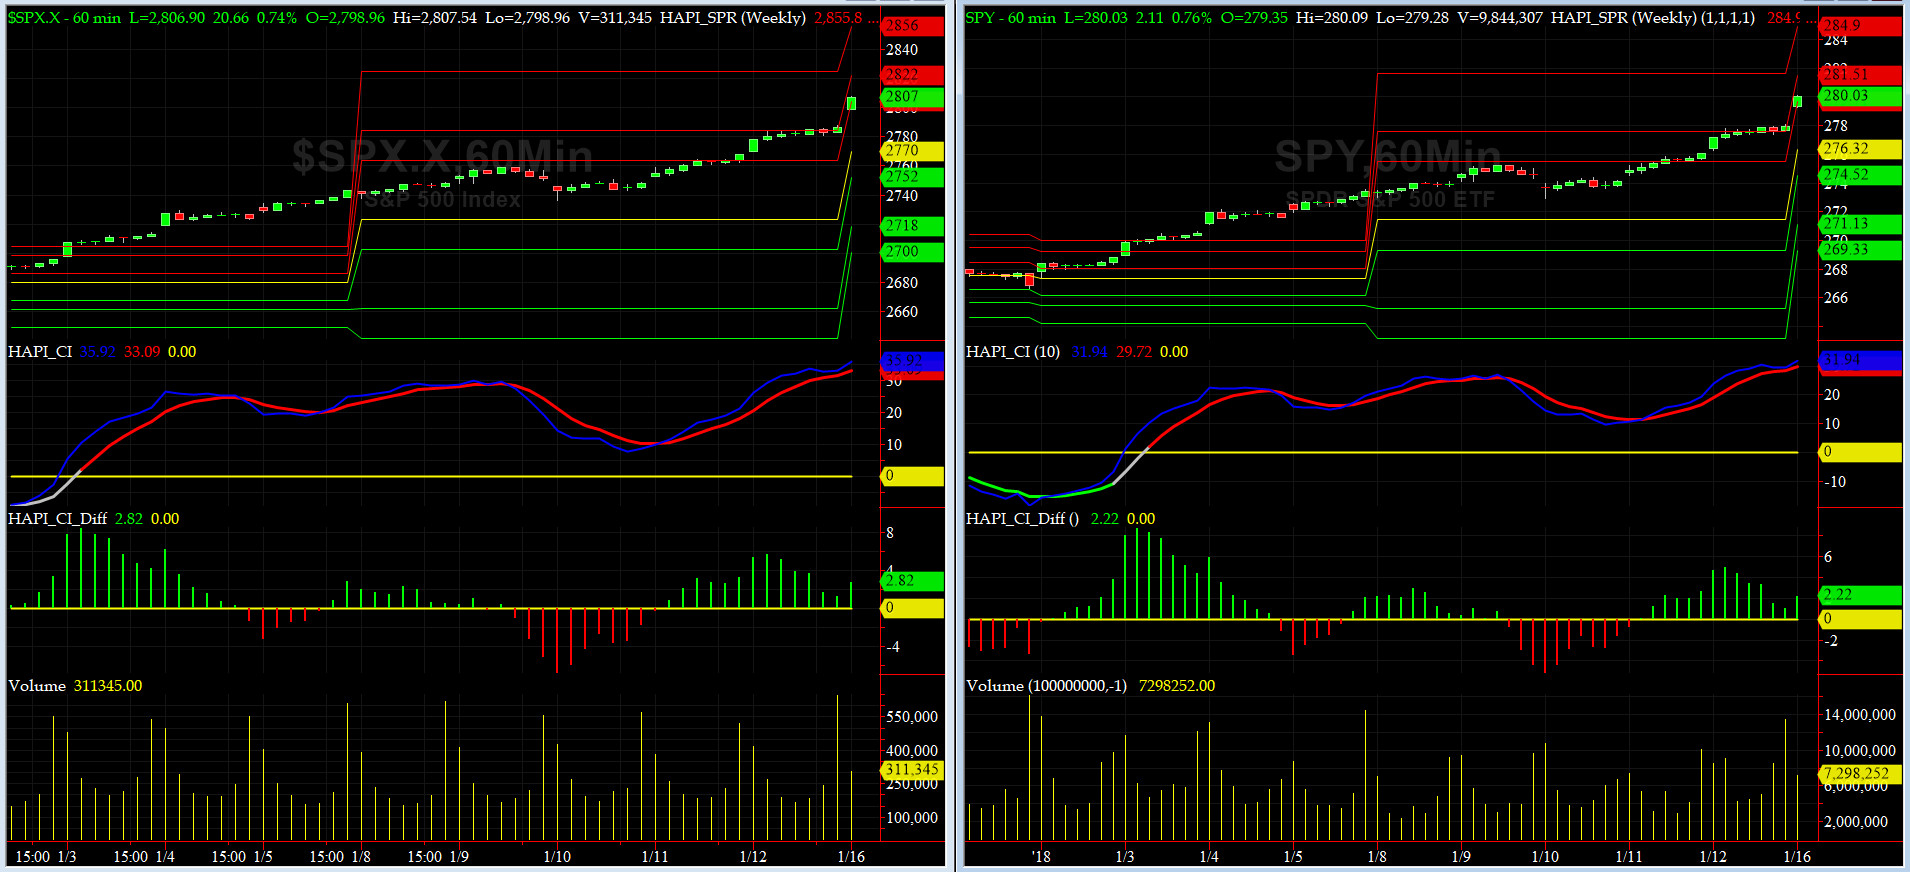
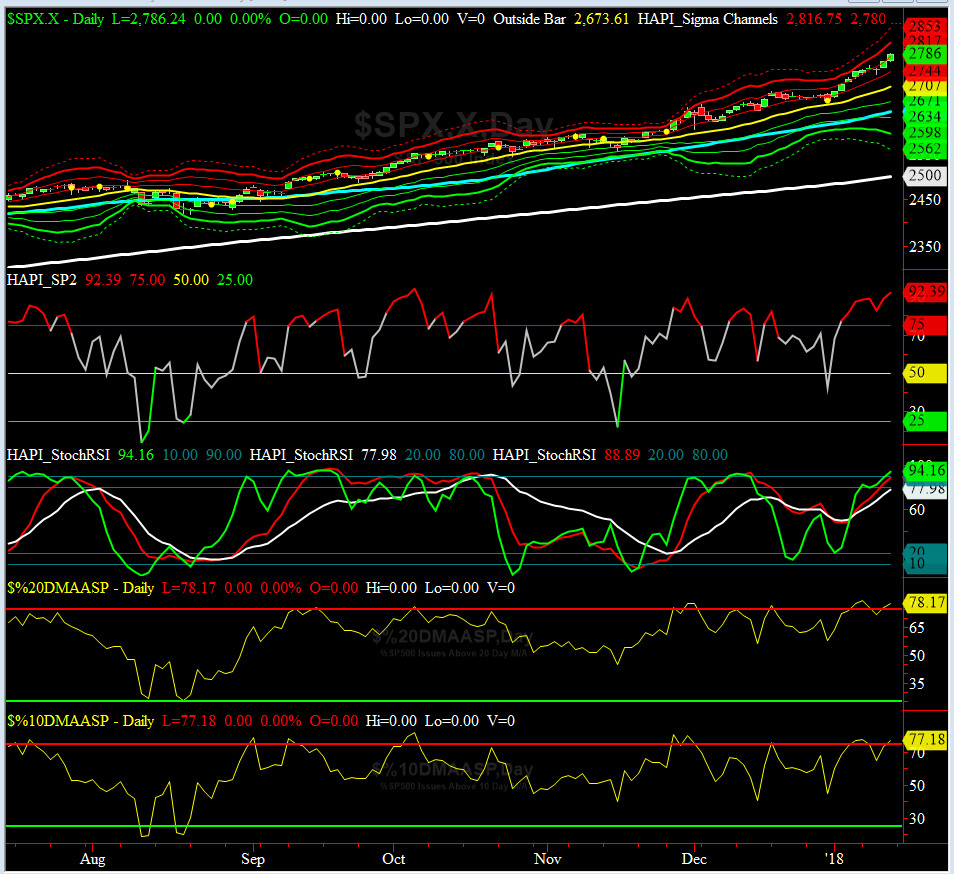
Most recent S&P-500 Cash Index (SPX): 2786.24 up +43.09 (up 1.57%) for the week ending on Friday, January 12, 2018, which closed above its +2 sigma.
SPX ALL TIME INTRADAY HIGH = 2787.85 (reached on Friday, Jan 12, 2018)
SPX ALL TIME CLOSING HIGH = 2786.25 (reached on Friday, Jan 12, 2018)
Current DAILY +2 Sigma SPX = 2780 with WEEKLY +2 Sigma = 2766
Current DAILY 0 Sigma (20 day MA) SPX = 2707 with WEEKLY 0 Sigma = 2596
Current DAILY -2 Sigma SPX = 2634 with WEEKLY -2 Sigma = 2426
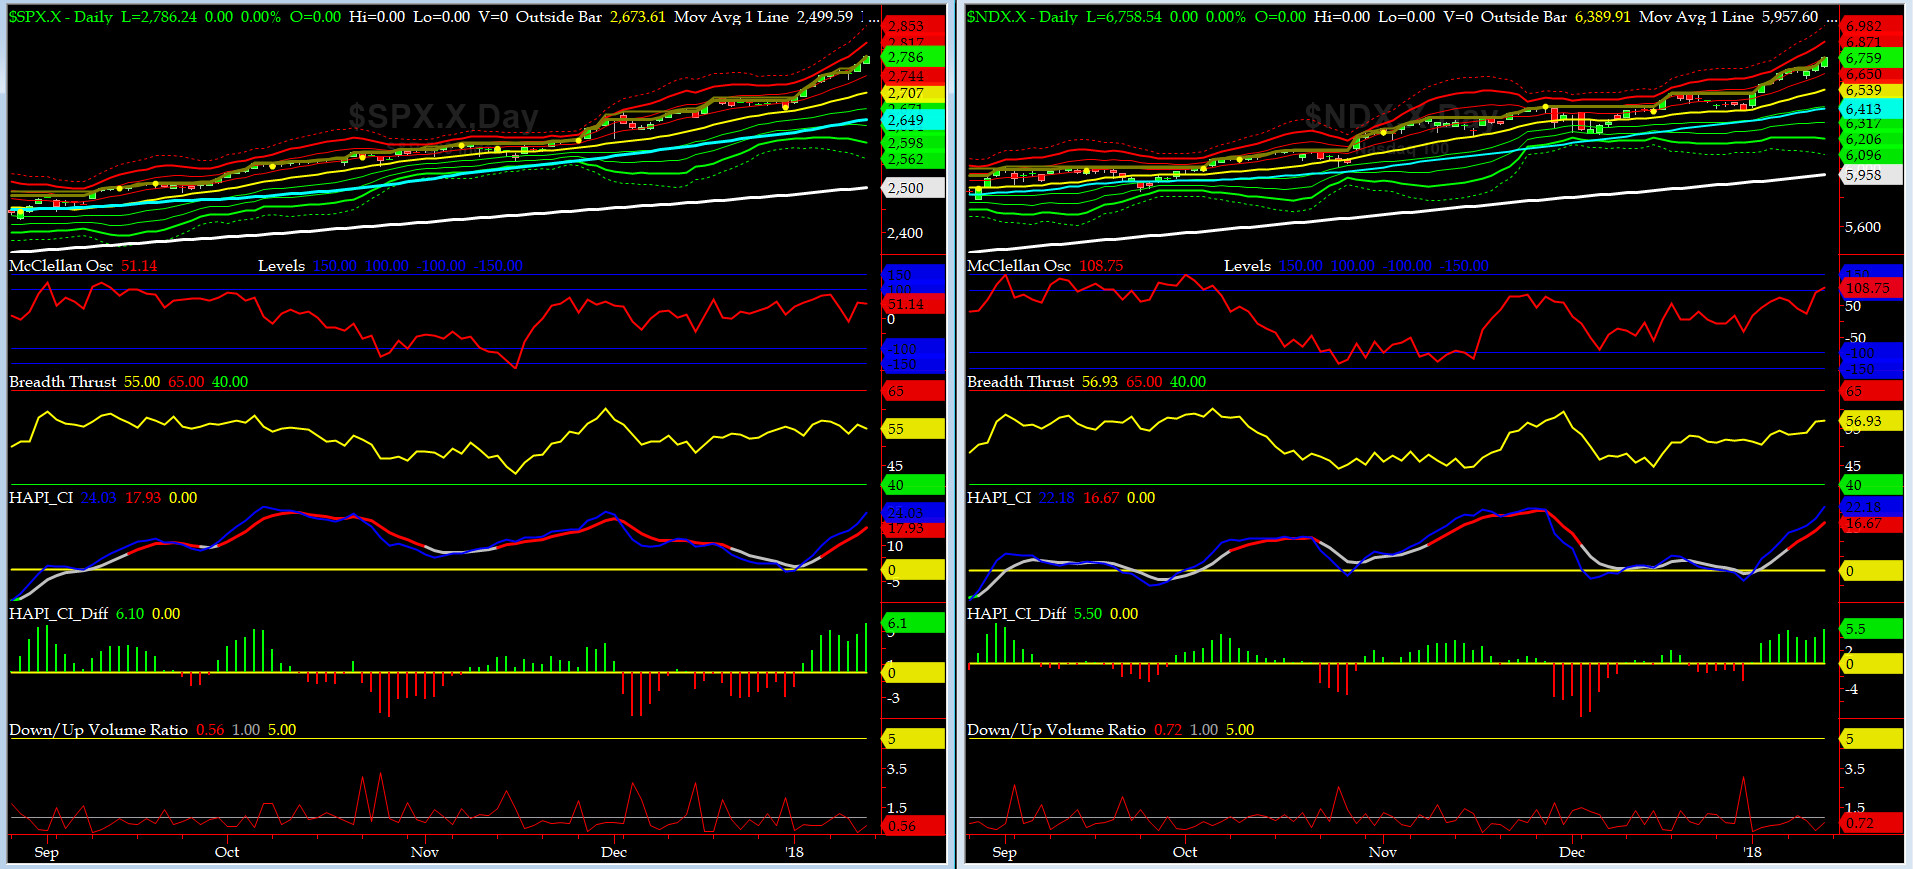
NYSE McClellan Oscillator = +51 (-150 is start of the O/S area; around -275 to -300 area or lower, we go into the �launch-pad� mode, over +150, we are in O/B area)
NYSE Breadth Thrust = 55(40 is considered as oversold and 65 as overbought)
We are overbought, some even argue extremely overbought. This is NOT the place to get long but being short has been costly even with defined risk (put spreads).

Canaries [in the Coal Mine] Chart for DJ TRAN & RUT Indices
200-Day MA DJ TRAN = 9600 or 18.5% above DJ TRAN (max observed in last 7 yrs = 20.2%, min = -20.3%)
200-Day MA RUT = 1444 or 10.2% above RUT (max observed in last 7 yrs = 21.3%, min = -22.6%)
DJ Transportation Index (proxy for economic conditions 6 to 9 months hence) again rallied pretty hard and now getting close to be stretched out by historical standards.
Russell 2000 Small Caps Index (proxy for Risk ON/OFF) also had a strong week and put in multiple ATH. RISK continues to be ON.
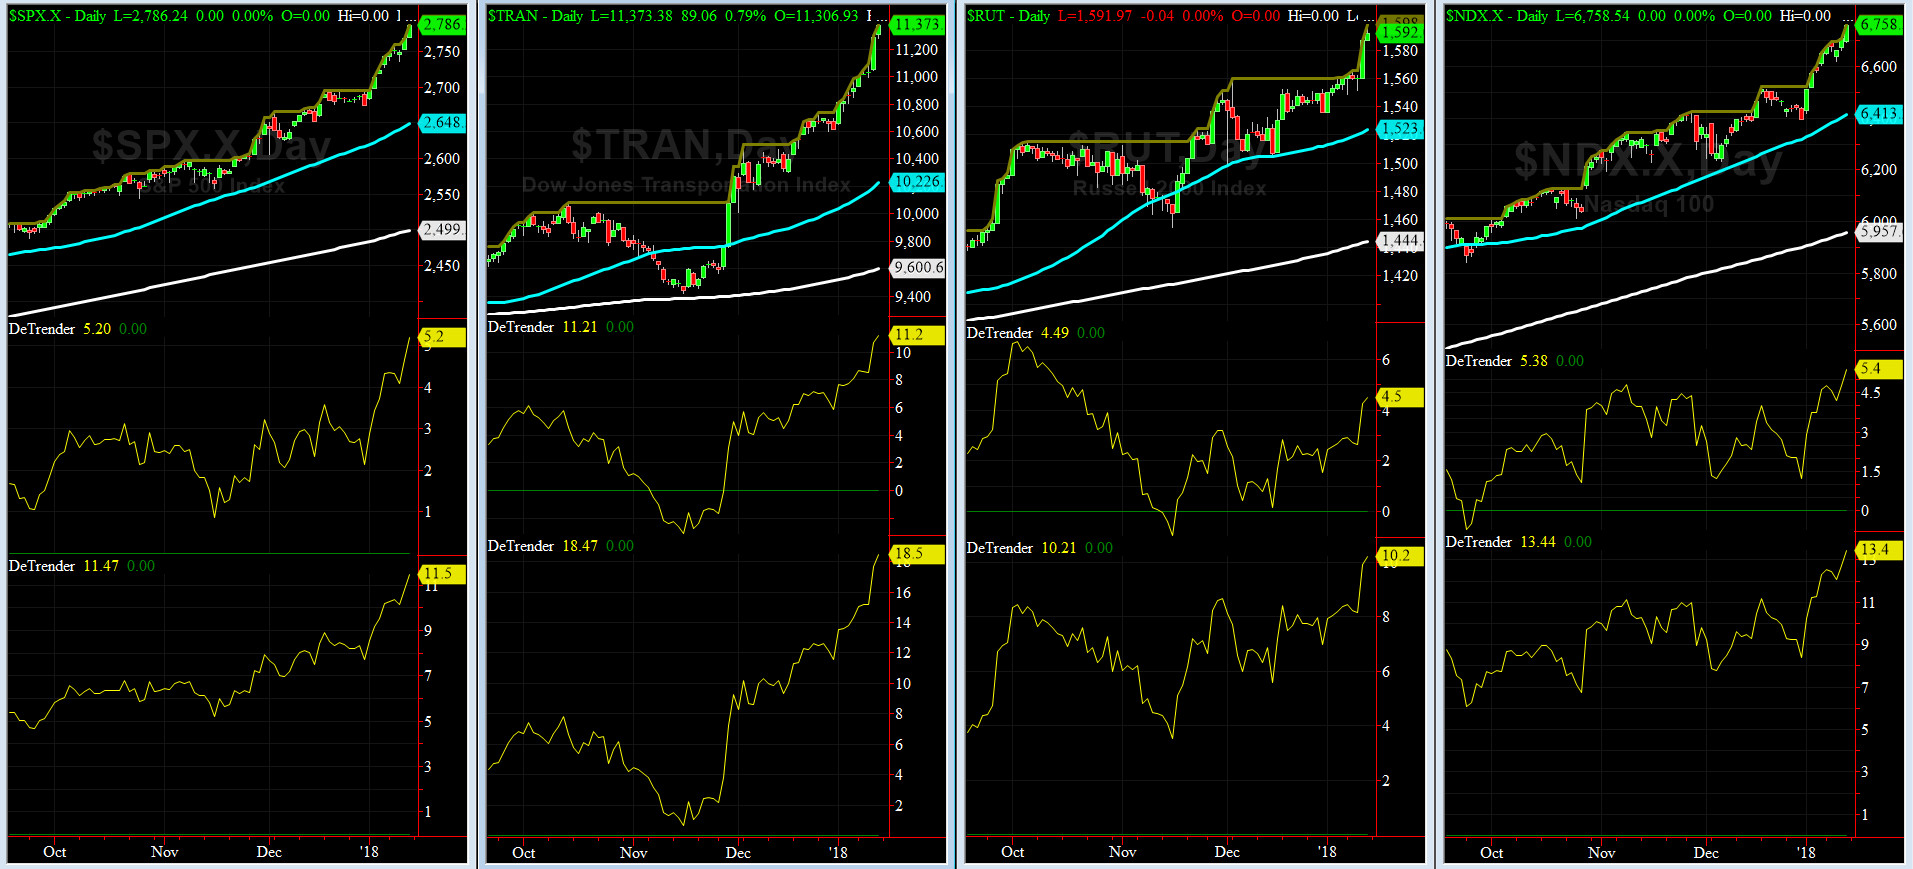
DeTrenders Charts for SPX, NDX, TRAN & RUT Indices
50-Day MA SPX = 2648 or 5.2% below SPX (max observed in last 7 yrs = +8.6%, min = -9.3%)
200-Day MA SPX = 2499 or 11.5% below SPX (max observed in last 7 yrs = 15.2%, min = -14%)
All of our EIGHT DeTrenders are in POSITIVE territory. The DeTrenders for DJ Tran & RUT will continue to be harbingers of future price behavior in broad indices.
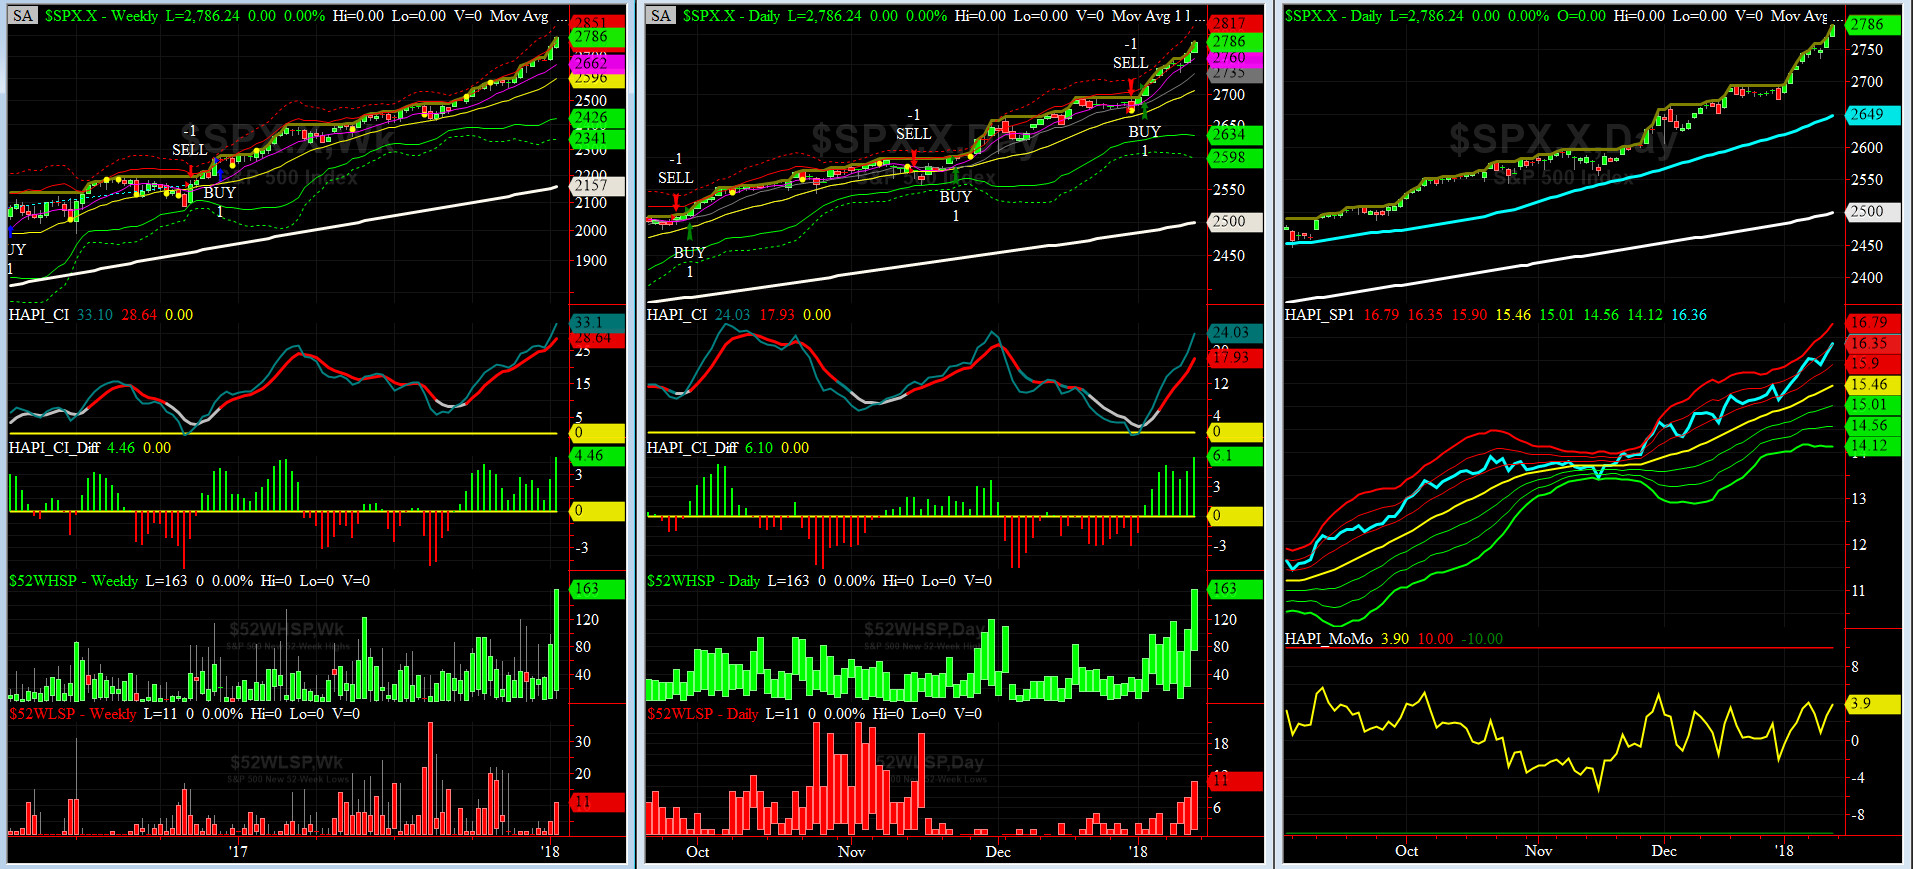
HA_SP1_Momo Chart
WEEKLY Timing Model = on a BUY Signal since Friday 12/16/16 CLOSE at 2258
DAILY Timing Model = on a BUY Signal since Wednesday 1/3/18 CLOSE at 2713
Max SPX 52wk-highs reading last week = 163 (over 120-140, the local maxima is in)
Max SPX 52wk-Lows reading last week = 11 (over 40-60, the local minima is in)
HA_SP1 closed over its +2 sigma channels
HA_Momo = +3.9 (reversals most likely occur above +10 or below -10)
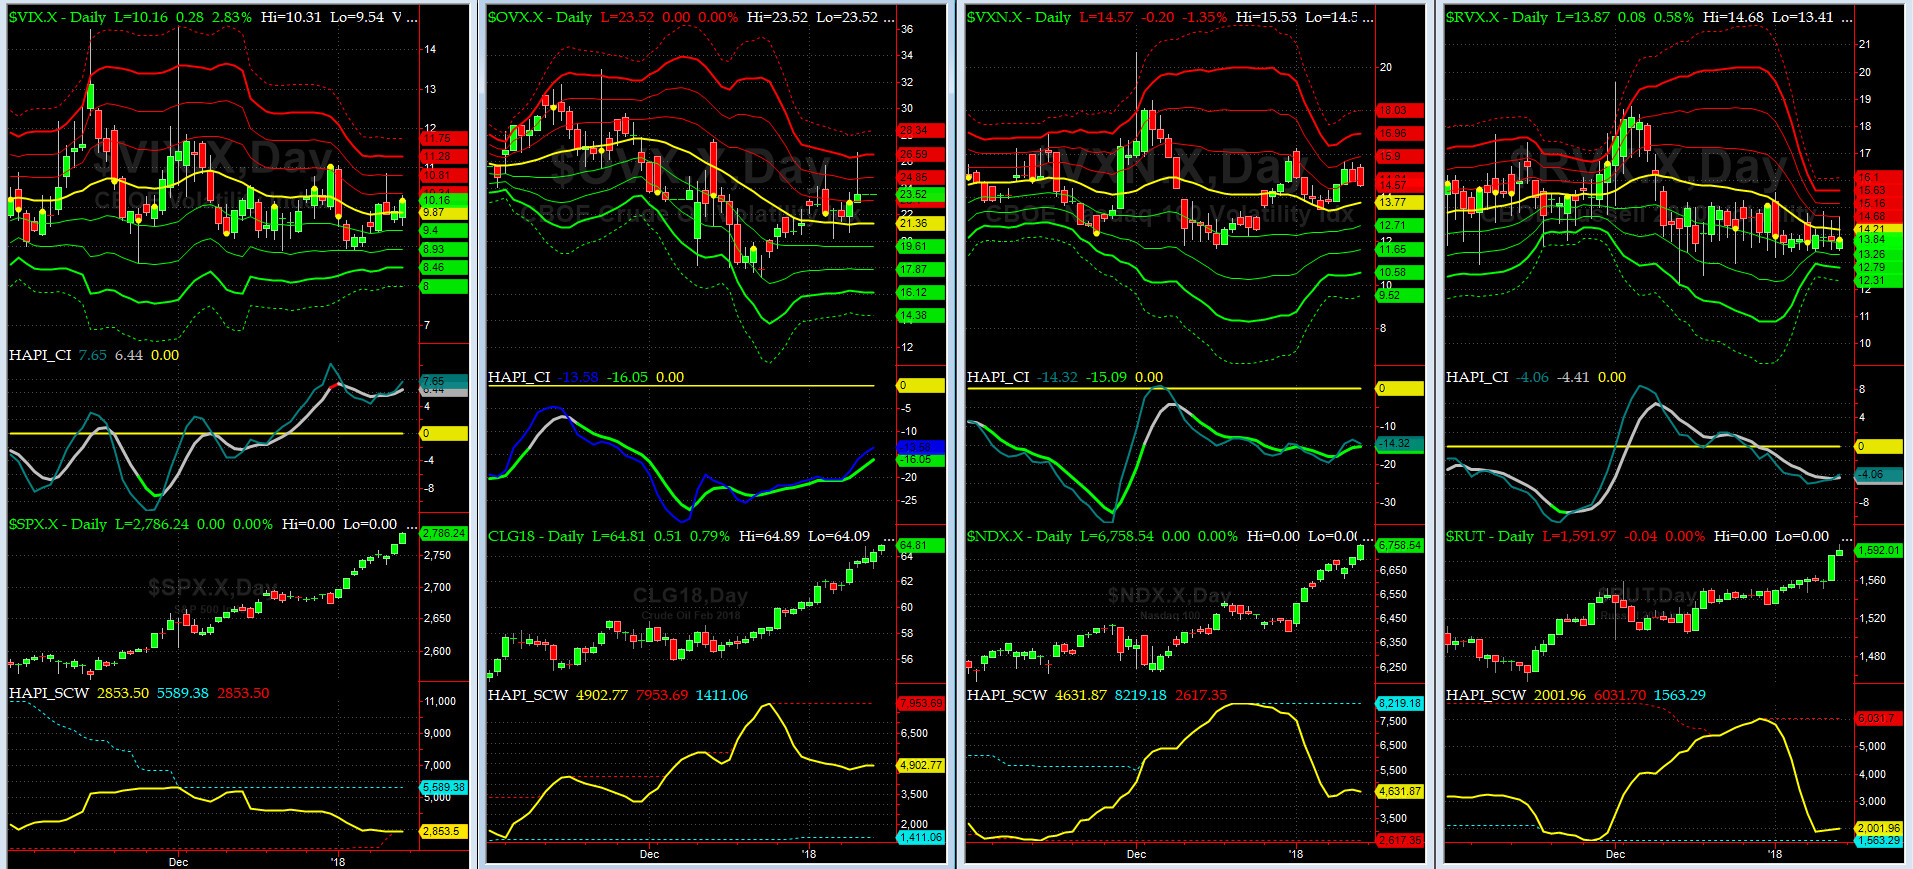
Vol of the Vols Chart
VIX currently stands at 10.16, at about its +1 sigma (remember it's the VIX volatility pattern aka "its sigma channels" that matters, and not the level of VIX itself (this is per Dr. Robert Whaley, a great mentor and inventor of original VIX, now called VXO). VIX usually peaks around a test of its +4 sigma).
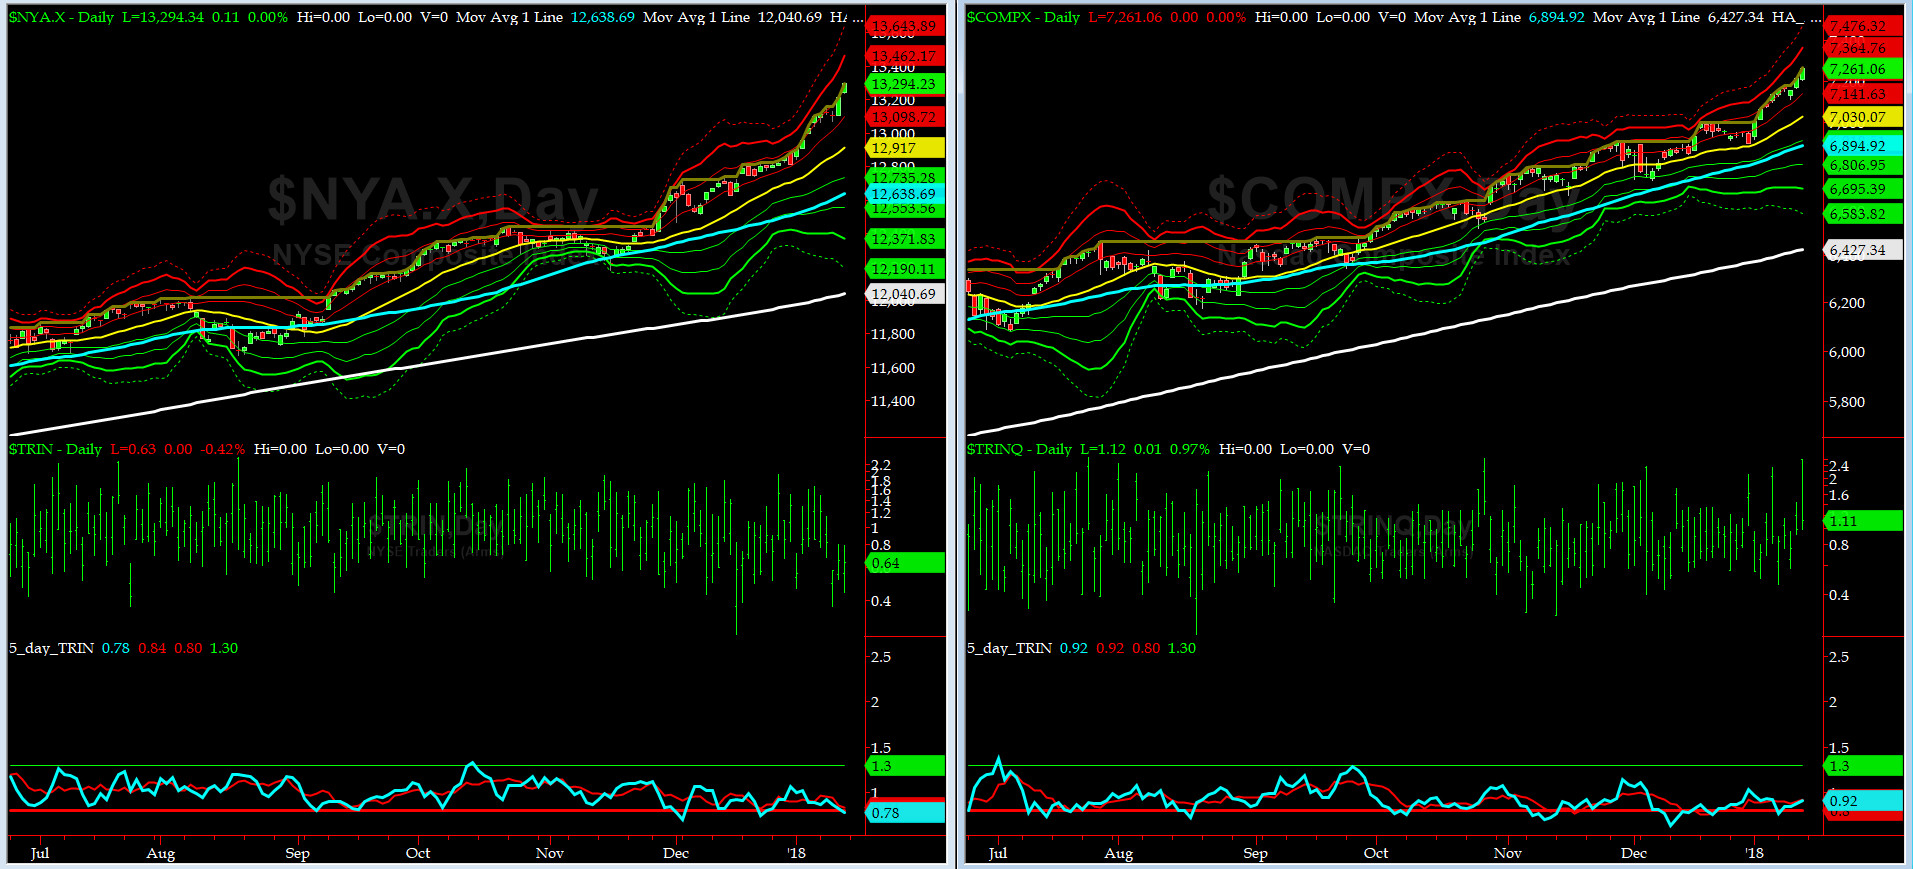
5-day TRIN & TRINQ Charts
NYSE 5-day TRIN is giving a SELL Signal while TRINQ gave one on Jan 8th.
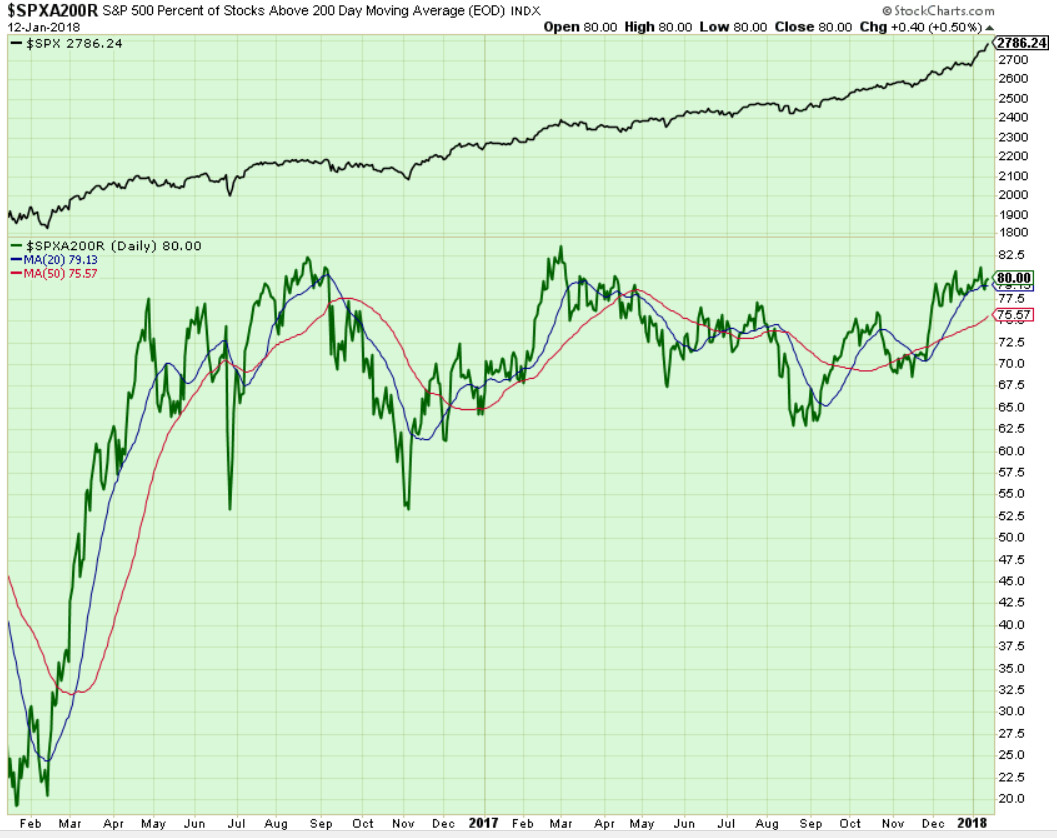
Components of SPX above their respective 200day MA Chart
This scoring indicator is hovering at 80.0 and continue to form early divergences with price (SPX).
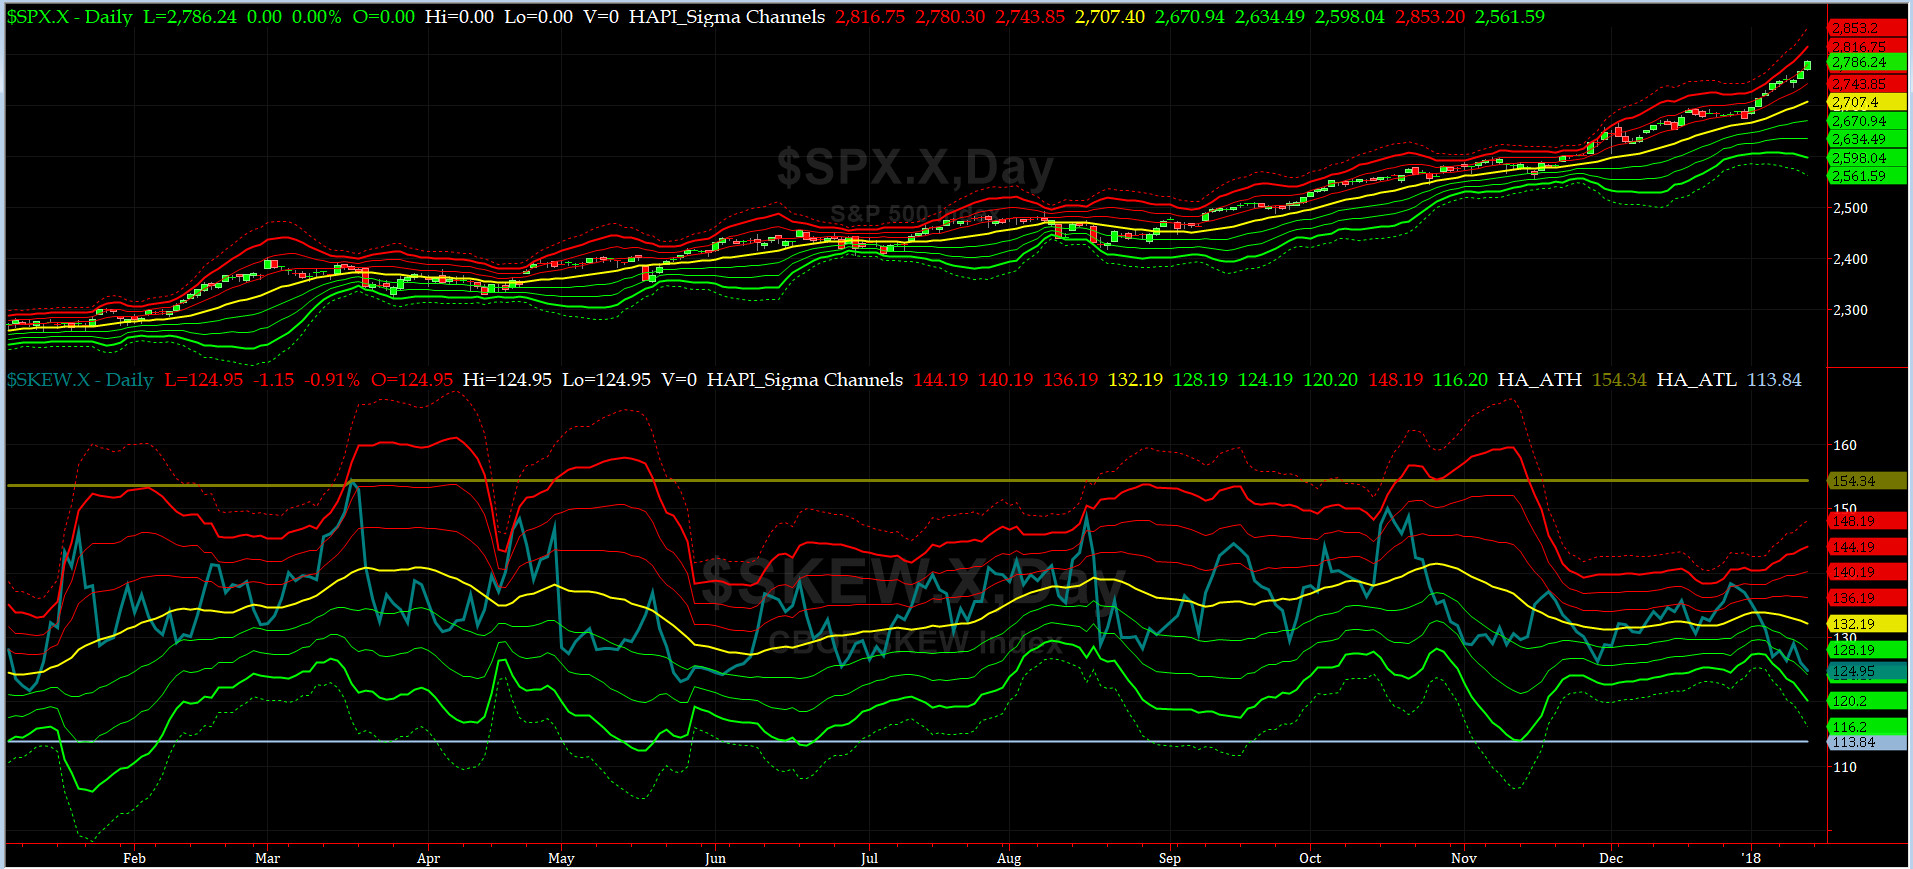
SPX SKEW (Tail Risk) Chart
Last week SPX SKEW (Tail Risk) closed at ~125, or about its -2 sigma (normal = 120-125, range 100-150).
Is all quiet on the Eastern & Mid-Western Fronts? Smart Money still says 'YES.'
How to interpret the value of SPX SKEW? (from CBOE white paper on SKEW)

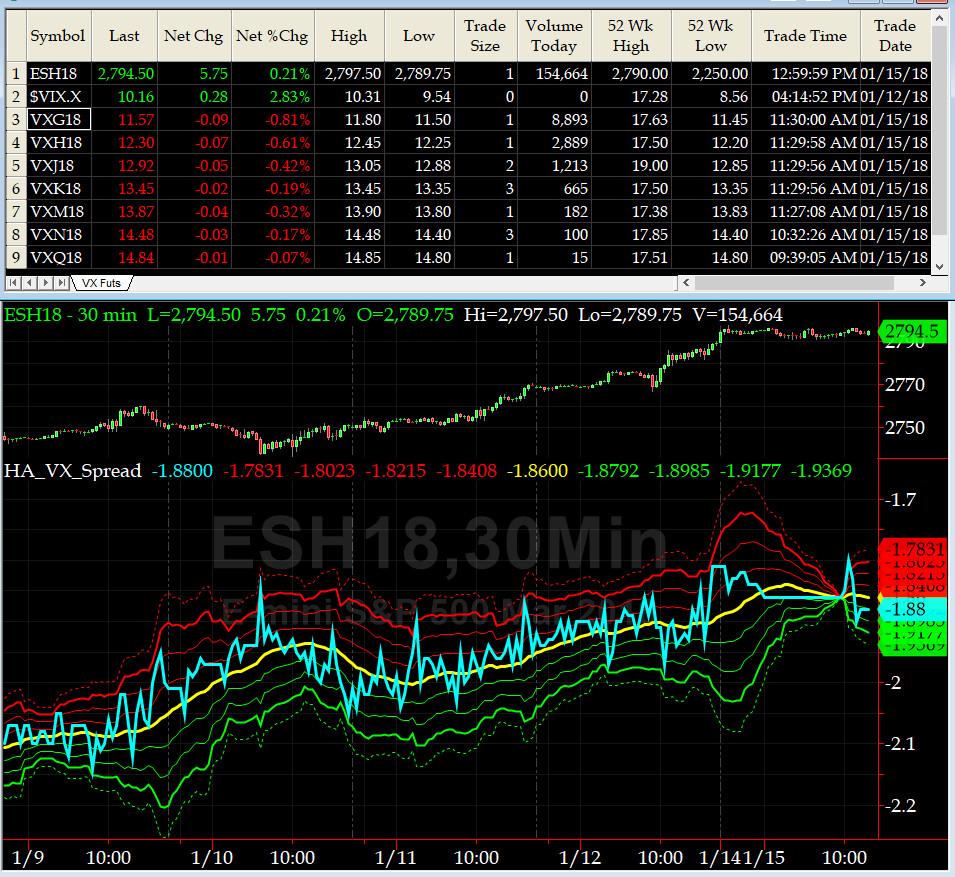
3-month VIX Futures Spread(VX) Chart
This popular timing indicator, now long Feb, short May VIX Futures closed at -1.8. Equity markets, as far as this indicator is concerned, continue to be slightly overbought.
HA_SP2 Chart
HA_SP2 = 92.4 (Buy signal <= 25, Sell Signal >= 75)
This coveted timing indicator says we are in very overbought zone now (but we know from recent history that we can stay in OB until we don't).
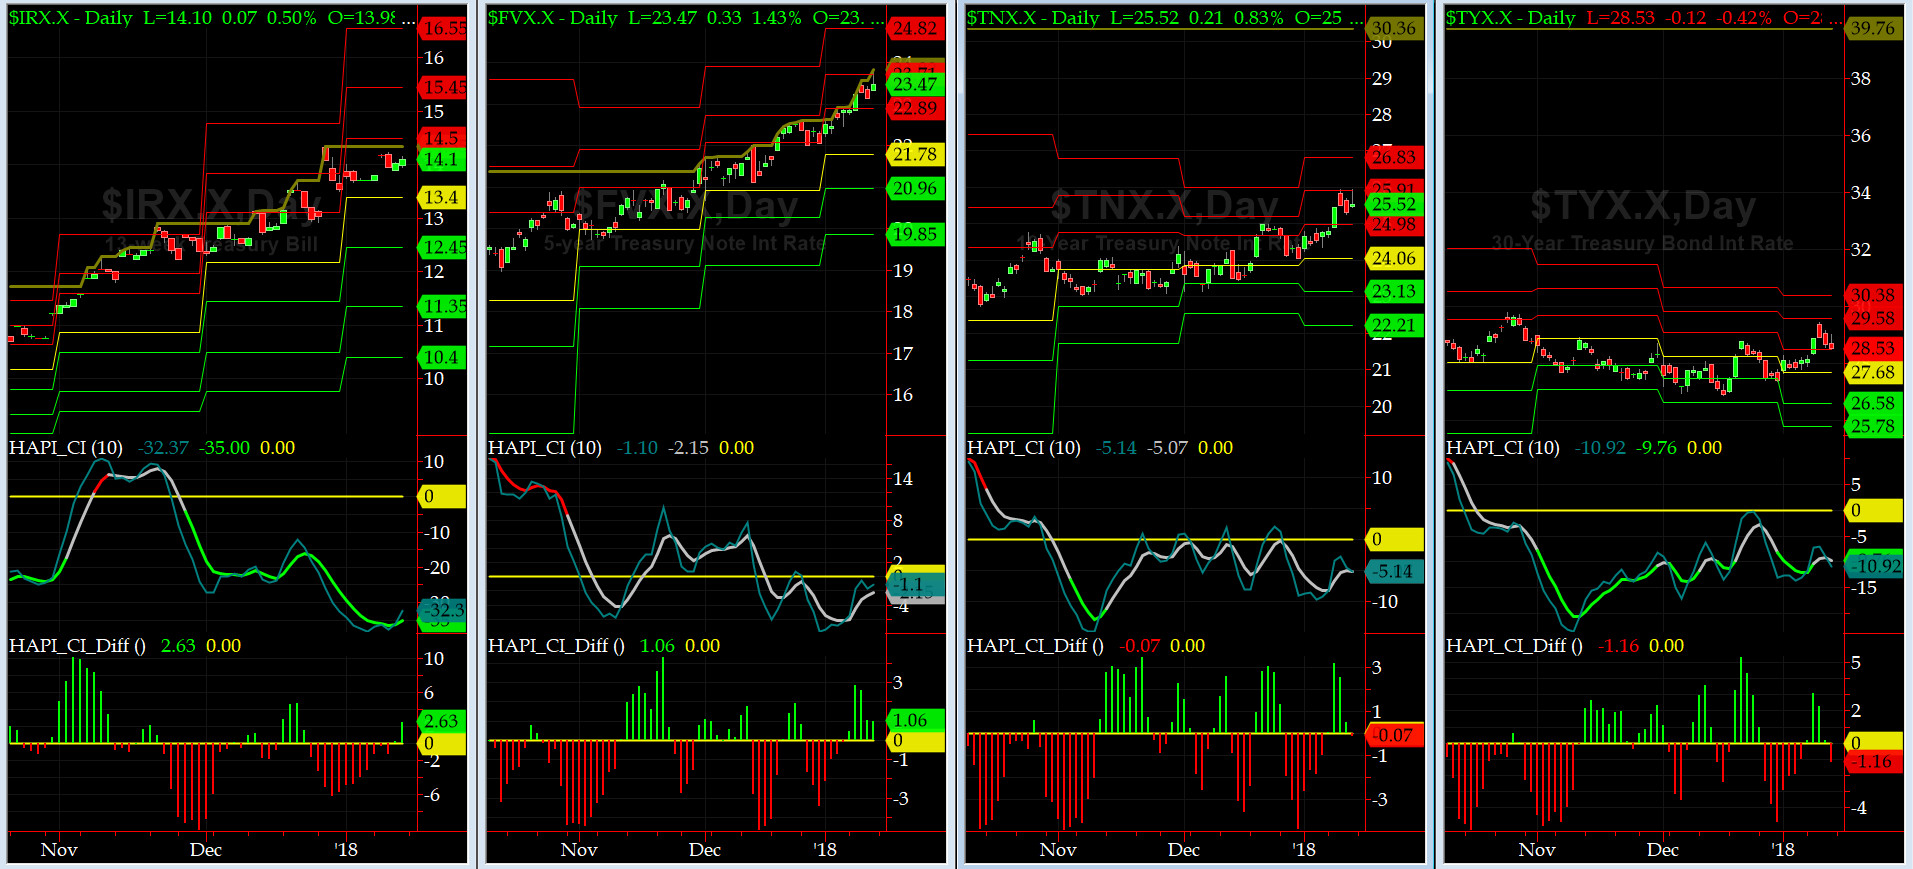
US Treasury T-Notes & T-Bonds Yields Chart
During this past week, the Treasury Curve sold off as the YTMs rose while Dollar Index sold off to a 3-yr low.
Fari Hamzei
|


 Proactive Market Timing