
|
 |
 |
 |
 |
 |
 |
 |
 |
 Proactive Market Timing Proactive Market Timing
|
|
|
Most Recent PMT vs SPX Performance Chart

|
|
|
|
Friday, March 2, 2018, 1140ET
Updates to Select PMT Charts, Issue #230
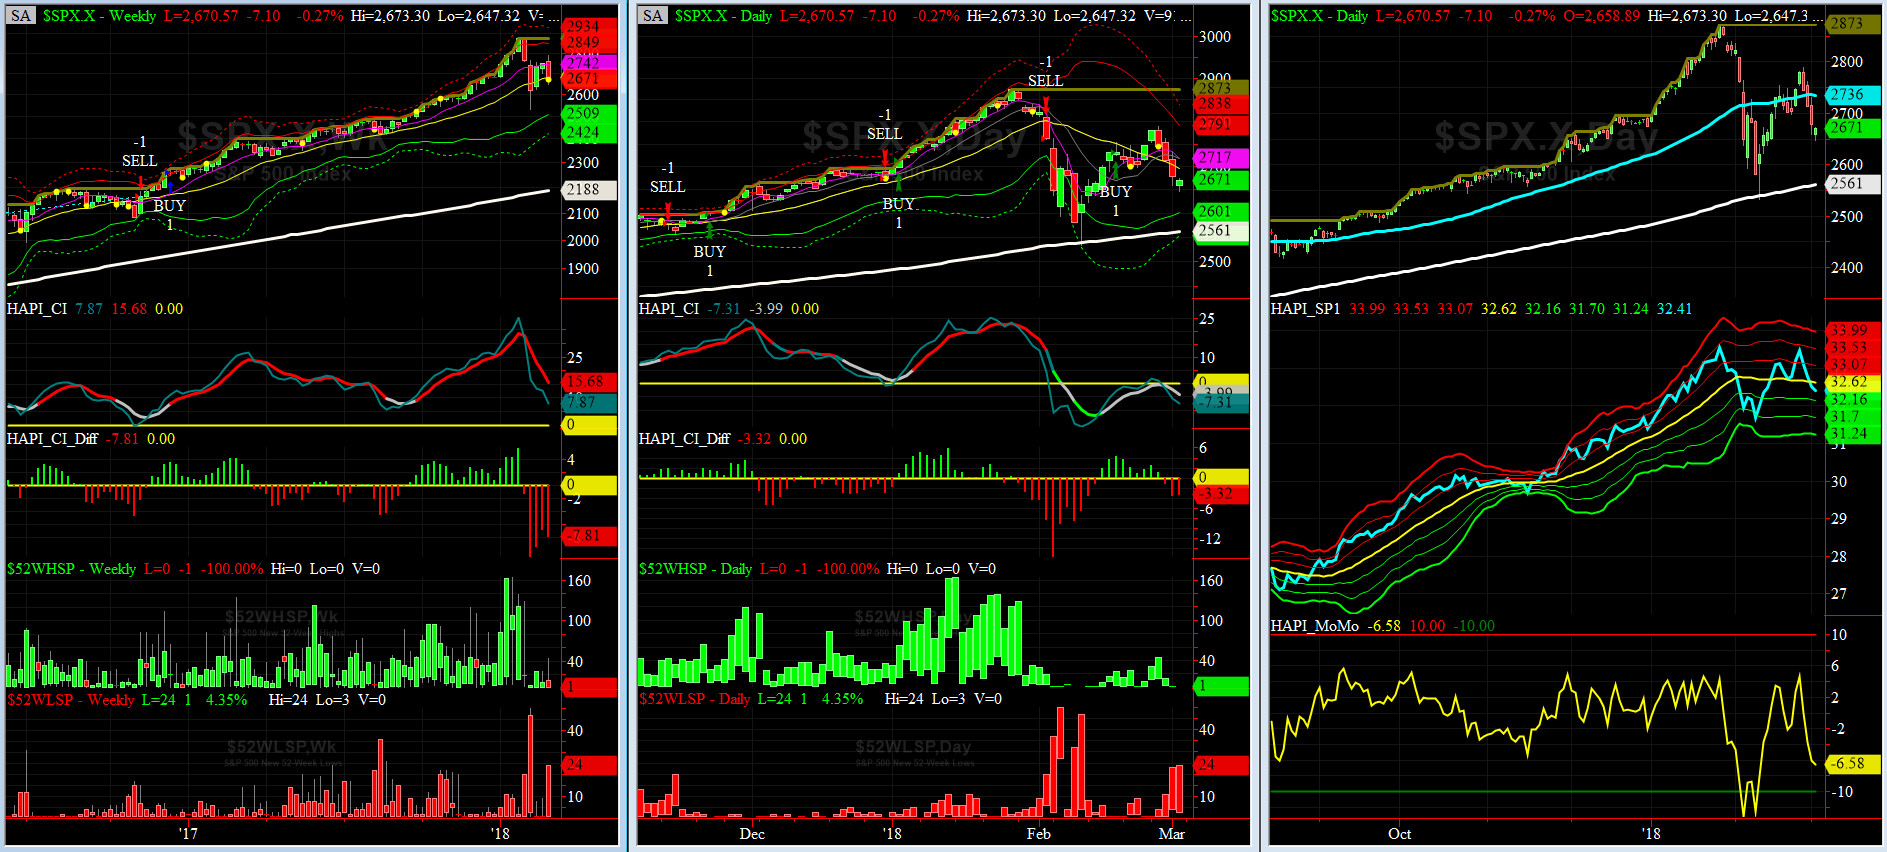
HA_SP1_Momo Chart
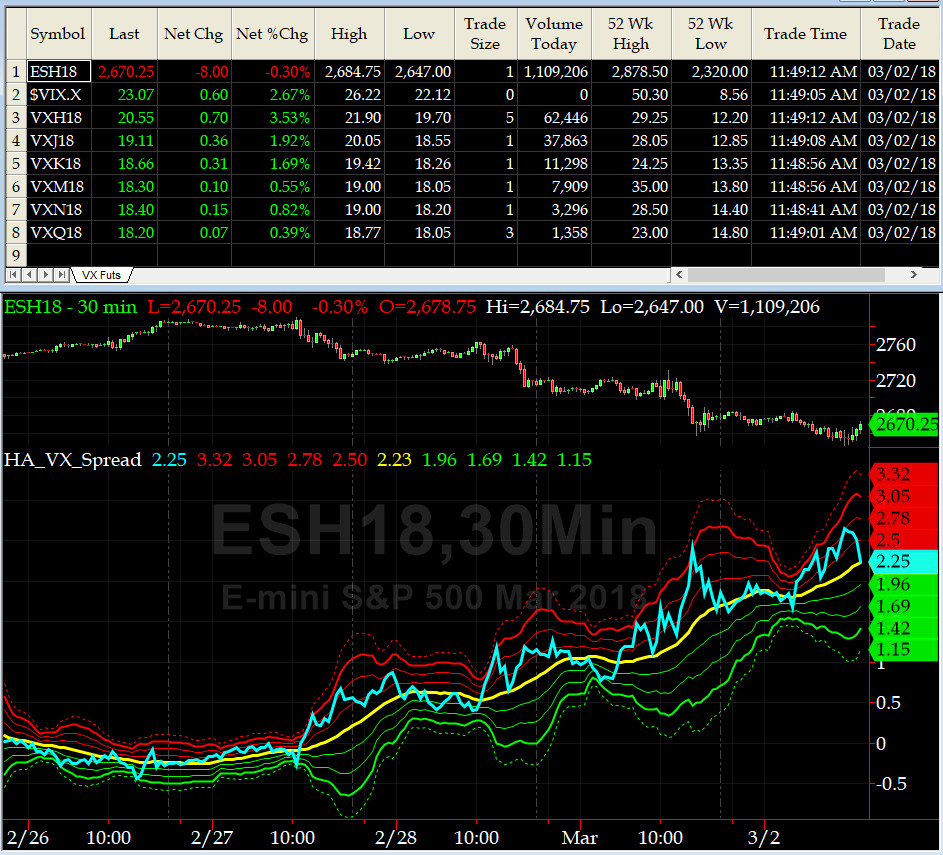
3-month VIX Futures Spread(VX) Chart
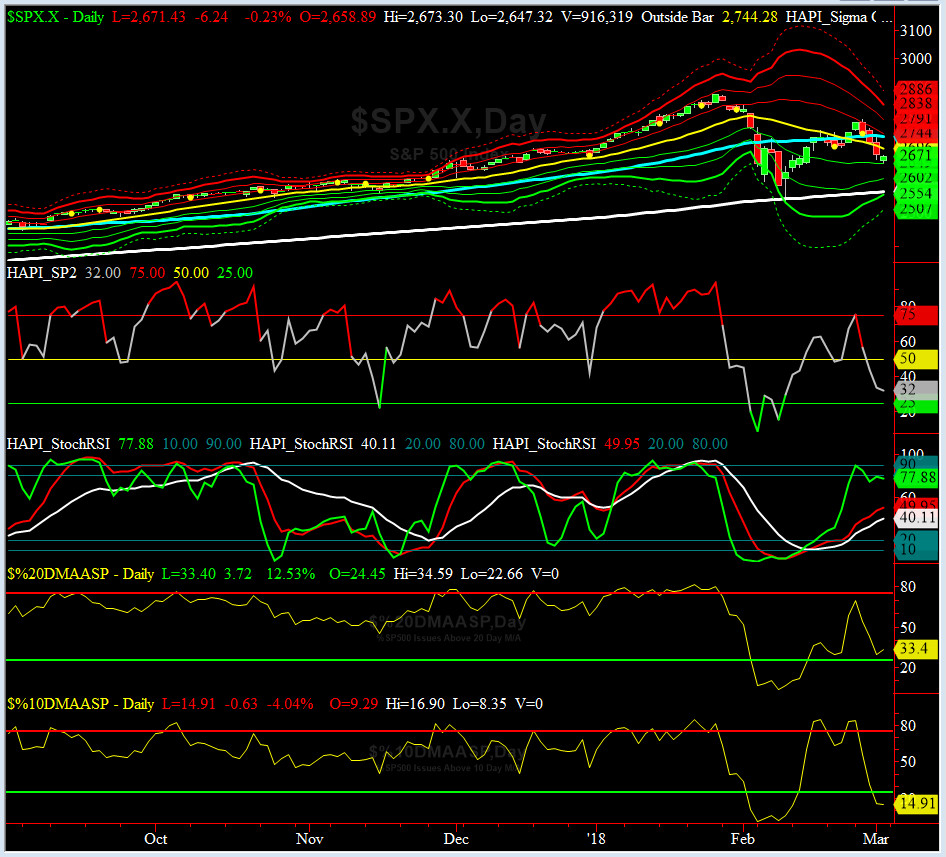
HA_SP2 Chart
|
|
|
|
|
|
Thursday, March 1, 2018, 0945ET
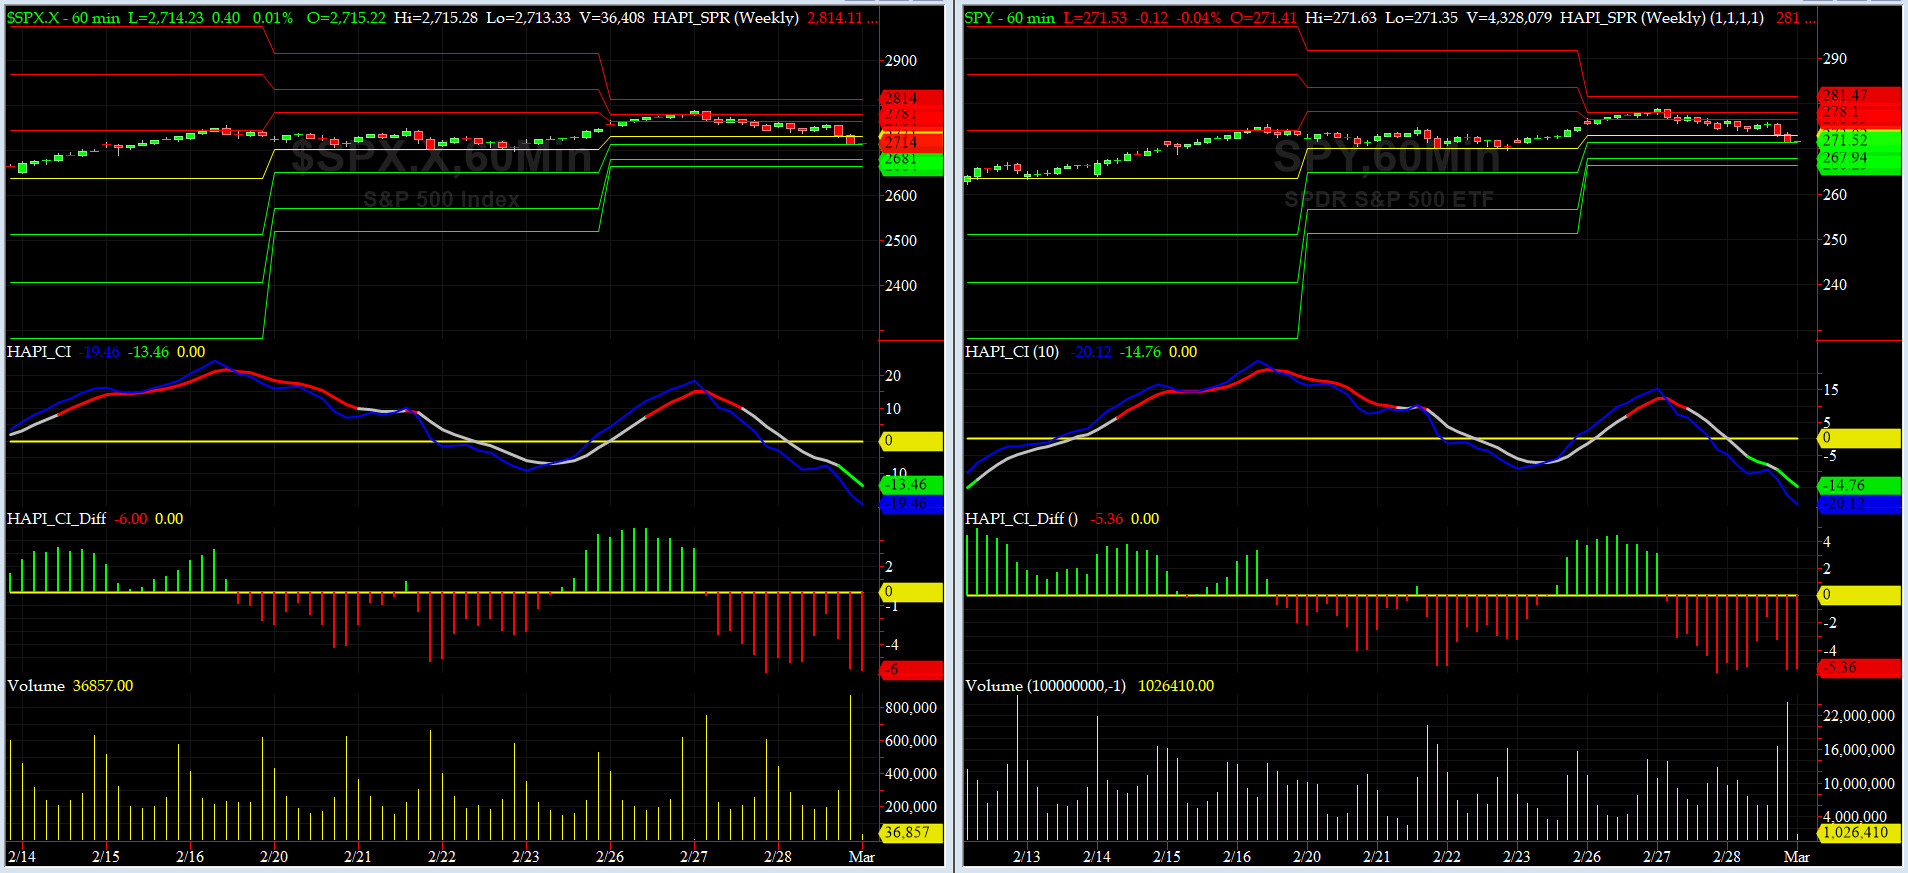
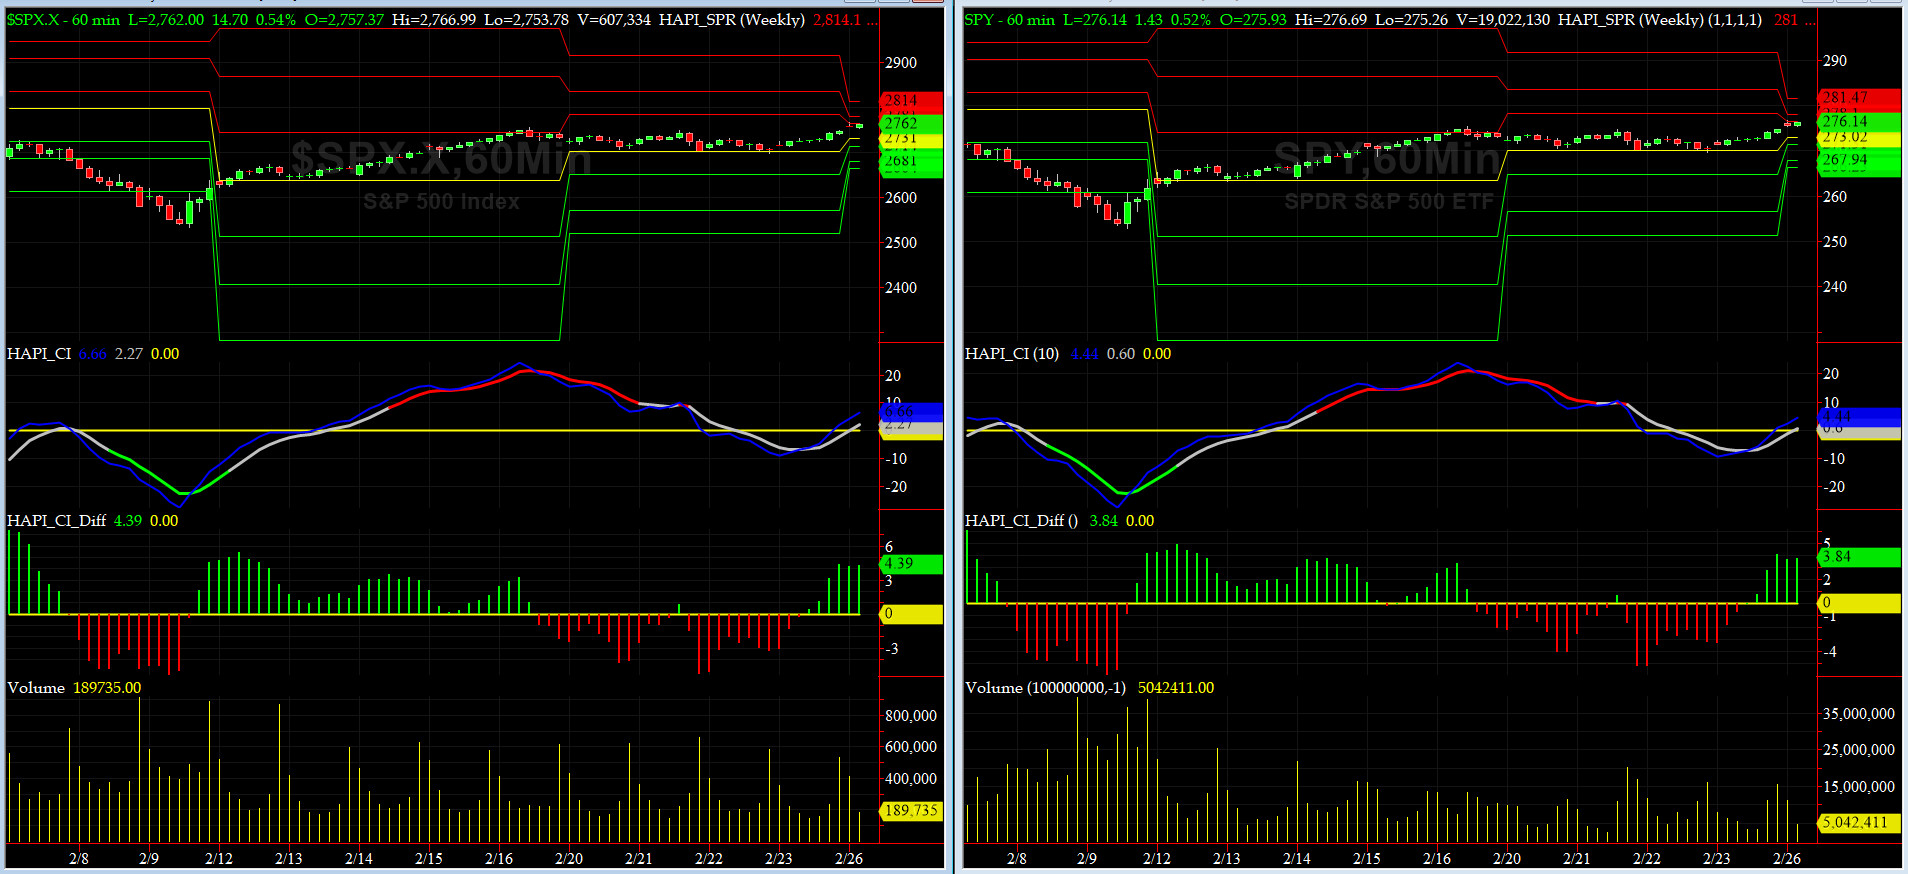
UPDATED Companion Chart for Market Bias Review, Issue #230
|
|
|
|
|
|
Thursday, March 1, 2018, 0945ET
UPDATED Market Bias for Issue #230
Our current Market Bias with Timer Digest is SHORT SPX as of Wednesday FEB 28 at 2713.83
Our previous Market Bias was LONG SPX as of Friday FEB 23 at 2747.30
Here are the trade parameters for this week:
SPX Money Management Stop for 100% of our position = 2740
SPX BreakEven Stop (Last Open) for last 20% of our position = 2715
SPX Primary Profit Target for first 80% of our position = 2650
SPX Secondary Profit Target for last 20% of our position = 2600
|
| Action |
Asset |
Expiration |
Strike |
Option |
| BUY |
SPY |
Friday MAR 16 |
270 |
Puts |
| SELL SHORT |
SPY |
Friday MAR 16 |
263 |
Puts |
| You need to execute both legs and hold it as a Put-Spread.
|
Note A:
Once the Primary Profit Target has been reached, traders are advised to close 80% of their position in order to lock in profits. The remaining balance can be carried over with a BreakEven STOP, based on the SPX level at the time of entry, in order to make the trade a zero-risk trade with the final position running to reach the Secondary Profit Target.
Once either Secondary Profit or Money Management (BreakEven STOP after the 80% peel-off) is hit, our Option/ETF trade for that week is over. Go to Cash and wait for the next PMT Issue.
Note B:
When we change our Market Bias with Timer Digest, You need to go FLAT asap. With PMT Pro, that is before the Close that day and with the basic PMT, at the open of the next day.
Fari Hamzei
|
|
|
|
|
|
Wednesday, February 28, 2018, 1556ET
Notice of Change of Bias with Timer Digest
Dear Jim,
Looks like when Jerome Powell speaks, everyone listens��
Getting back to be on the SHORT side of SPX as of the close of tonight.
Fari Hamzei
|
|
|
|
|
|
Monday, February 26, 2018, 1120ET
Companion Chart for Market Bias Review, Issue #230
|
|
|
|
|
|
Monday, February 26, 2018, 1115ET
Market Bias for Issue #230
Our current Market Bias with Timer Digest is LONG SPX as of Friday FEB 23 at 2747.30
Our previous Market Bias was SHORT SPX as of Tuesday FEB 20 at 2716.26
Here are the trade parameters for this week:
SPX Secondary Profit Target for last 20% of our position = 2850
SPX Primary Profit Target for first 80% of our position = 2800
SPX BreakEven Stop (Last Open) for last 20% of our position = 2757
SPX Money Management Stop for 100% of our position = 2735
|
| Action |
Asset |
Expiration |
Strike |
Option |
| BUY |
SPY |
Friday MAR 16 |
276 |
Calls |
| SELL SHORT |
SPY |
Friday MAR 16 |
282 |
Calls |
| You need to execute both legs and hold it as a Call-Spread.
|
Note A:
Once the Primary Profit Target has been reached, traders are advised to close 80% of their position in order to lock in profits. The remaining balance can be carried over with a BreakEven STOP, based on the SPX level at the time of entry, in order to make the trade a zero-risk trade with the final position running to reach the Secondary Profit Target.
Once either Secondary Profit or Money Management (BreakEven STOP after the 80% peel-off) is hit, our Option/ETF trade for that week is over. Go to Cash and wait for the next PMT Issue.
Note B:
When we change our Market Bias with Timer Digest, You need to go FLAT asap. With PMT Pro, that is before the Close that day and with the basic PMT, at the open of the next day.
Fari Hamzei
|
|
|
|
|
|
Sunday, February 25, 2018, 1100ET
Market Timing Charts, Analysis & Commentary for Issue #230
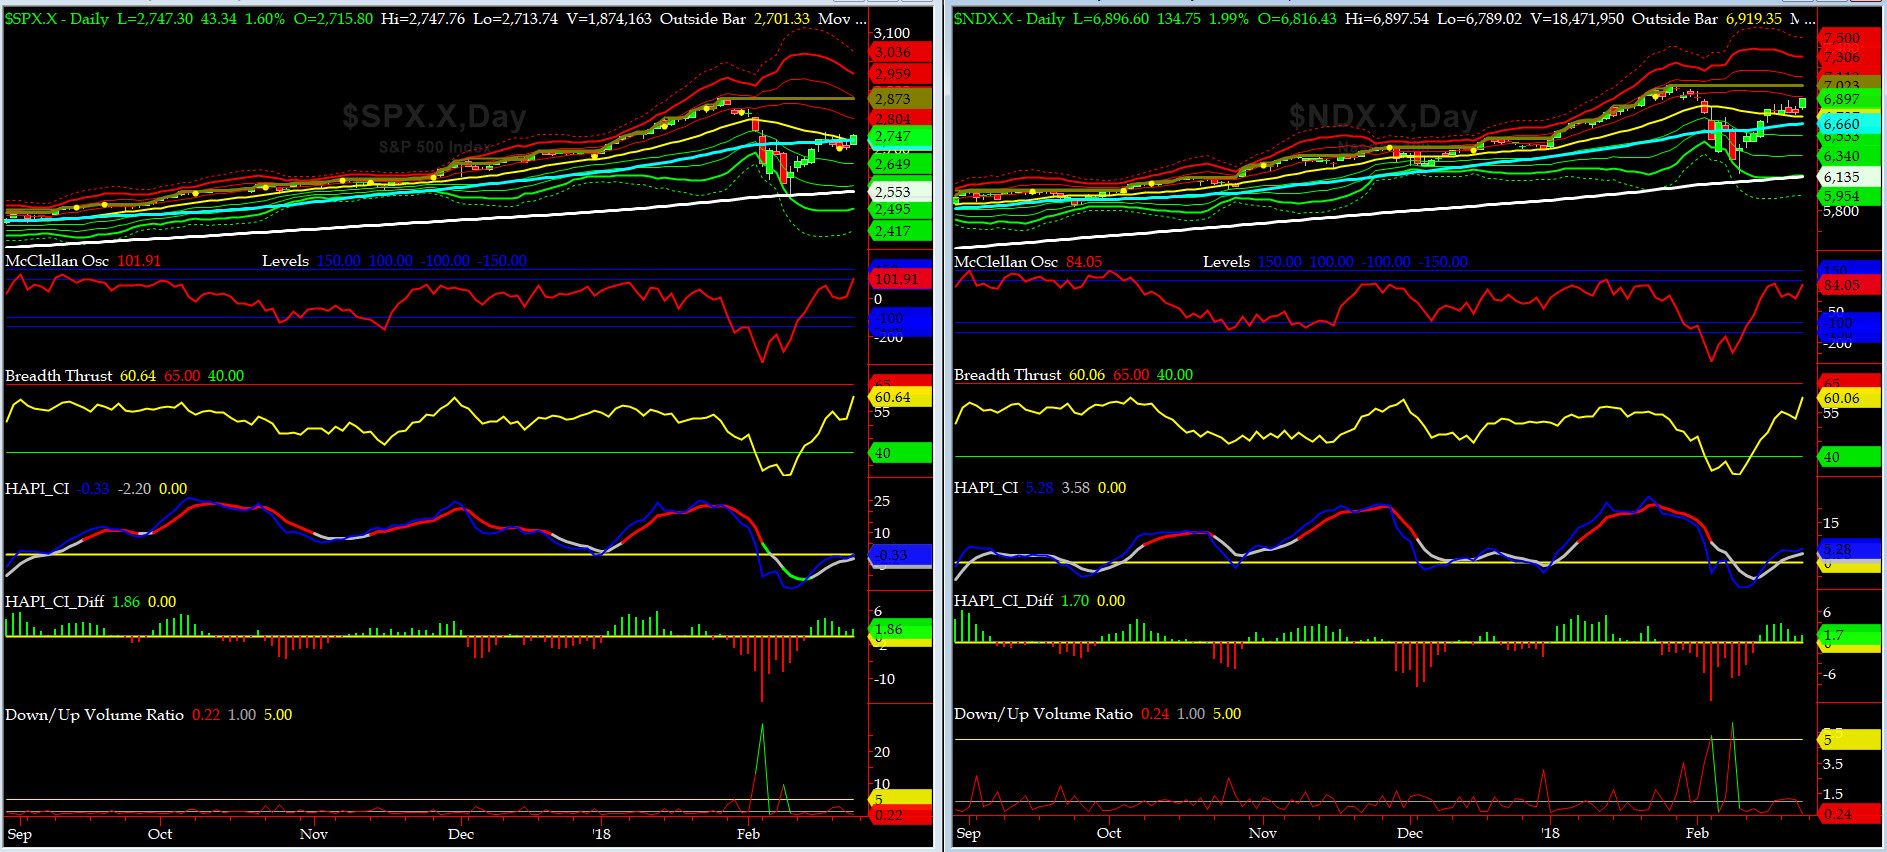
Timer Charts of S&P-500 Cash Index (SPX) + NASDAQ-100 Cash Index (NDX)
Most recent S&P-500 Cash Index (SPX): 2747.30 up +15.08 (up +0.55%) for the week ending on Friday, February 23, 2018, which closed just above its zero sigma.
SPX ALL TIME INTRADAY HIGH = 2872.87 (reached on Friday, Jan 26, 2018)
SPX ALL TIME CLOSING HIGH = 2872.87 (reached on Friday, Jan 26, 2018)
Current DAILY +2 Sigma SPX = 2881 with WEEKLY +2 Sigma = 2852
Current DAILY 0 Sigma (20 day MA) SPX = 2727 with WEEKLY 0 Sigma = 2673
Current DAILY -2 Sigma SPX = 2572 with WEEKLY -2 Sigma = 2494
NYSE McClellan Oscillator = +102 (-150 is start of the O/S area; around -275 to -300 area or lower, we go into the �launch-pad� mode, over +150, we are in O/B area)
NYSE Breadth Thrust = 60.6 (40 is considered as oversold and 65 as overbought)
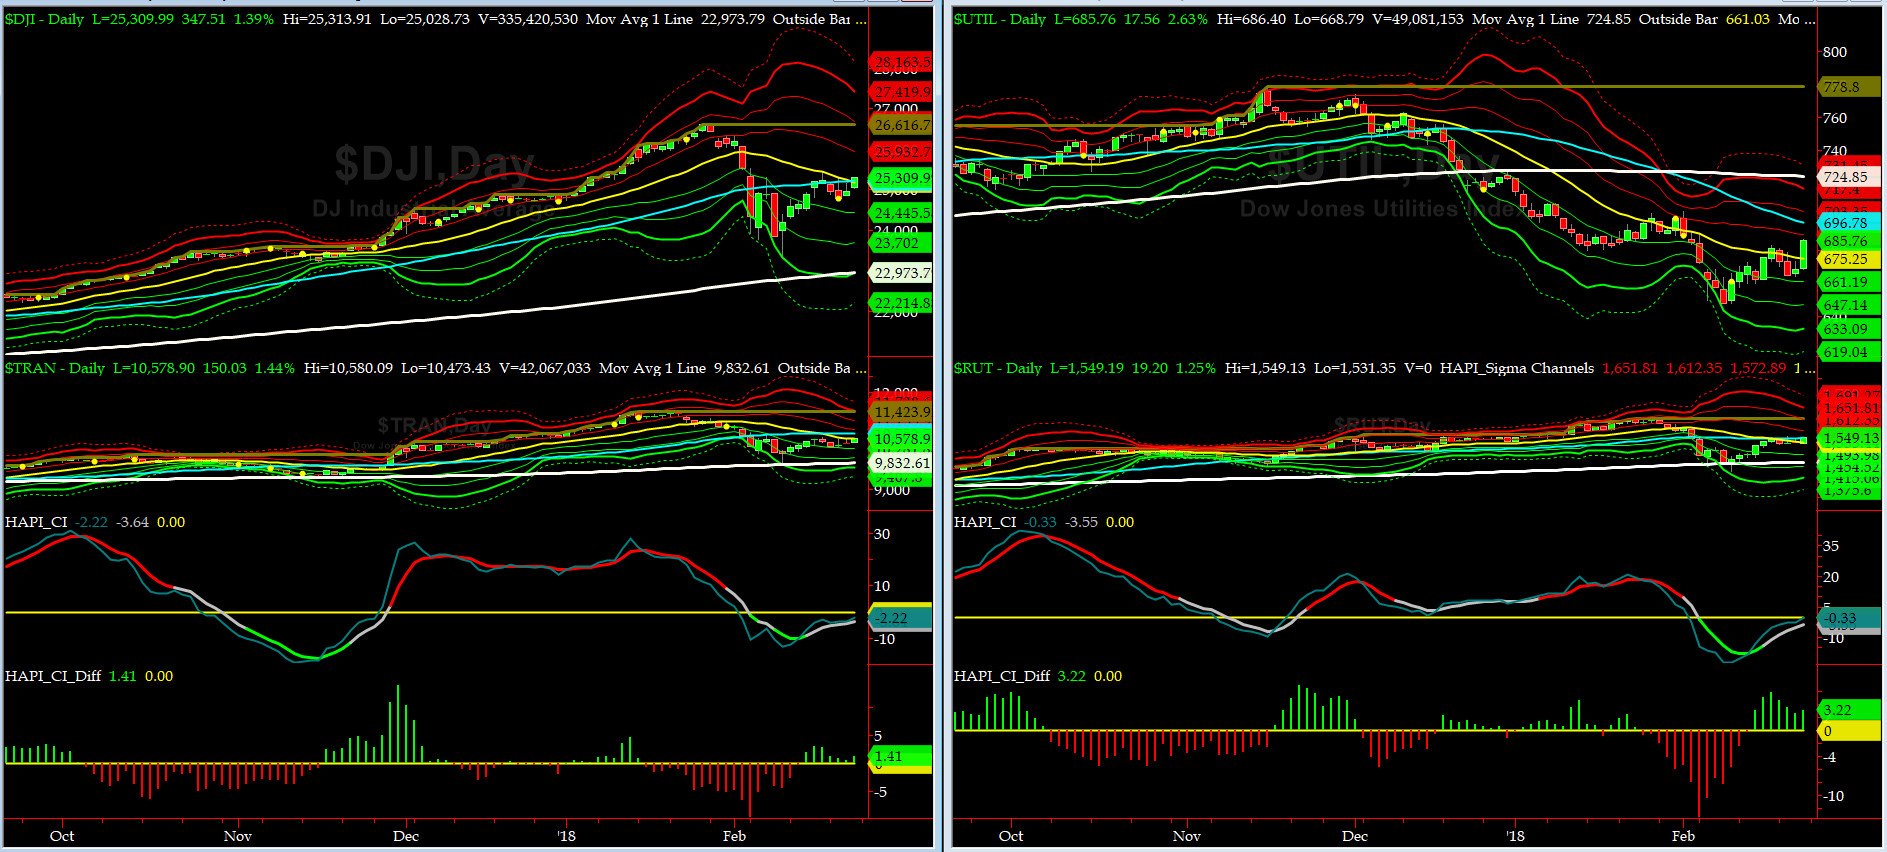
Canaries [in the Coal Mine] Chart for DJ TRAN & RUT Indices
200-Day MA DJ TRAN = 9832 or 7.6% above DJ TRAN (max observed in last 7 yrs = 20.2%, min = -20.3%)
200-Day MA RUT = 1468 or 5.5% above RUT (max observed in last 7 yrs = 21.3%, min = -22.6%)
DJ Transportation Index (proxy for economic conditions 6 to 9 months hence) had a tough week and could not rally up to its 50Day MA.
Russell 2000 Small Caps Index (proxy for Risk ON/OFF), on the other hand rallied and closed at its 50Day MA. RISKY assets are coming back in vogue, albeit very slowly.
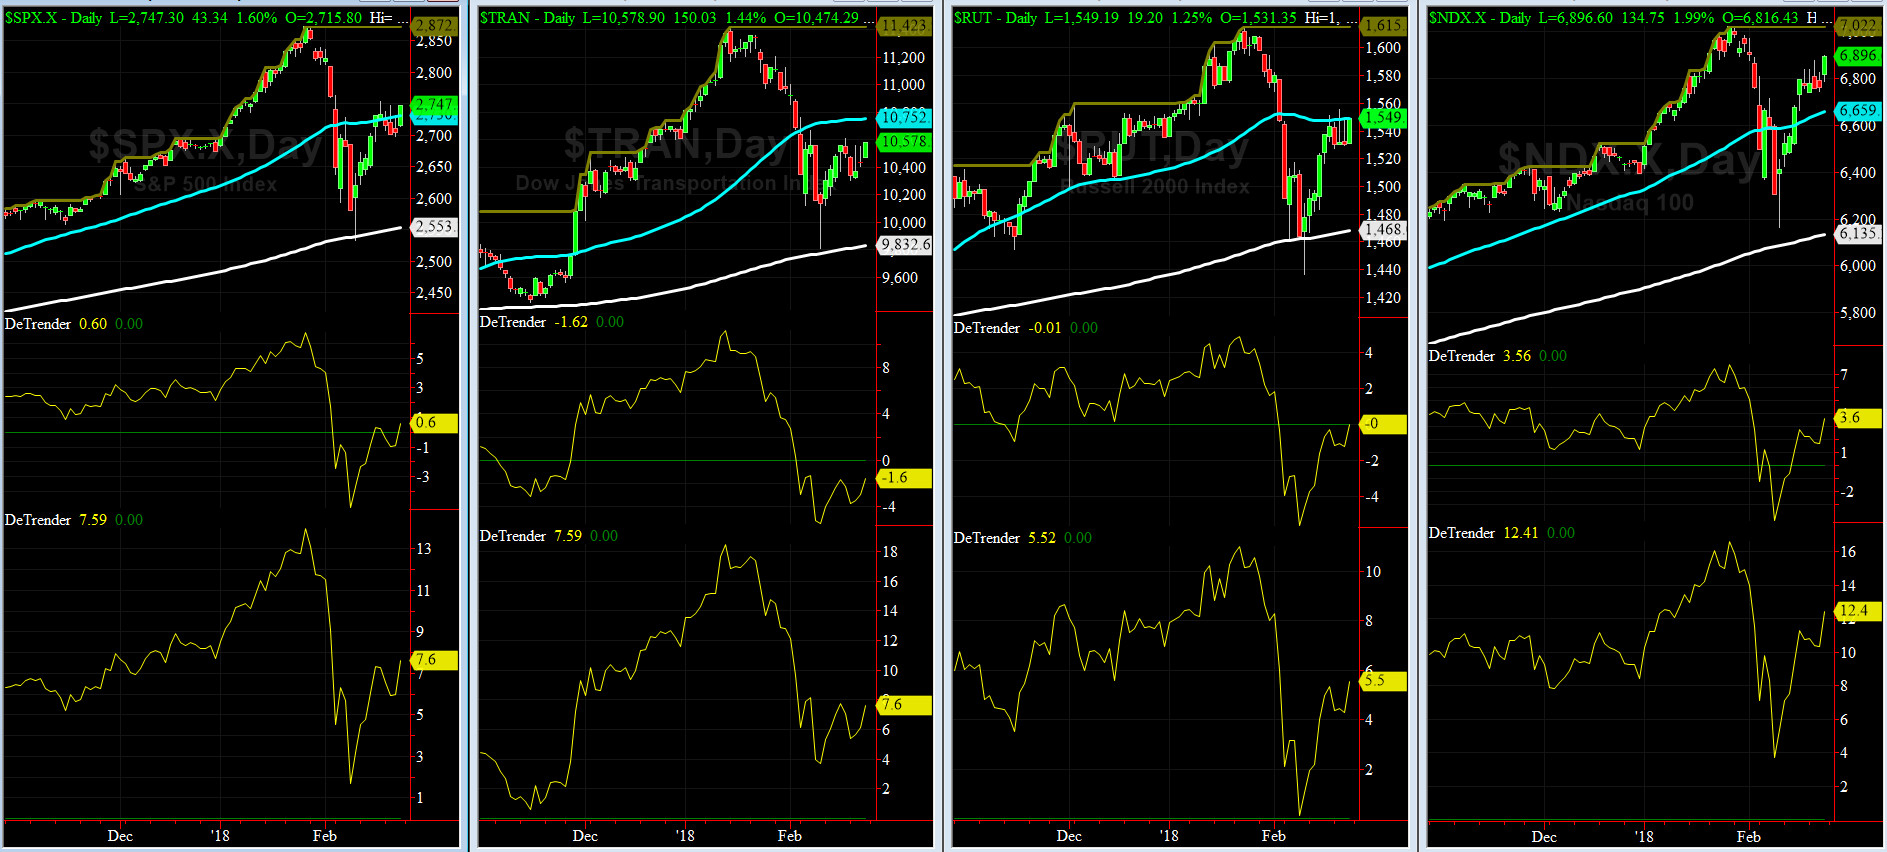
DeTrenders Charts for SPX, NDX, TRAN & RUT Indices
50-Day MA SPX = 2730 or 0.6% below SPX (max observed in last 7 yrs = +8.6%, min = -9.3%)
200-Day MA SPX = 2553 or 7.6% below SPX (max observed in last 7 yrs = 15.2%, min = -14%)
Again, SIX of our EIGHT DeTrenders ended up in POSITIVE territory. The DeTrenders for DJ Tran & RUT will continue to be harbingers of future price behavior in broad indices.
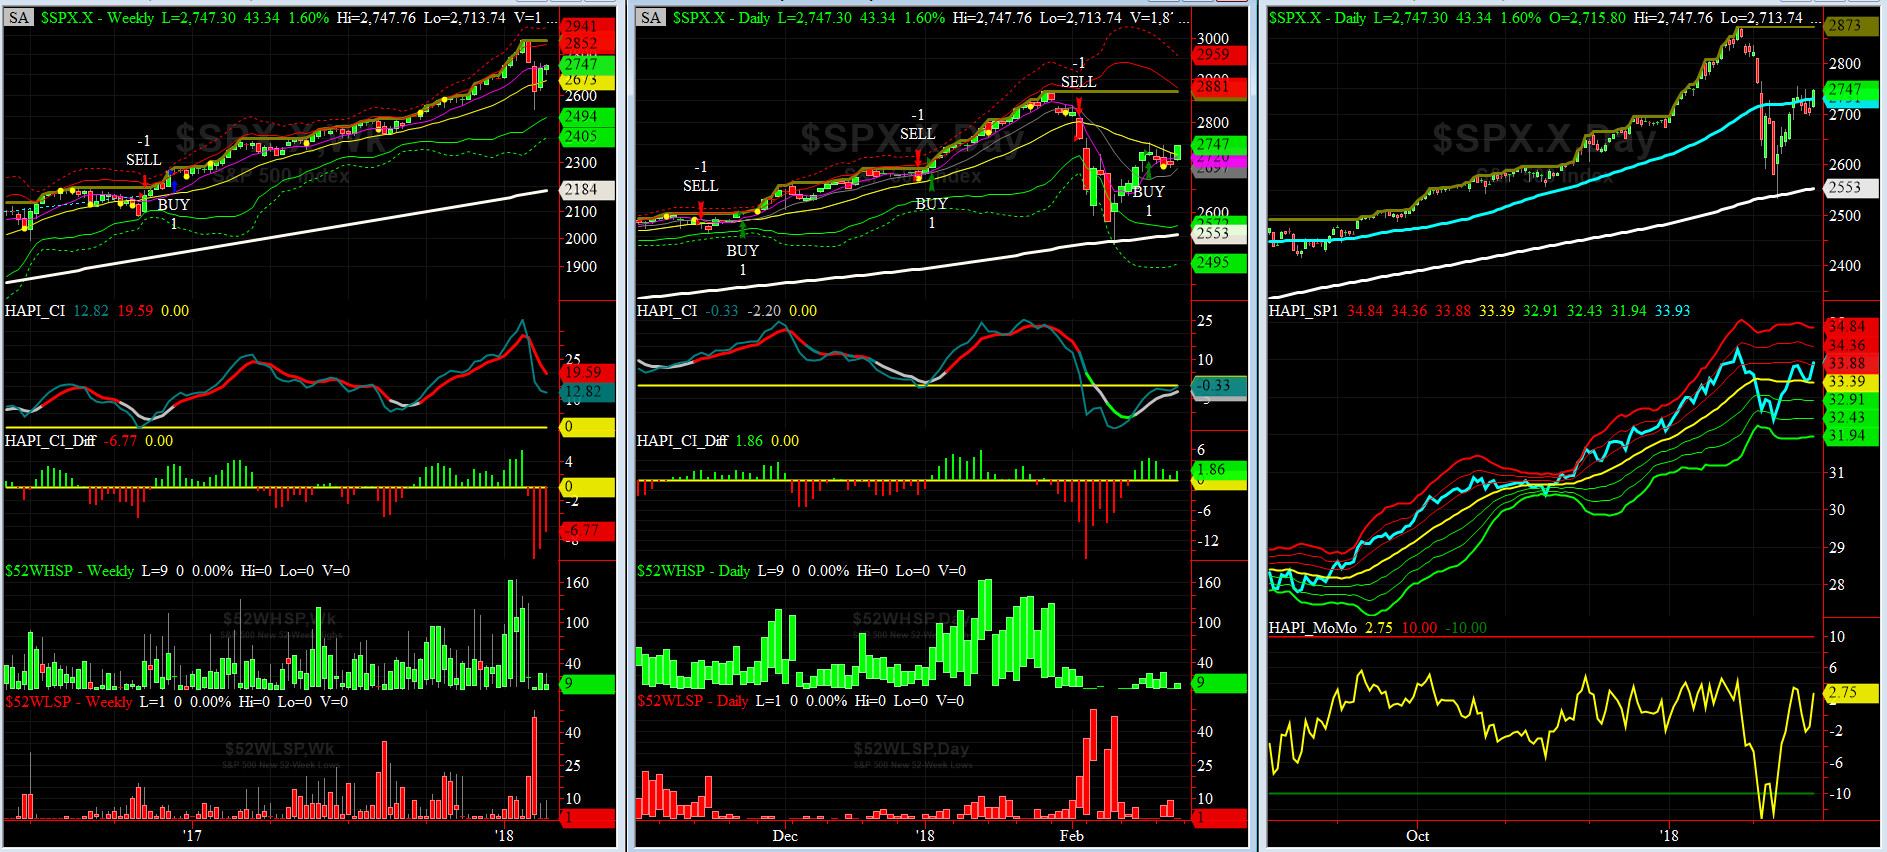
HA_SP1_Momo Chart
WEEKLY Timing Model = on a BUY Signal since Friday 12/16/16 CLOSE at 2258
DAILY Timing Model = on a BUY Signal since Friday 2/16/18 CLOSE at 2732
Max SPX 52wk-highs reading last week = 25 (over 120-140, the local maxima is in)
Max SPX 52wk-Lows reading last week = 9 (over 40-60, the local minima is in)
HA_SP1 closed near its +1 sigma channels
HA_Momo = +2.75 (reversals most likely occur above +10 or below -10)
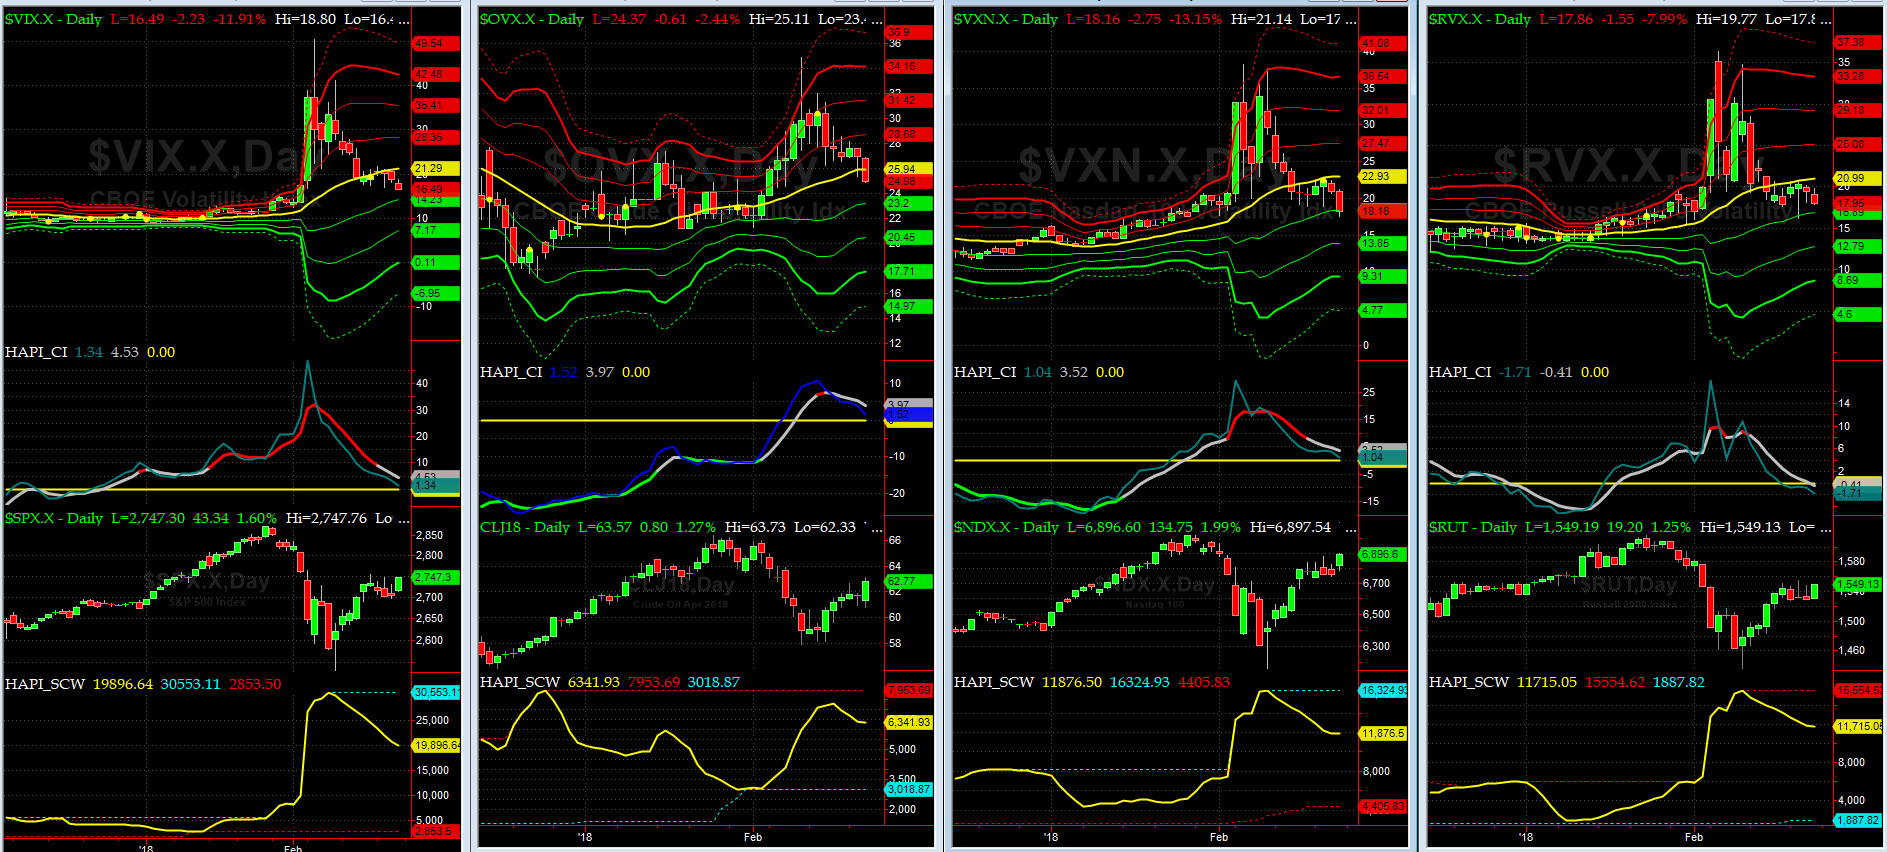
Vol of the Vols Chart
VIX currently stands at 16.5, at about its -0.5 sigma (remember it's the VIX volatility pattern aka "its sigma channels" that matters, and not the level of VIX itself (this is per Dr. Robert Whaley, a great mentor and inventor of original VIX, now called VXO). VIX usually peaks around a test of its +4 sigma).
we still believe the bottom was in Feb 9th while noting a softer contango in VX Futures.
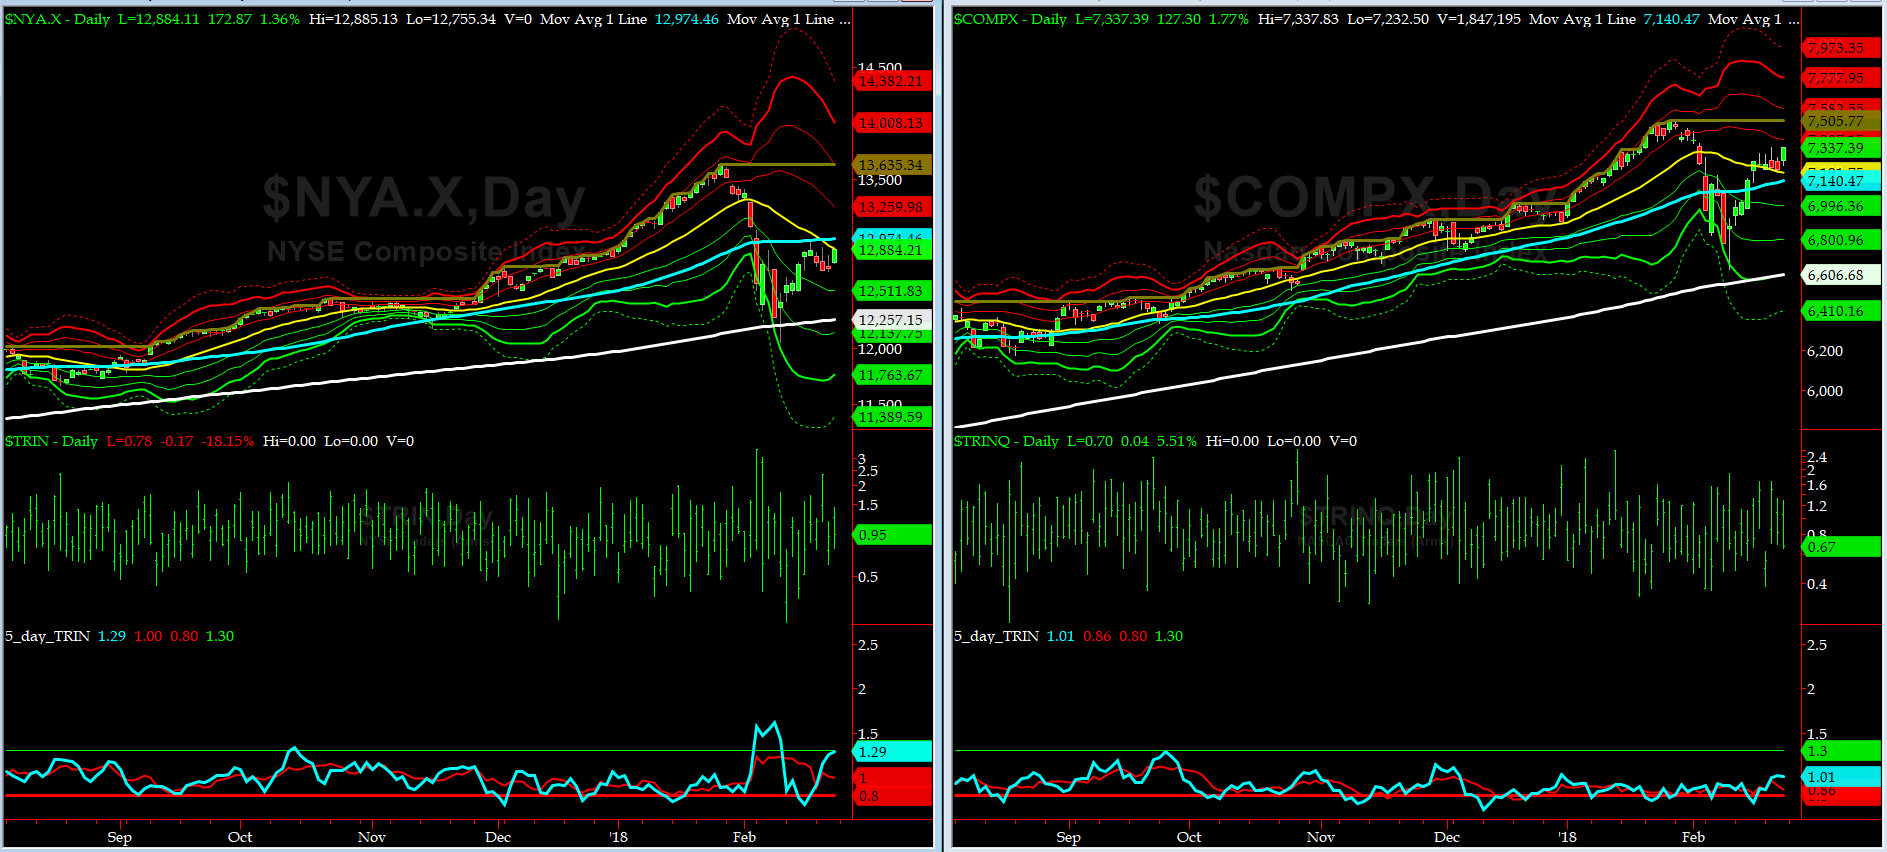
5-day TRIN & TRINQ Charts
NYSE 5-day TRIN is in the BUY zone now.
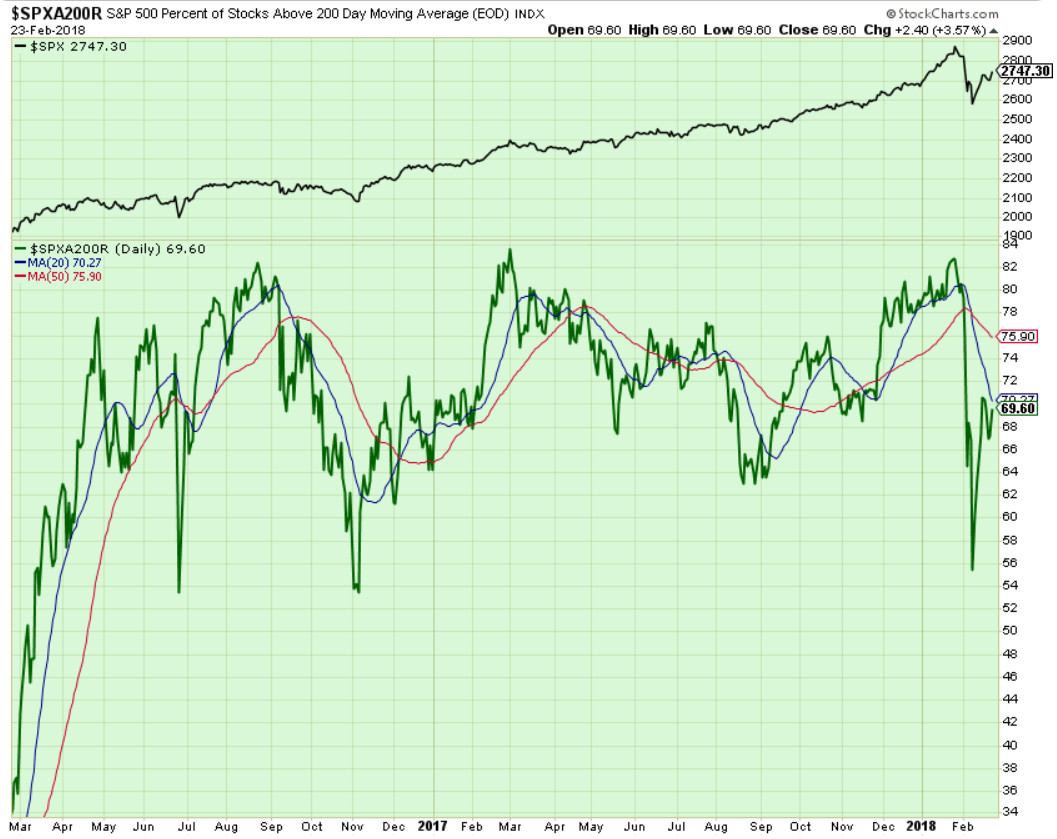
Components of SPX above their respective 200day MA Chart
This scoring indicator settled at near 70% just below its 20Day MA making 50day MA (~76%) as next target should bullish thesis continue.
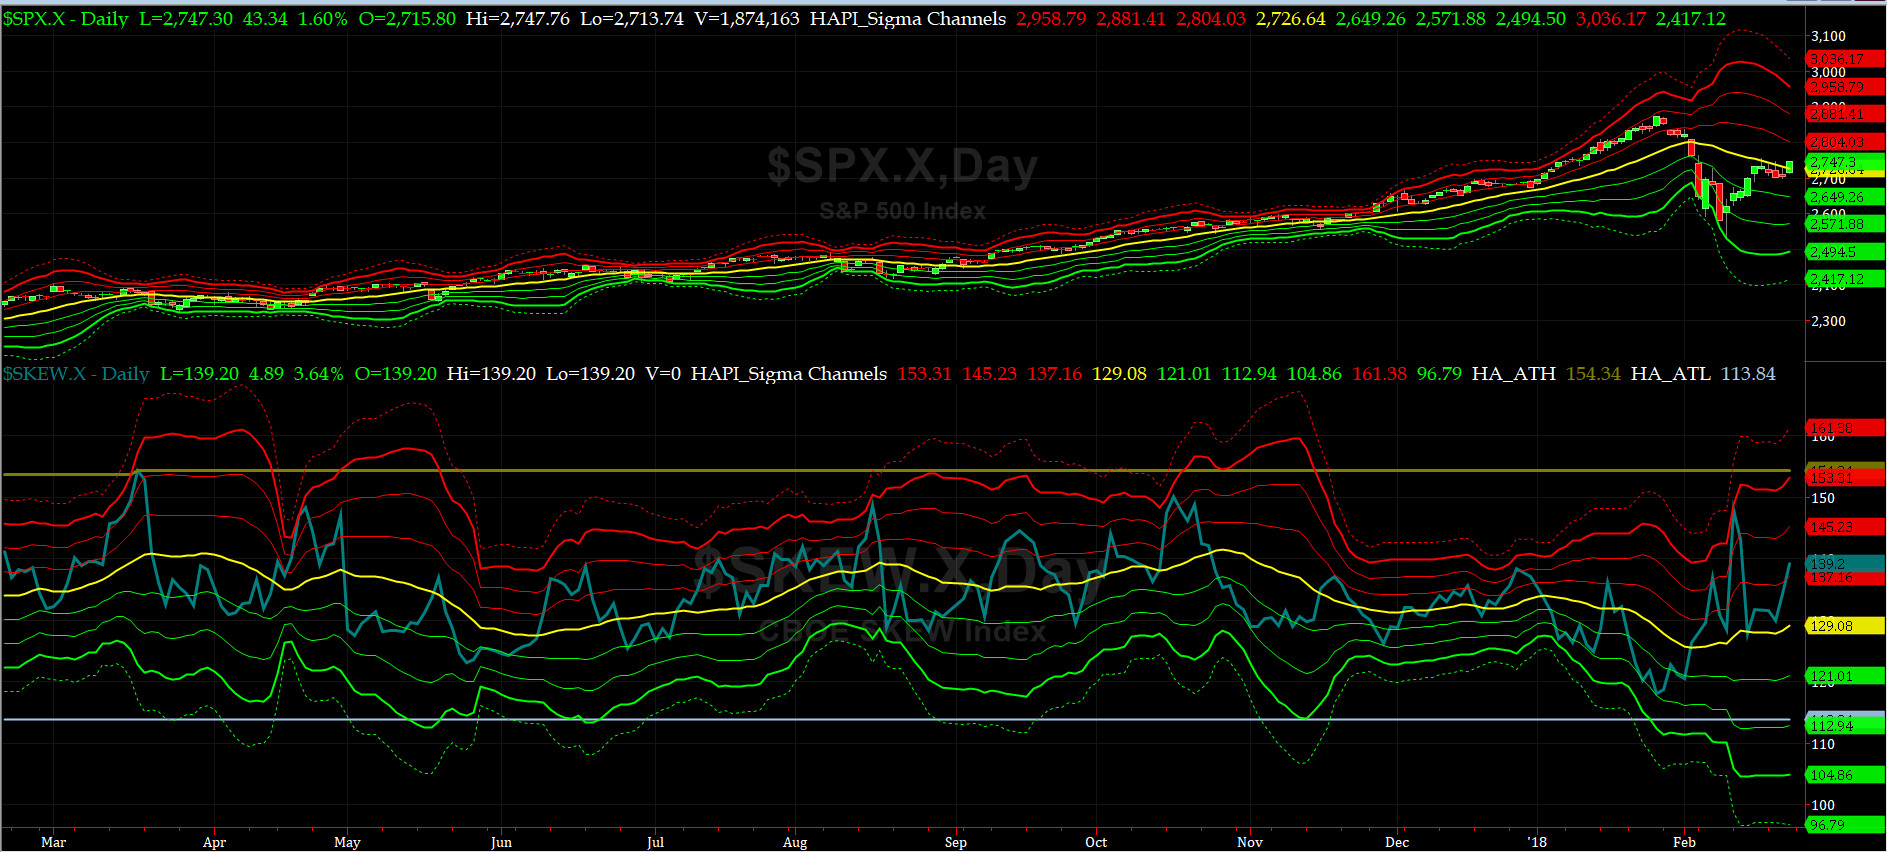
SPX SKEW (Tail Risk) Chart
Last week SPX SKEW (Tail Risk) closed at ~139, or about its +1.5 sigma (normal = 120-125, range 100-150).
Is all quiet on the Eastern & Mid-Western Fronts? Smart Money has ran out of tea & shelved Rumi readings for now. Do they know something that is not priced in yet?
How to interpret the value of SPX SKEW? (from CBOE white paper on SKEW)

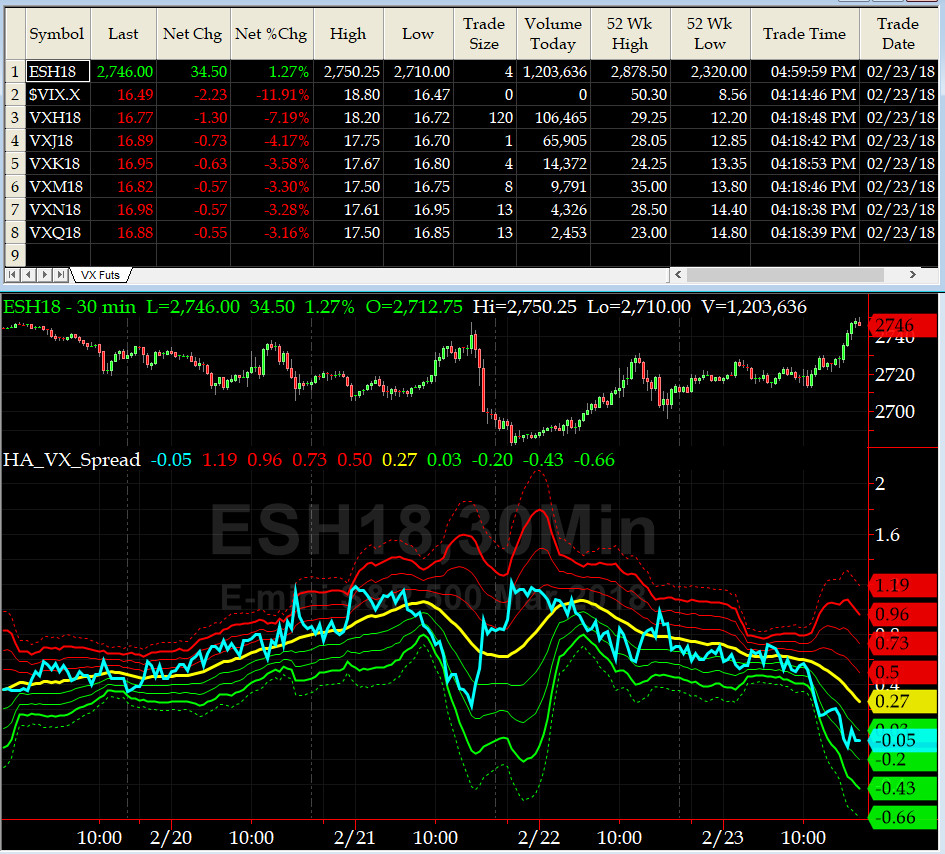
3-month VIX Futures Spread(VX) Chart
This popular timing indicator, now long March, short June VIX Futures again closed -0.05. Is the bottom in? we think so till other shoe drops.
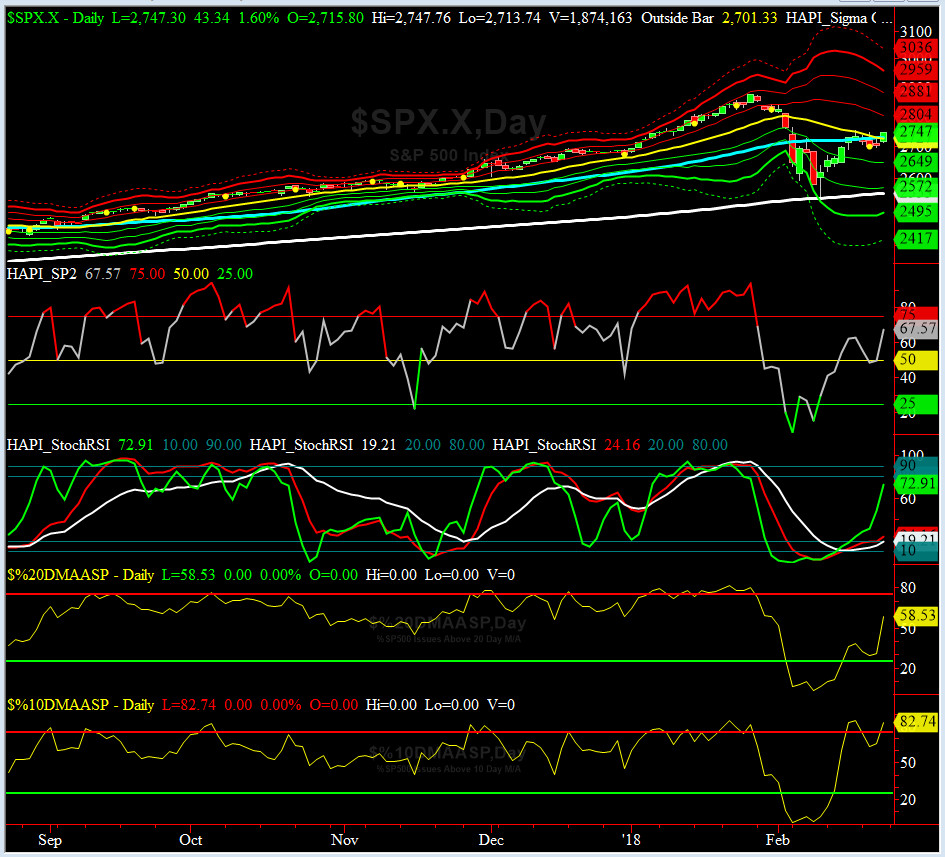
HA_SP2 Chart
HA_SP2 = 67.6 (Buy signal <= 25, Sell Signal >= 75)
This coveted timing indicator is shooting for the OVERBOUGHT zone again.
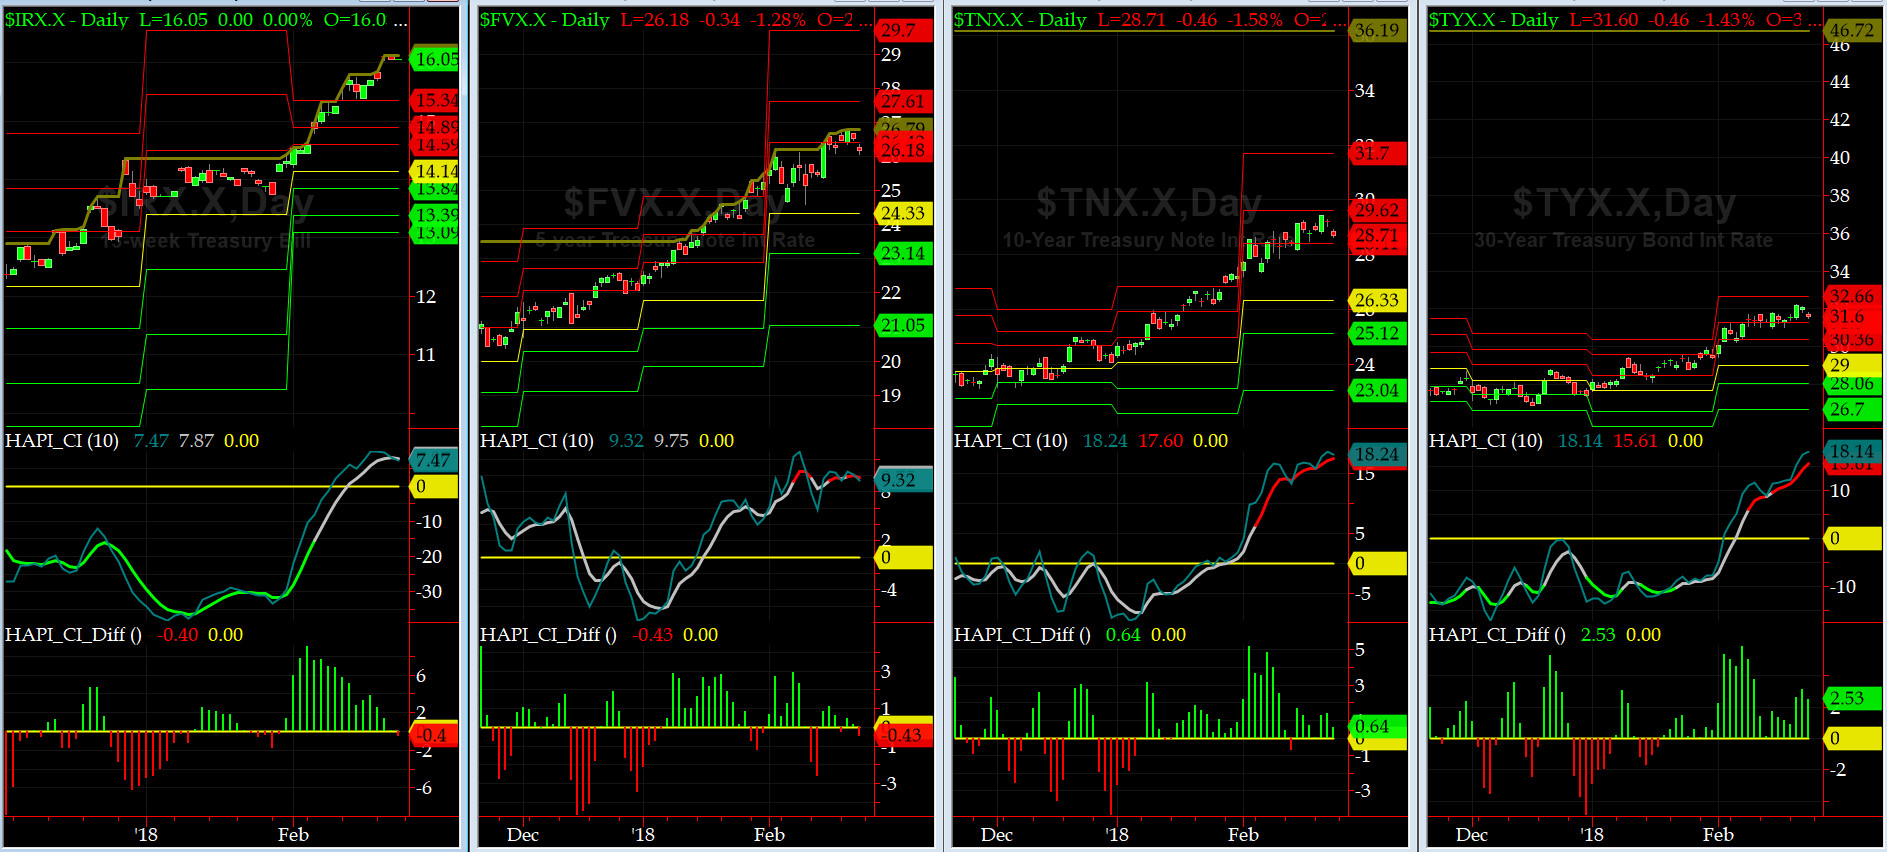
US Treasury T-Notes & T-Bonds Yields Chart
Again, our dear friends at Maury & Co, demanded a lot of more vig and the Treasury Curve sold off more, all across the Yield Curve.
Fari Hamzei
|
|
|
|
|
|
Saturday, February 24, 2018, 1310ET
Notice of Change of Bias with Timer Digest
Dear Jim,
SPX had a retest failure at its 50-bar MA and punched thru yesterday.
So, for now, the downside move is no longer in play (notwithstanding exogenous news, ie, DPRK, Grumpino, Jared, Putin, Bibi etc etc)
Therefore, we are getting LONG SPX here�. at 2747.30>
HAGW��
Fari Hamzei
|
|
|
|
|
|
Customer Care:
|
|
|
|
|
|
|
 |
 |
|
 |
|
 |
 |
 |
HA YouTube Channel ::: HA Blog ::: Testimonials ::: Tutorials & FAQs ::: Privacy Policy
|
Trading Derivatives (Options & Futures) contains substantial risk and is not for every investor. An investor could potentially lose all or more than his/her initial investment.
Only risk capital should be used for trading and only those with sufficient risk capital should consider trading derivatives. Past performance is not
necessarily indicative of future results. Testimonials appearing on this website may not be representative of other clients or customers
and are not a guarantee of future performance or success.
|
| (c) 1998-2025, Hamzei Analytics, LLC.® All Rights Reserved. |
|
|