|
Sunday, March 4, 2018, 2230ET
Market Timing Charts, Analysis & Commentary for Issue #231

Timer Charts of S&P-500 Cash Index (SPX) + NASDAQ-100 Cash Index (NDX)
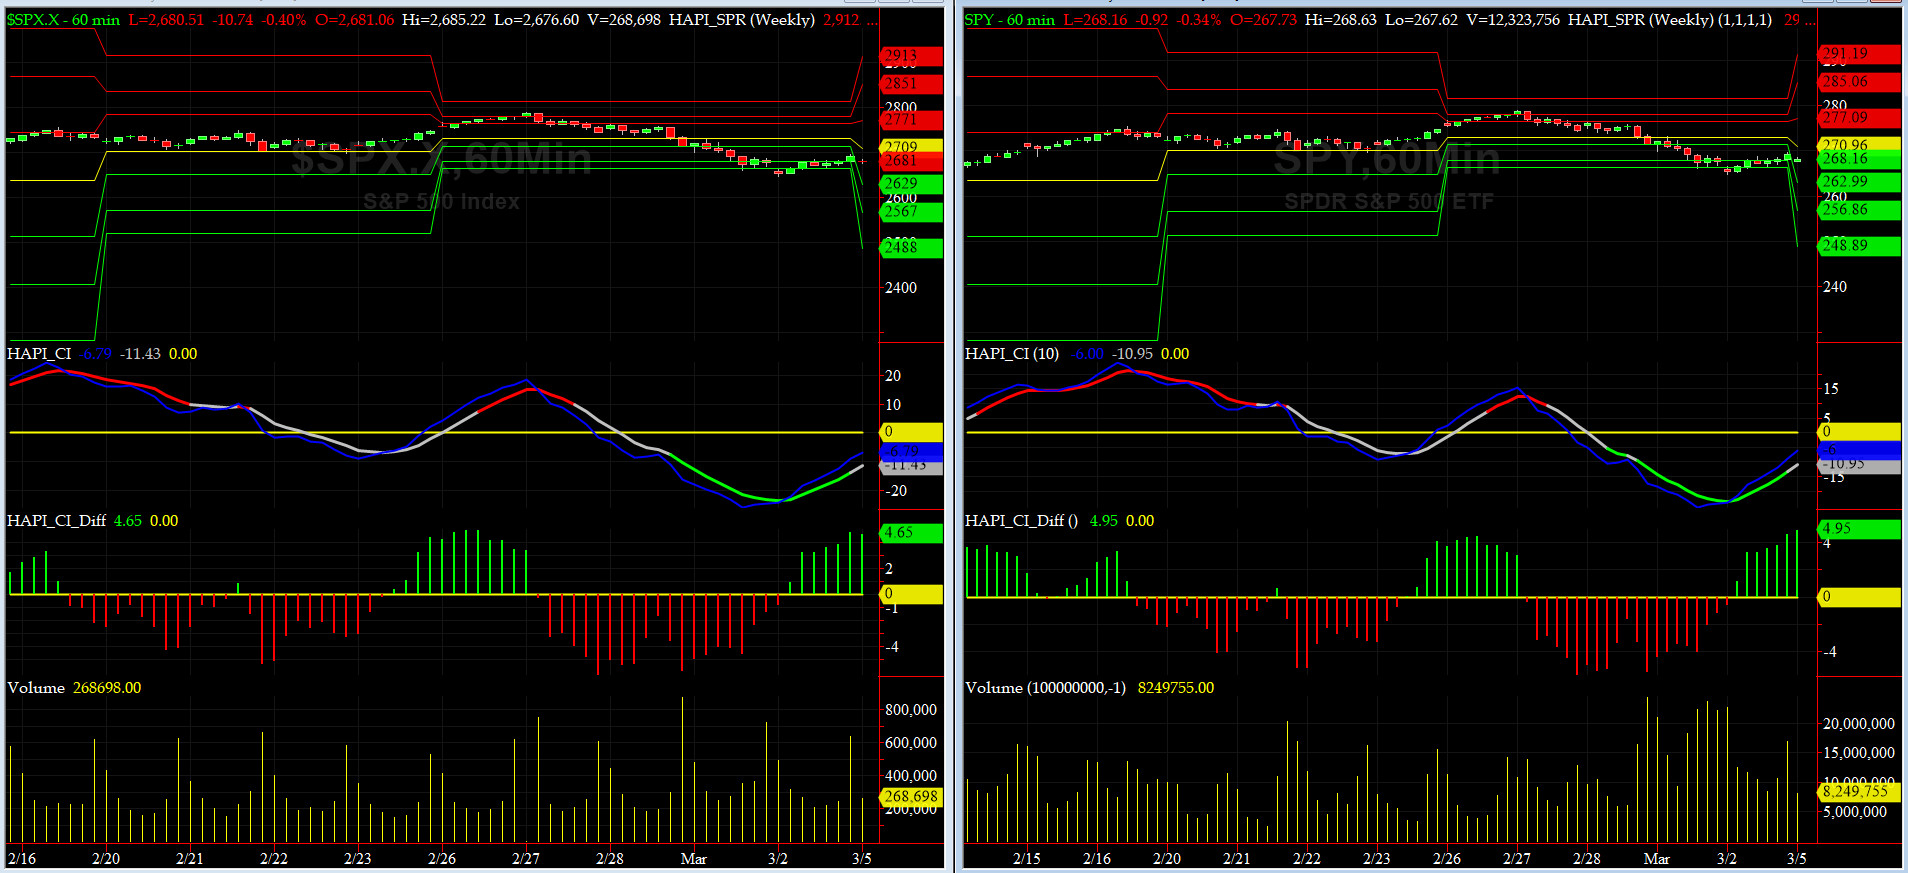
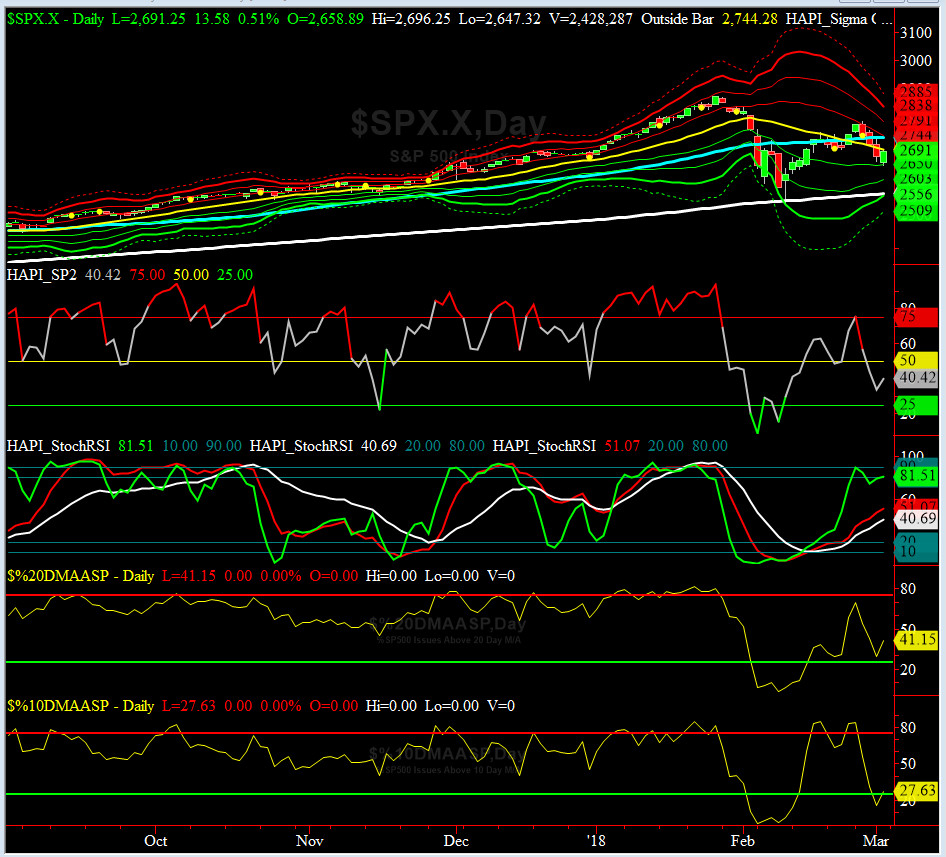
Most recent S&P-500 Cash Index (SPX): 2691.25 down -56.05 (down -2.04%) for the week ending on Friday, March 2, 2018, which closed just below its zero sigma.
SPX ALL TIME INTRADAY HIGH = 2873.87 (reached on Friday, Jan 26, 2018)
SPX ALL TIME CLOSING HIGH = 2873.87 (reached on Friday, Jan 26, 2018)
Current DAILY +2 Sigma SPX = 2791 with WEEKLY +2 Sigma = 2850
Current DAILY 0 Sigma (20 day MA) SPX = 2697 with WEEKLY 0 Sigma = 2680
Current DAILY -2 Sigma SPX = 2603 with WEEKLY -2 Sigma = 2510
NYSE McClellan Oscillator = -13 (-150 is start of the O/S area; around -275 to -300 area or lower, we go into the �launch-pad� mode, over +150, we are in O/B area)
NYSE Breadth Thrust = 48.4 (40 is considered as oversold and 65 as overbought)
Worth noting: outside bar reversal in SPX WEEKLY Chart. we do not see those often.
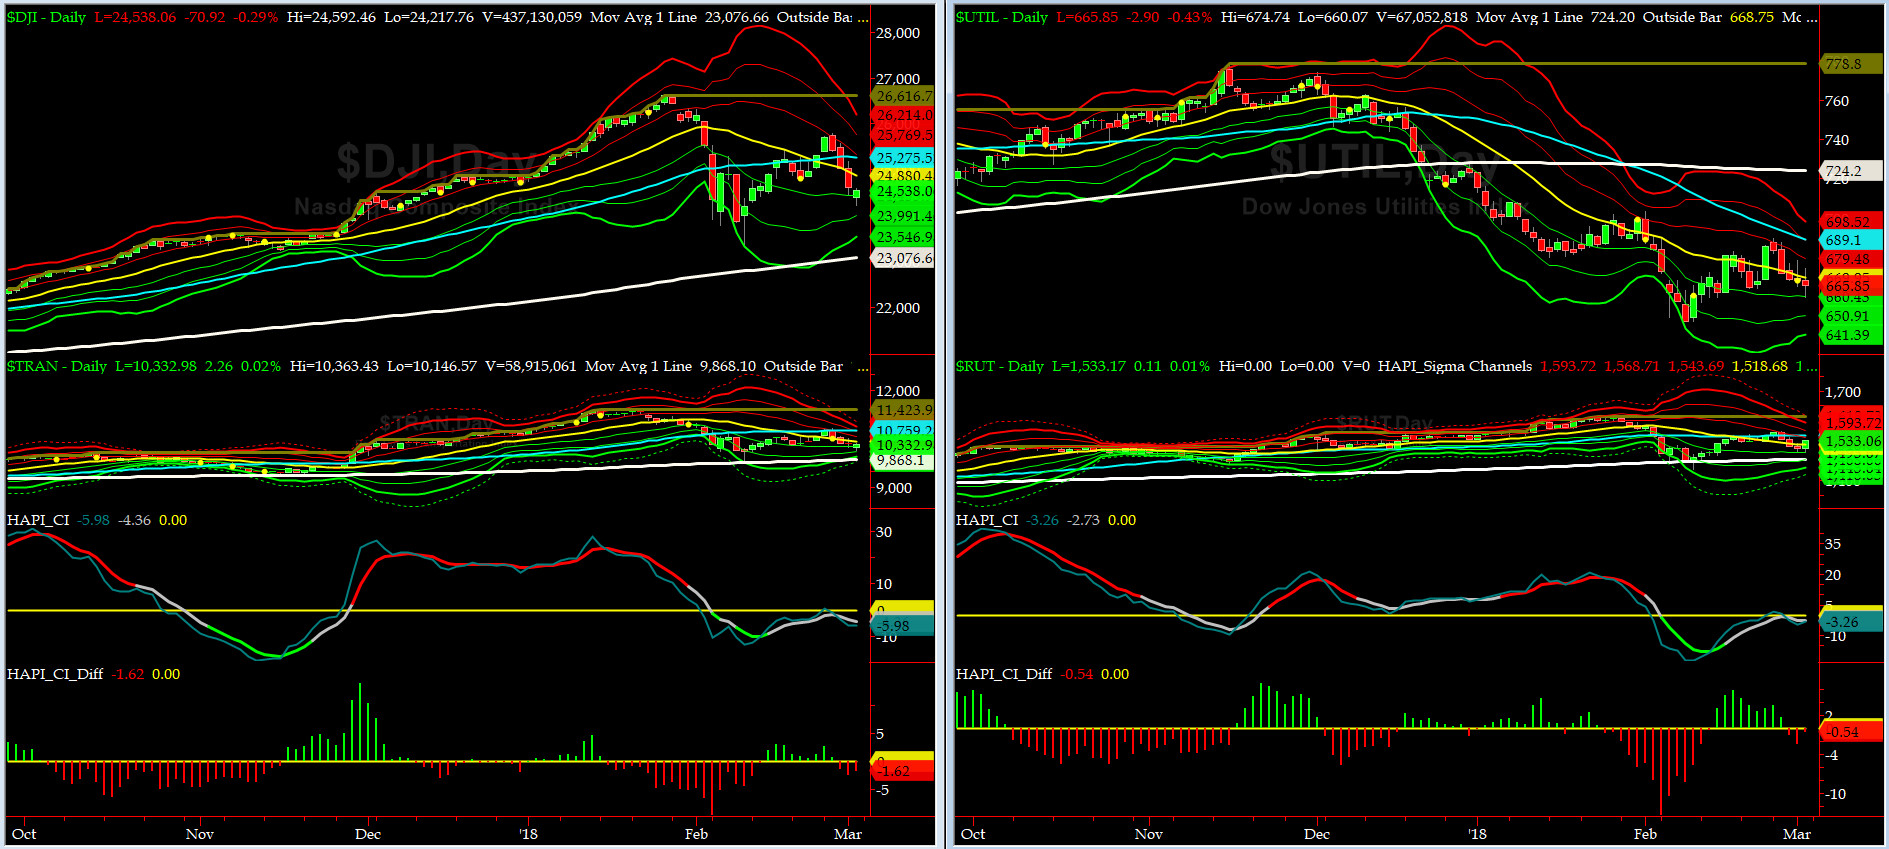
Canaries [in the Coal Mine] Chart for DJ TRAN & RUT Indices
200-Day MA DJ TRAN = 9868 or 4.7% above DJ TRAN (max observed in last 7 yrs = 20.2%, min = -20.3%)
200-Day MA RUT = 1471 or 4.2% above RUT (max observed in last 7 yrs = 21.3%, min = -22.6%)
DJ Transportation Index (proxy for economic conditions 6 to 9 months hence) had another tough week having sold off hard from its 50Day MA.
Russell 2000 Small Caps Index (proxy for Risk ON/OFF) had a slightly better week but also could not get over its 50Day MA. RISKY assets are still hanging in there but for how long?
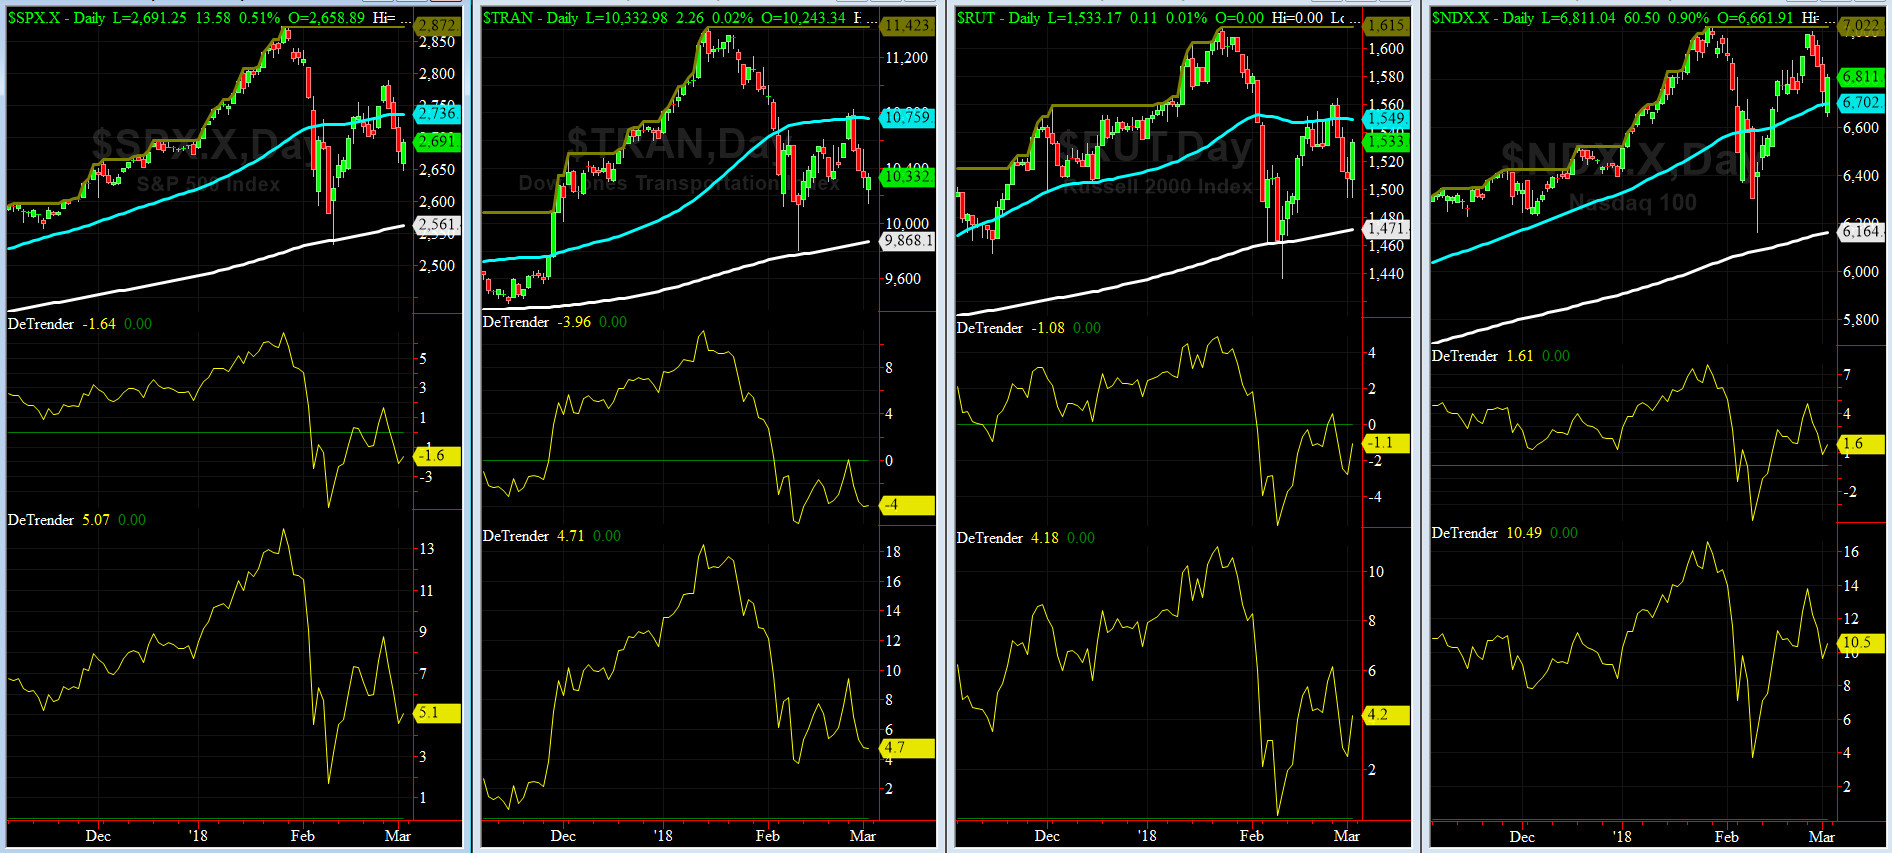
DeTrenders Charts for SPX, NDX, TRAN & RUT Indices
50-Day MA SPX = 2736 or -1.6% below SPX (max observed in last 7 yrs = +8.6%, min = -9.3%)
200-Day MA SPX = 2561 or 5.1% below SPX (max observed in last 7 yrs = 15.2%, min = -14%)
Only FIVE of our EIGHT DeTrenders ended up in POSITIVE territory. The DeTrenders for DJ Tran & RUT will continue to be harbingers of future price behavior in broad indices.
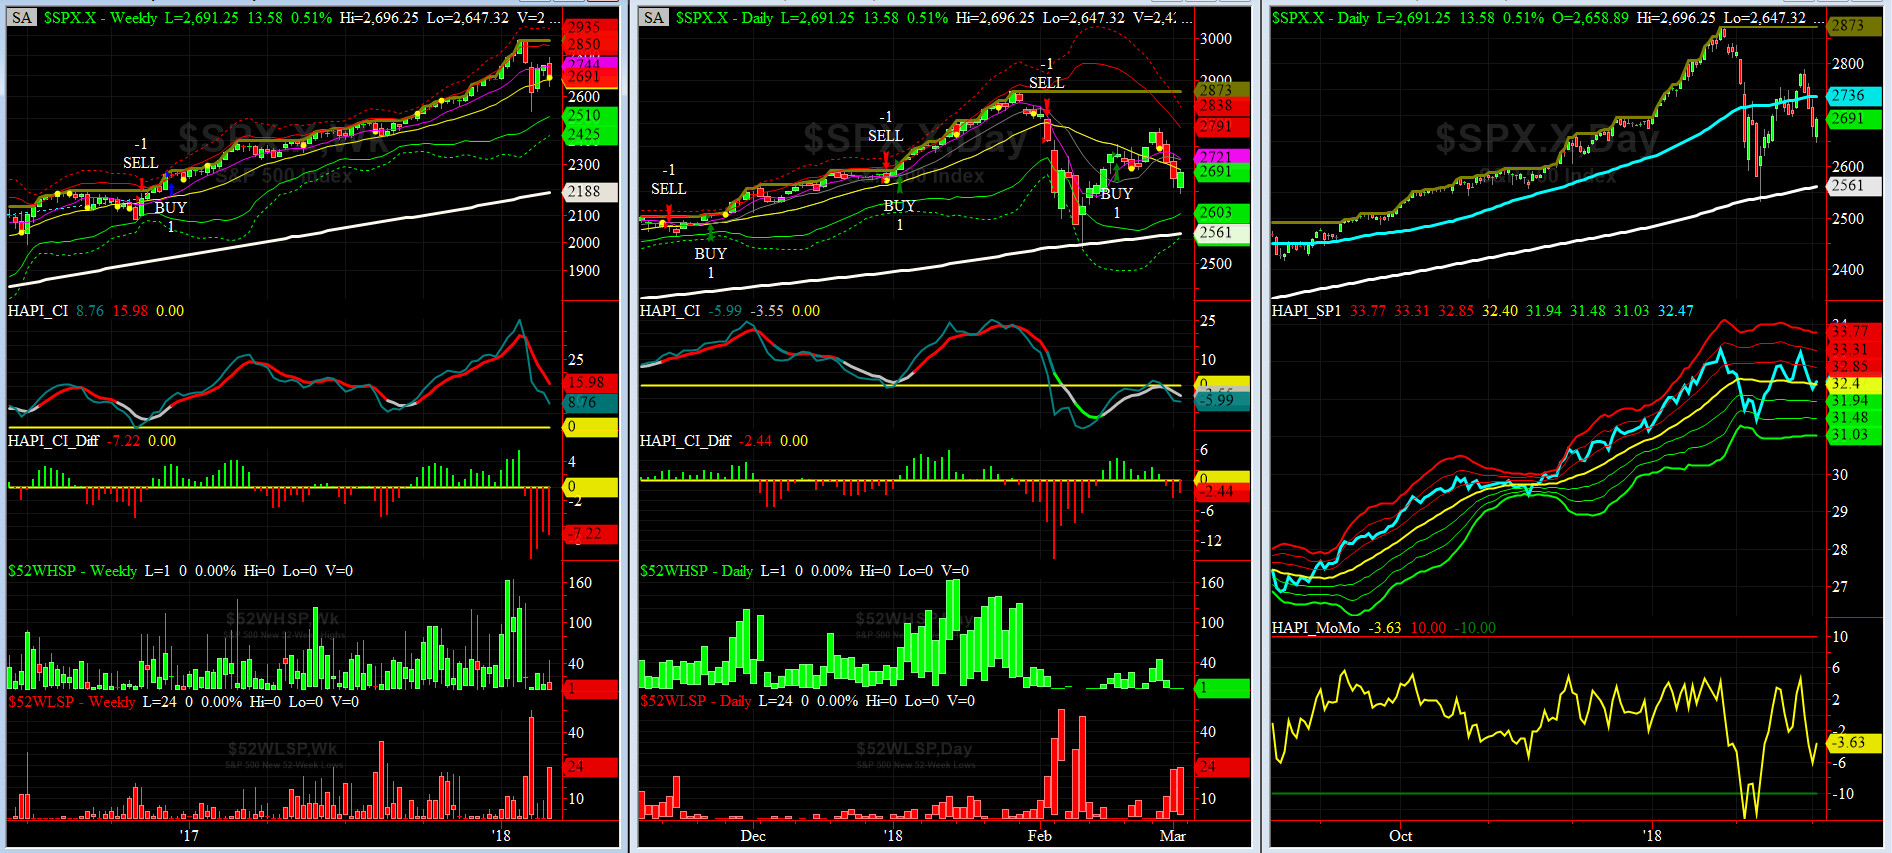
HA_SP1_Momo Chart
WEEKLY Timing Model = on a BUY Signal since Friday 12/16/16 CLOSE at 2258
DAILY Timing Model = on a BUY Signal since Friday 2/16/18 CLOSE at 2732
Max SPX 52wk-highs reading last week = 44 (over 120-140, the local maxima is in)
Max SPX 52wk-Lows reading last week = 24 (over 40-60, the local minima is in)
HA_SP1 closed near its zero sigma channels
HA_Momo = -3.6 (reversals most likely occur above +10 or below -10)
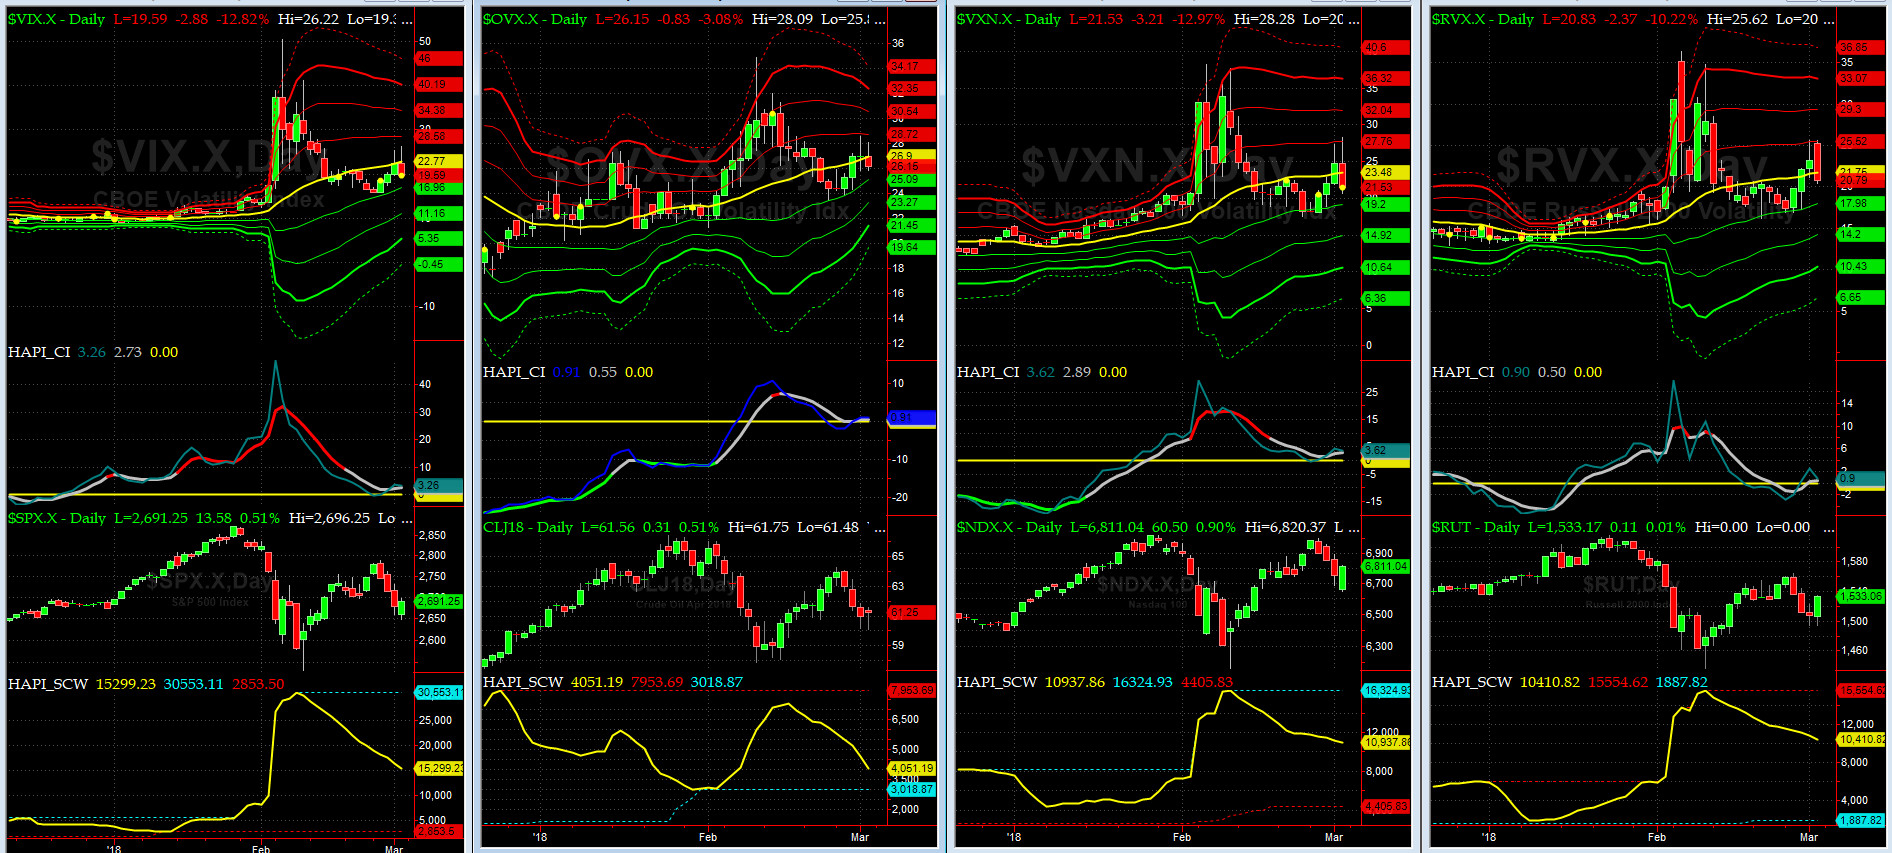
Vol of the Vols Chart
VIX currently stands at 19.6, at about its -0.5 sigma (remember it's the VIX volatility pattern aka "its sigma channels" that matters, and not the level of VIX itself (this is per Dr. Robert Whaley, a great mentor and inventor of original VIX, now called VXO). VIX usually peaks around a test of its +4 sigma).
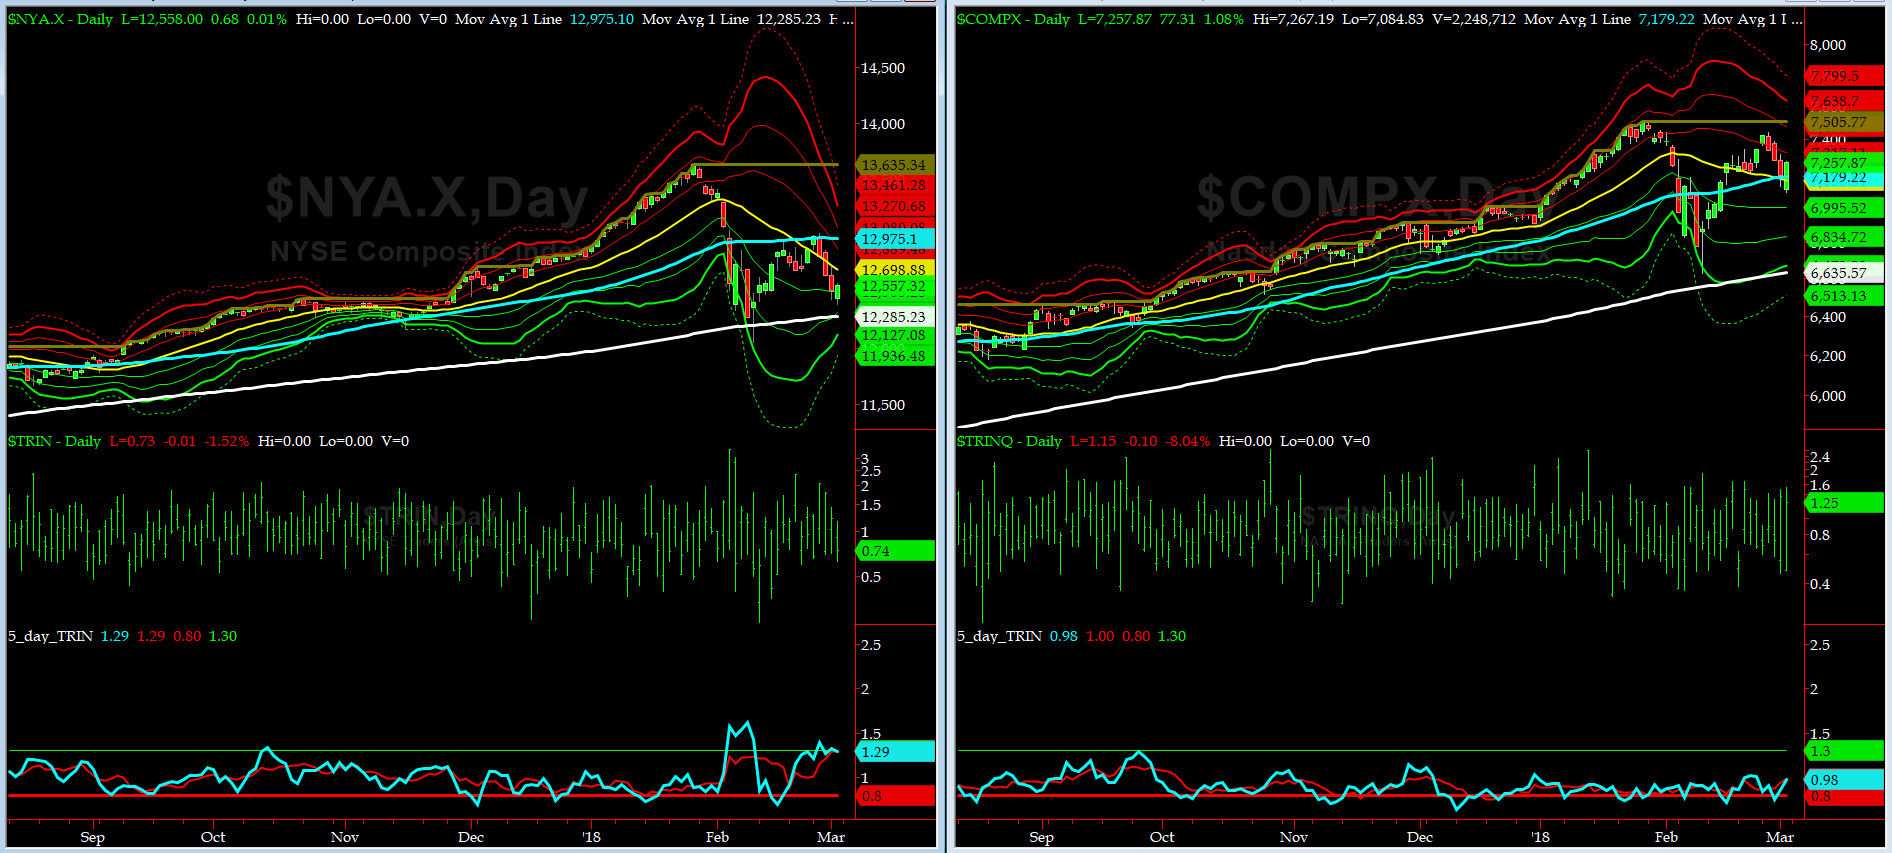
5-day TRIN & TRINQ Charts
Once again, the NYSE 5-day TRIN is in the BUY zone now.
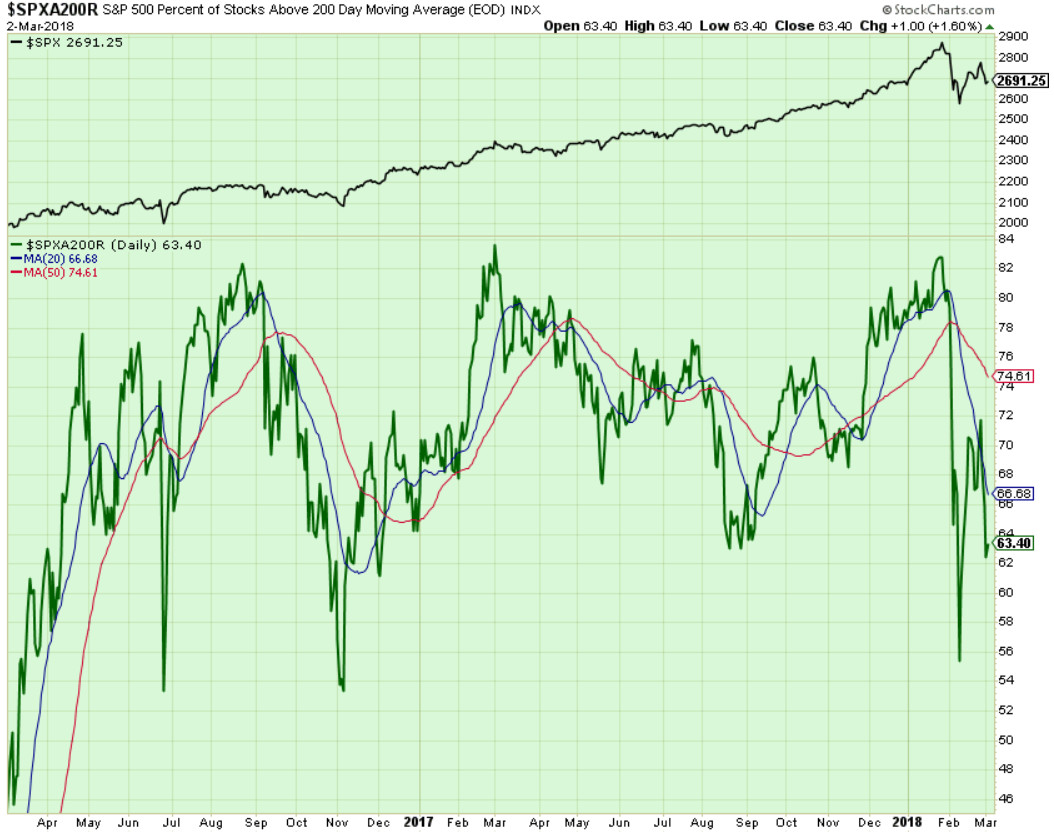
Components of SPX above their respective 200day MA Chart
This scoring indicator settled at near 63% after a sharp breakdown from Tuesday thru Thursday. The 55% level should be our next target for a retest failure.
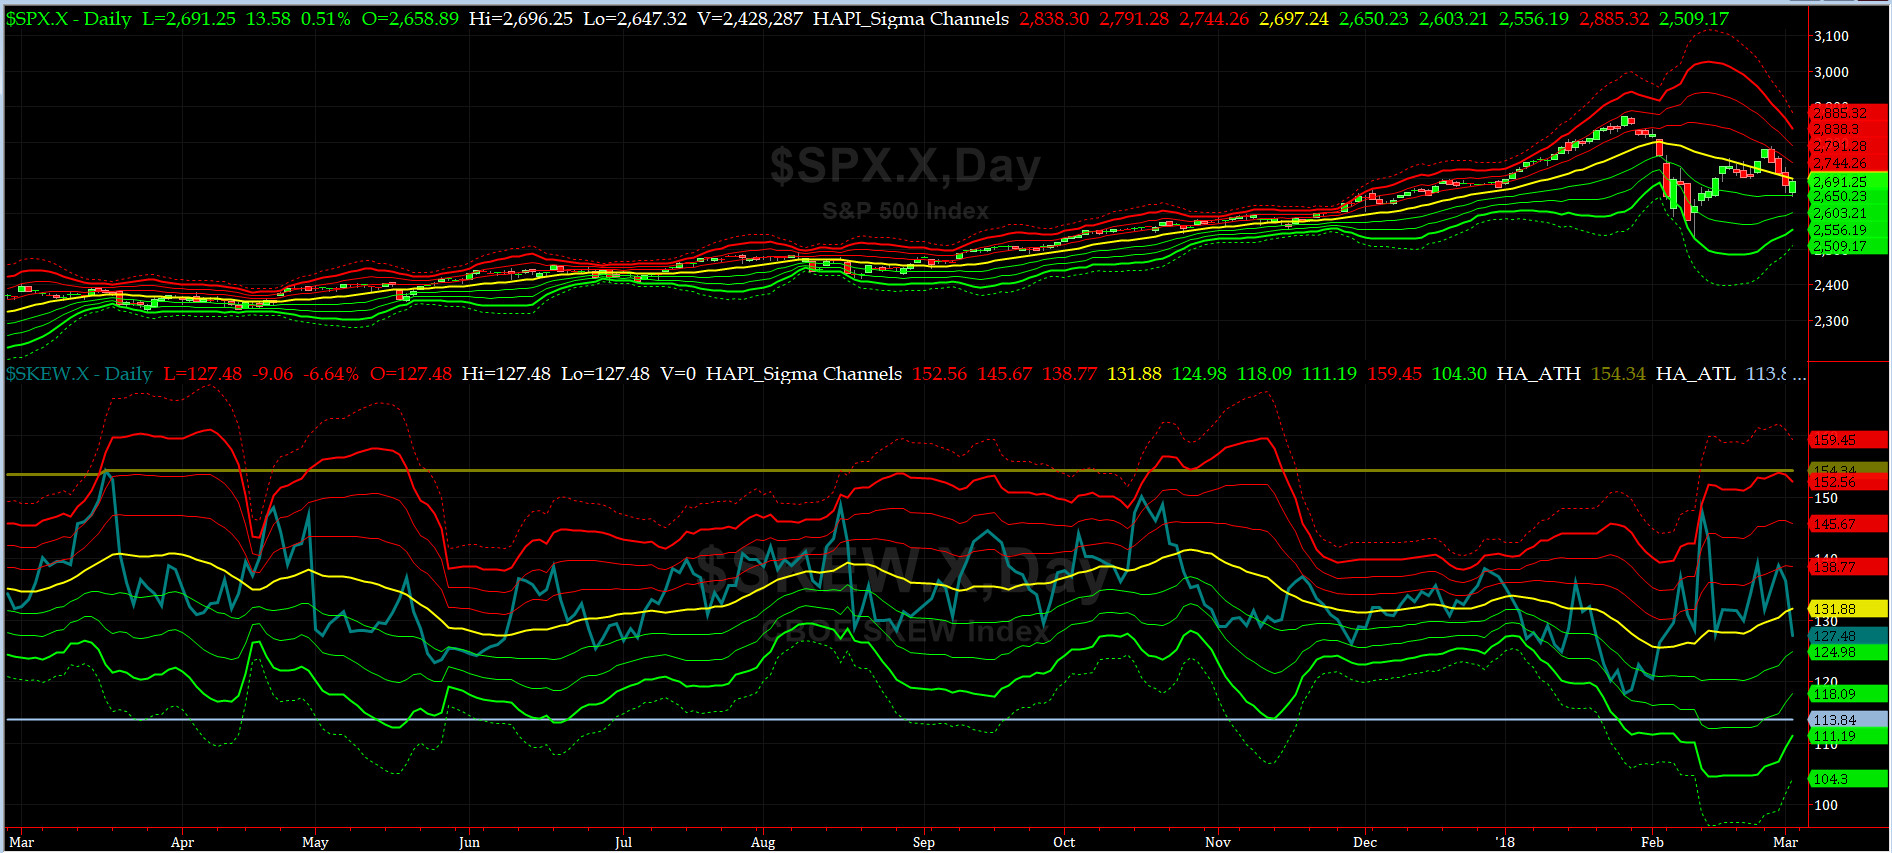
SPX SKEW (Tail Risk) Chart
Last week SPX SKEW (Tail Risk) closed at ~127.5, or about its -0.5 sigma (normal = 120-125, range 100-150).
Is all quiet on the Eastern & Mid-Western Fronts? Smart Money says yes. Our beloved @Capt_Tiko is still in the bear camp....
How to interpret the value of SPX SKEW? (from CBOE white paper on SKEW)

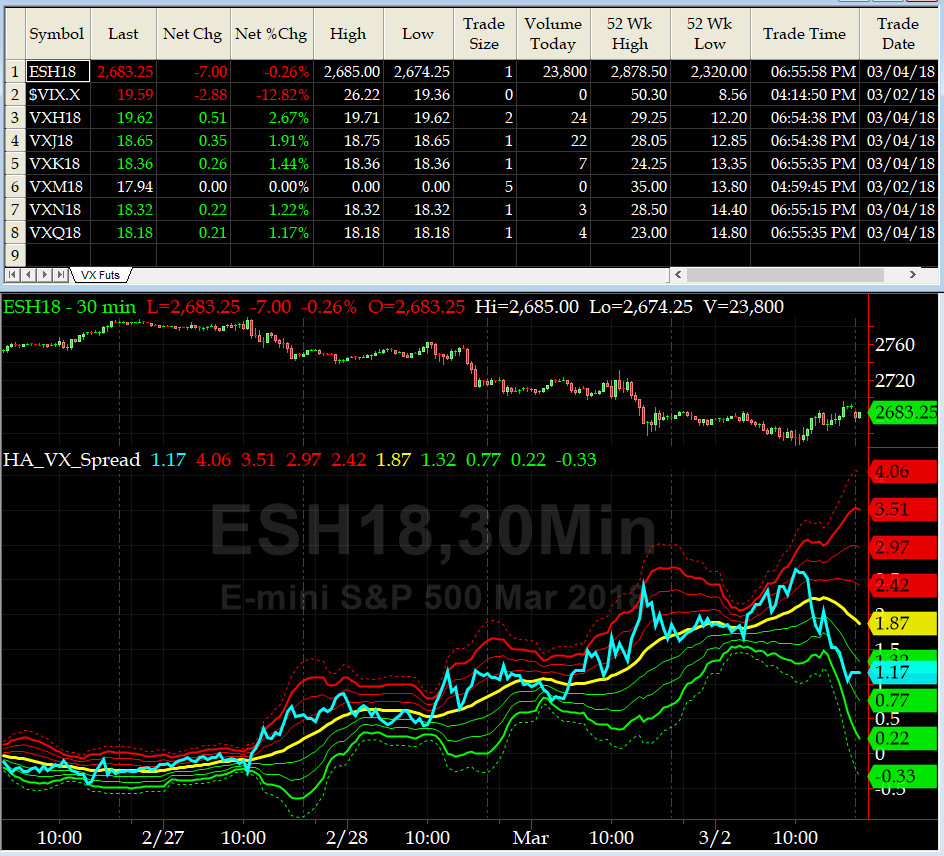
3-month VIX Futures Spread(VX) Chart
This popular timing indicator, now long March, short June VIX Futures again closed +1.17. Is the bottom in? we are still looking for the other shoe to drop.
HA_SP2 Chart
HA_SP2 = 40.4 (Buy signal <= 25, Sell Signal >= 75)
On Friday, this coveted timing indicator was trading at 28 (just above its oversold zone) but by end of the day, it rallied to 40+, most likely a tell for a further move down. We need to see a solid move below 25 to count on a good bounce.
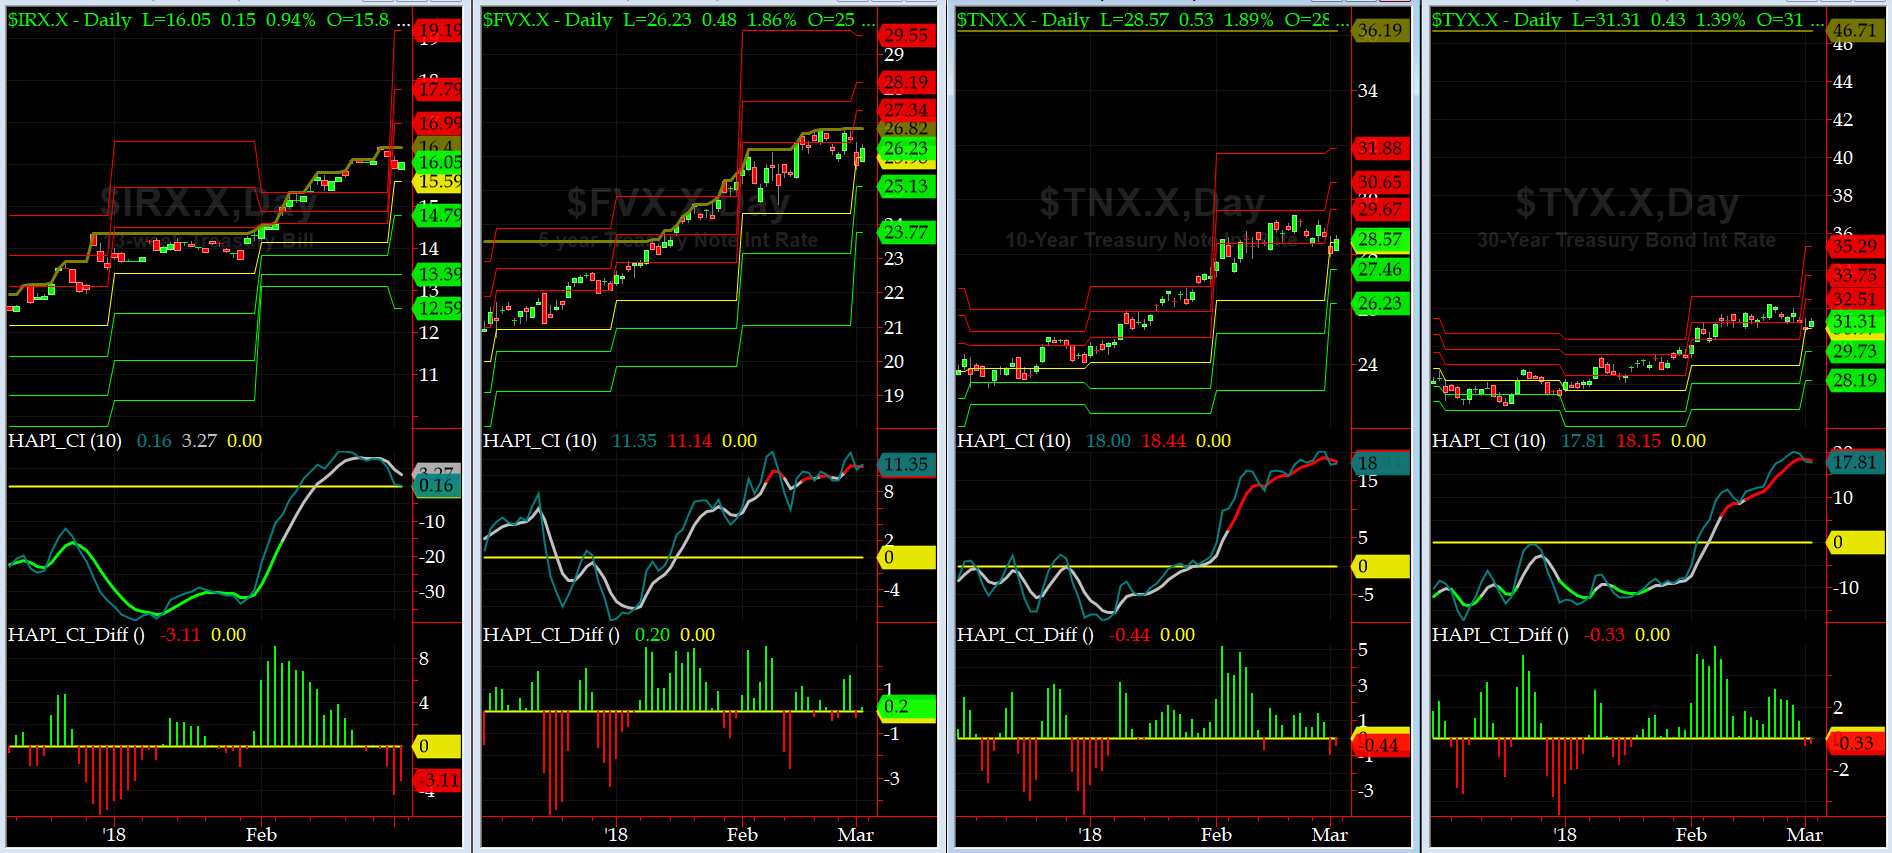
US Treasury T-Notes & T-Bonds Yields Chart
The Flight-to-Safety Trade is here.... but as our dear Maury reminded us: For How Long?
Fari Hamzei
|


 Proactive Market Timing