|
Sunday, March 11, 2018, 1745ET
Market Timing Charts, Analysis & Commentary for Issue #232
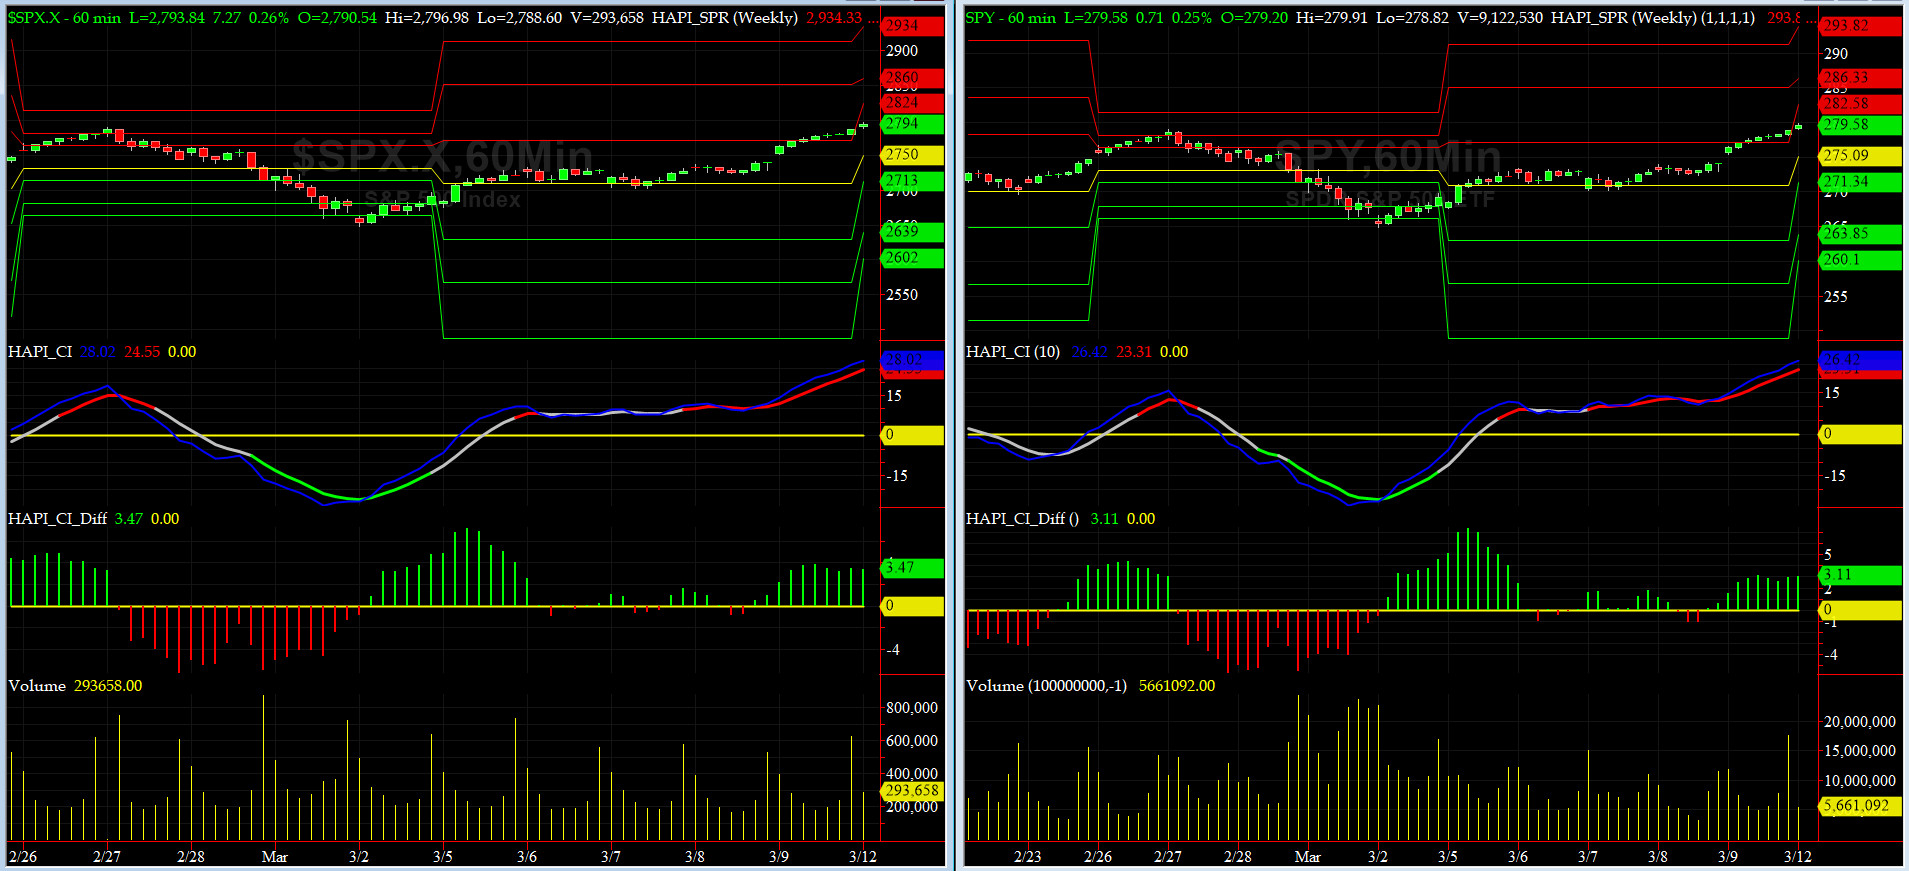
Timer Charts of S&P-500 Cash Index (SPX) + NASDAQ-100 Cash Index (NDX)
Most recent S&P-500 Cash Index (SPX): 2786.57 up 95.32 (up + 3.54%) for the week ending on Friday, March 9, 2018, which closed just below its +2 sigma.
SPX ALL TIME INTRADAY HIGH = 2872.87 (reached on Friday, Jan 26, 2018)
SPX ALL TIME CLOSING HIGH = 2872.87 (reached on Friday, Jan 26, 2018)
Current DAILY +2 Sigma SPX = 2792 with WEEKLY +2 Sigma = 2860
Current DAILY 0 Sigma (20 day MA) SPX = 2714 with WEEKLY 0 Sigma = 2691
Current DAILY -2 Sigma SPX = 2636 with WEEKLY -2 Sigma = 2522
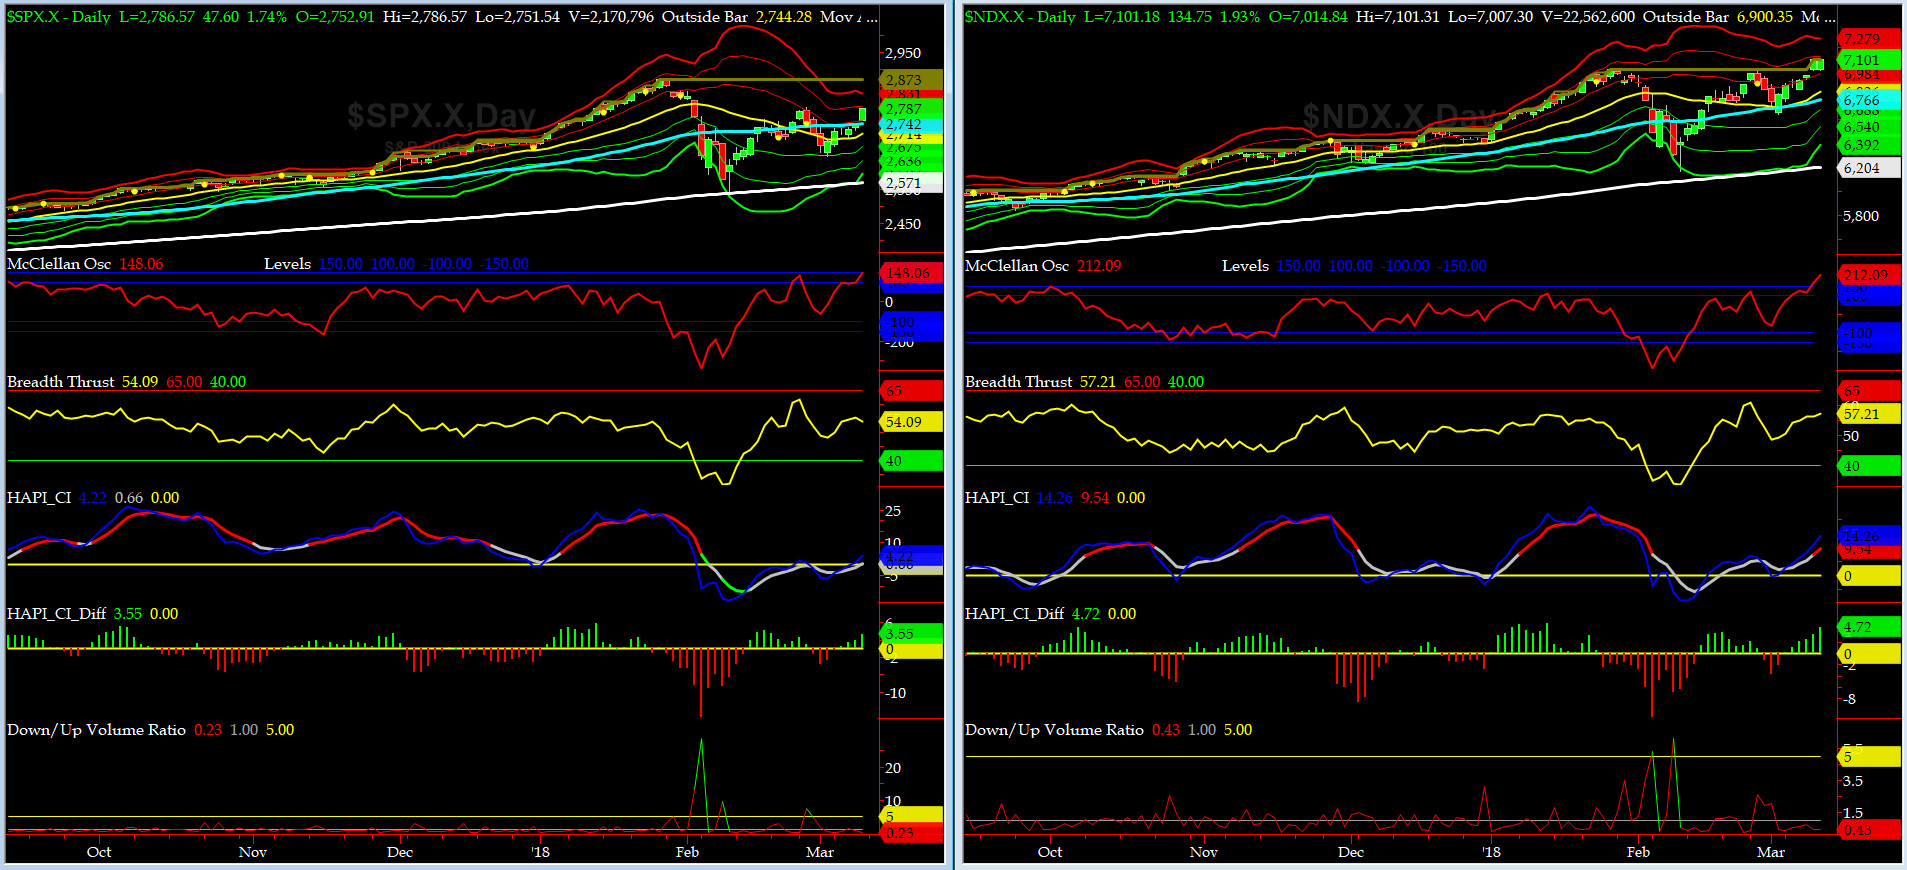
NYSE McClellan Oscillator = +148 (-150 is start of the O/S area; around -275 to -300 area or lower, we go into the �launch-pad� mode, over +150, we are in O/B area)
NYSE Breadth Thrust = 54.1 (40 is considered as oversold and 65 as overbought)
Another worth noting: after last week's outside bar reversal in SPX WEEKLY Chart, we have FOUR positive closes this week. we do not see those often.
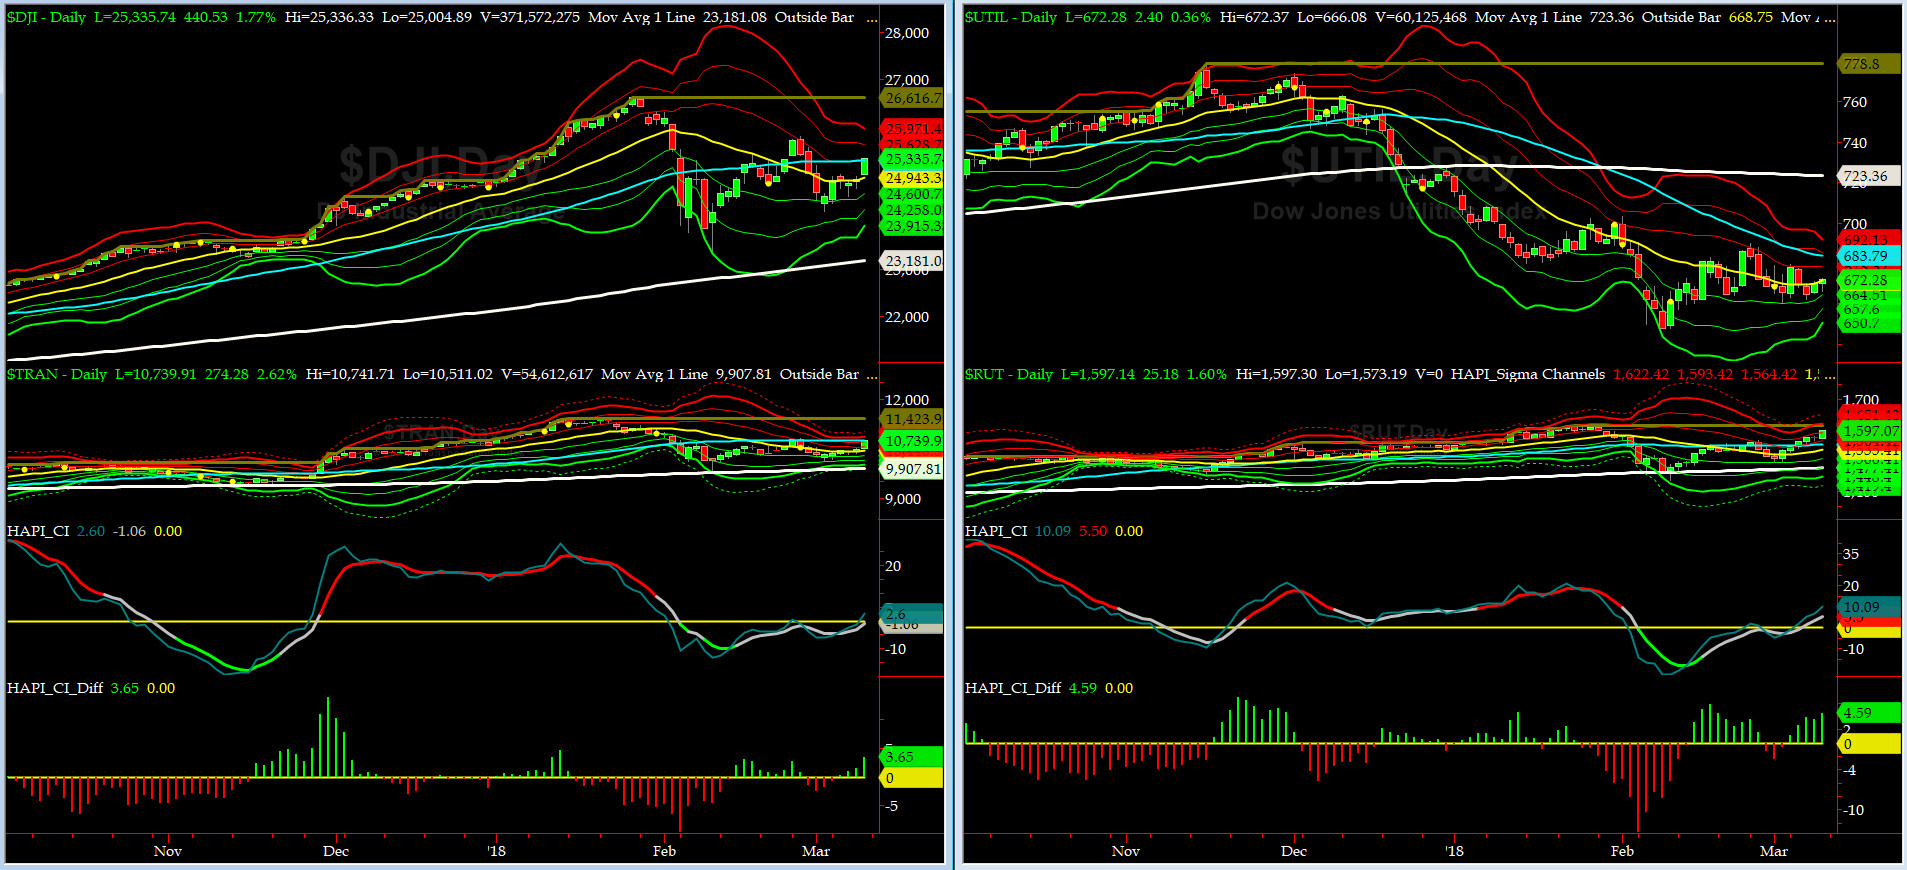
Canaries [in the Coal Mine] Chart for DJ TRAN & RUT Indices
200-Day MA DJ TRAN = 9907 or 8.4% above DJ TRAN (max observed in last 7 yrs = 20.2%, min = -20.3%)
200-Day MA RUT = 1476 or 8.2% above RUT (max observed in last 7 yrs = 21.3%, min = -22.6%)
DJ Transportation Index (proxy for economic conditions 6 to 9 months hence) had another excellent week, coming back with a roar having sold off hard during the prior week.
Russell 2000 Small Caps Index (proxy for Risk ON/OFF) went thru MAX Q (its 50-day MA and now poised to make new ATHs. RISKY is back ON.

DeTrenders Charts for SPX, NDX, TRAN & RUT Indices
50-Day MA SPX = 2741 or 1.6% below SPX (max observed in last 7 yrs = +8.6%, min = -9.3%)
200-Day MA SPX = 2570 or 8.4% below SPX (max observed in last 7 yrs = 15.2%, min = -14%)
Now, SEVEN of our EIGHT DeTrenders ended up in POSITIVE territory. The DeTrenders for DJ Tran & RUT will continue to be harbingers of future price behavior in broad indices.
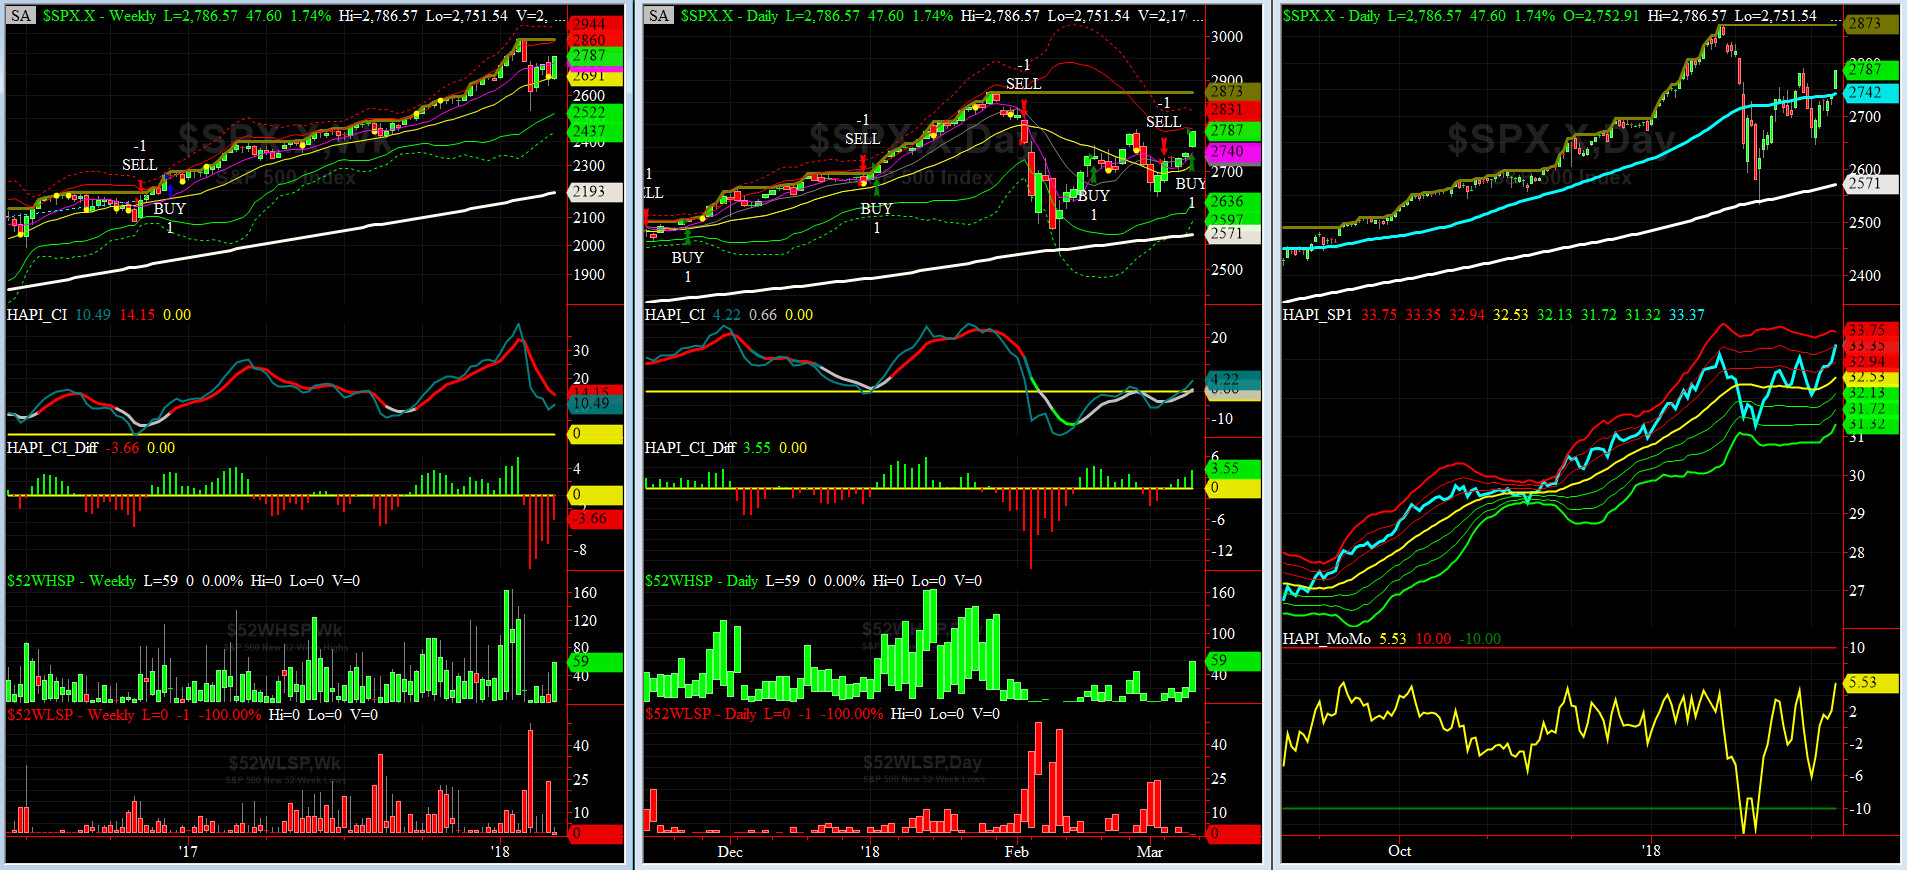
HA_SP1_Momo Chart
WEEKLY Timing Model = on a BUY Signal since Friday 12/16/16 CLOSE at 2258
DAILY Timing Model = on a BUY Signal since Friday 3/09/18 CLOSE at 2786
Max SPX 52wk-highs reading last week = 59 (over 120-140, the local maxima is in)
Max SPX 52wk-Lows reading last week = 3 (over 40-60, the local minima is in)
HA_SP1 closed near its +2 sigma channels
HA_Momo = +5.53 (reversals most likely occur above +10 or below -10)
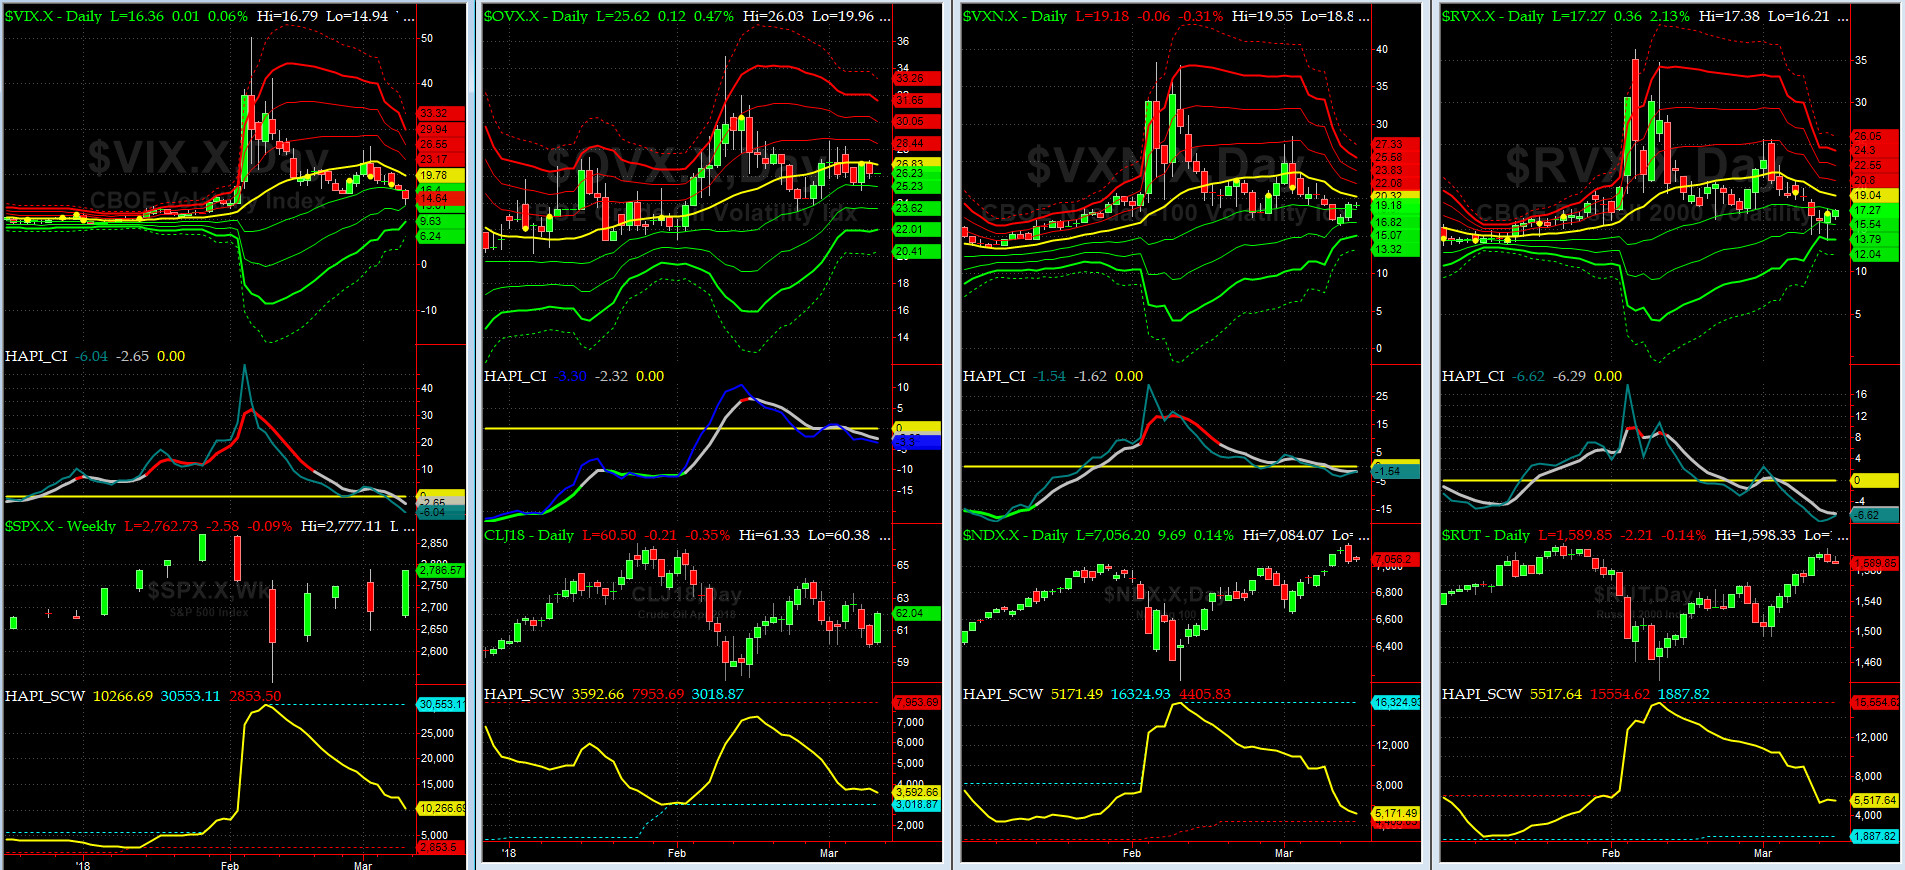
Vol of the Vols Chart
VIX currently stands at 14.6, at about its zero sigma (remember it's the VIX volatility pattern aka "its sigma channels" that matters, and not the level of VIX itself (this is per Dr. Robert Whaley, a great mentor and inventor of original VIX, now called VXO). VIX usually peaks around a test of its +4 sigma).
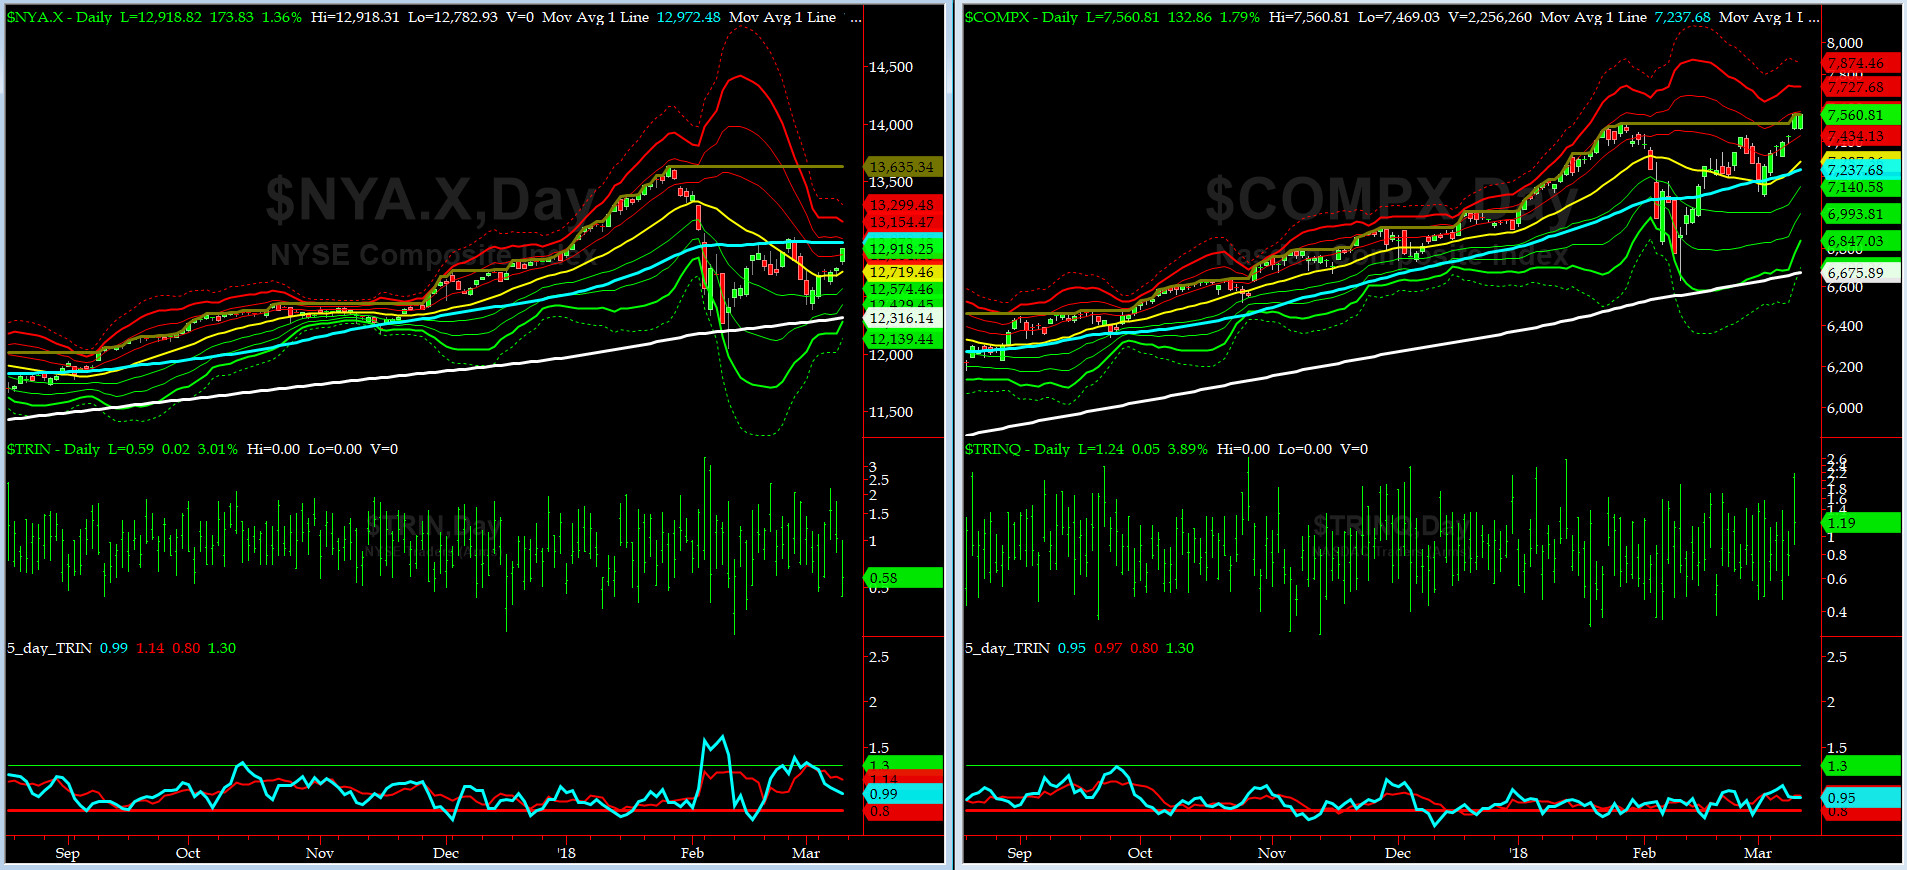
5-day TRIN & TRINQ Charts
Both NYSE & NASDAQ 5-day TRIN are in the NEUTRAL zone now.
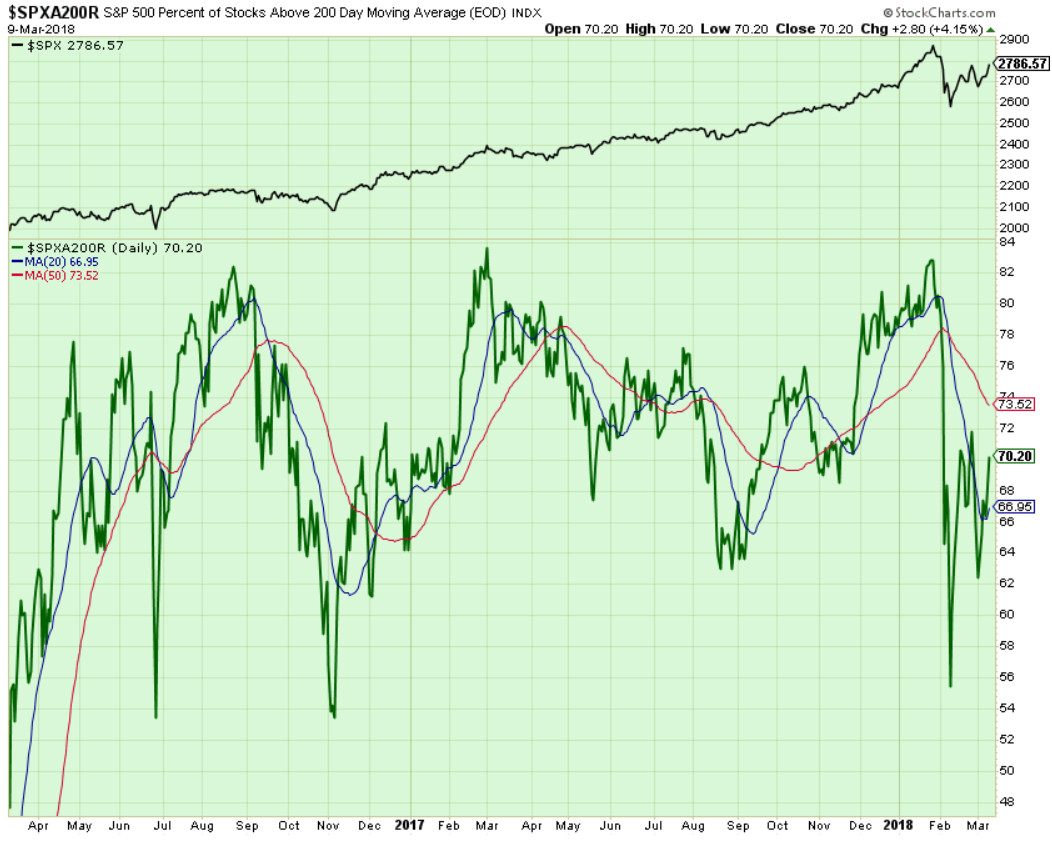
Components of SPX above their respective 200day MA Chart
This scoring indicator rallied hard from 62% to 70%. The 74%-75% level should be our next target for a retest failure.
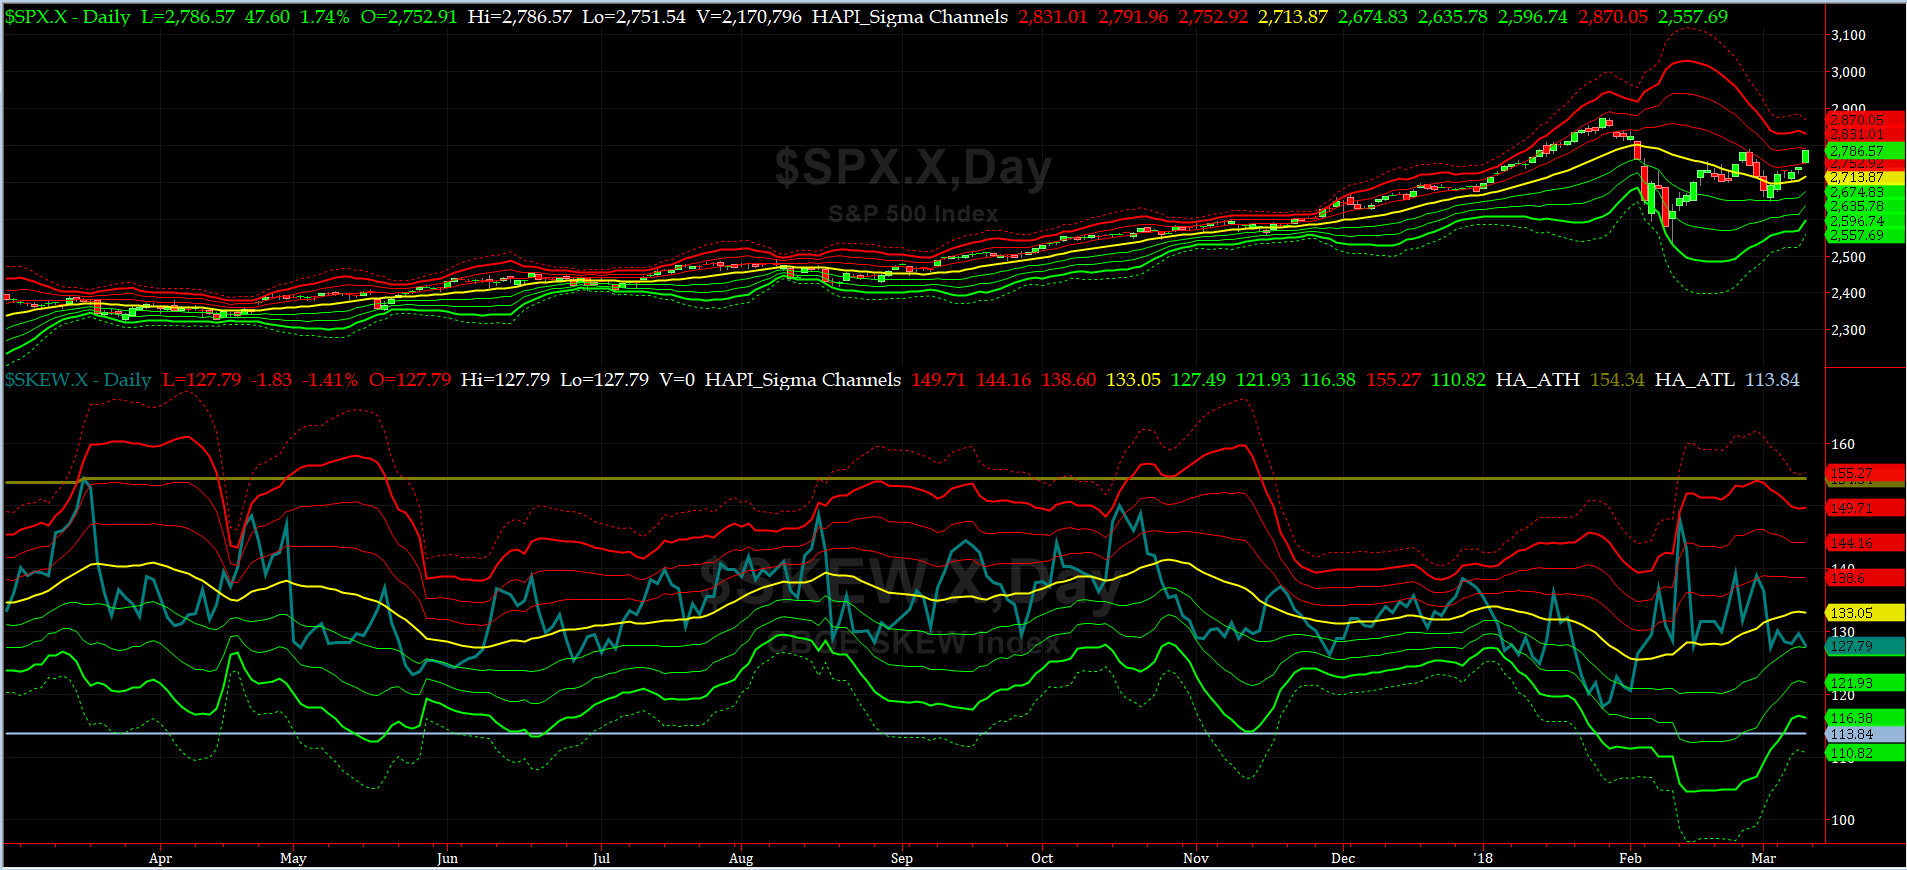
SPX SKEW (Tail Risk) Chart
Last week SPX SKEW (Tail Risk) closed at ~127.8, or about its -1 sigma (normal = 120-125, range 100-150).
Is all quiet on the Eastern & Mid-Western Fronts? Smart Money says yes.
How to interpret the value of SPX SKEW? (from CBOE white paper on SKEW)

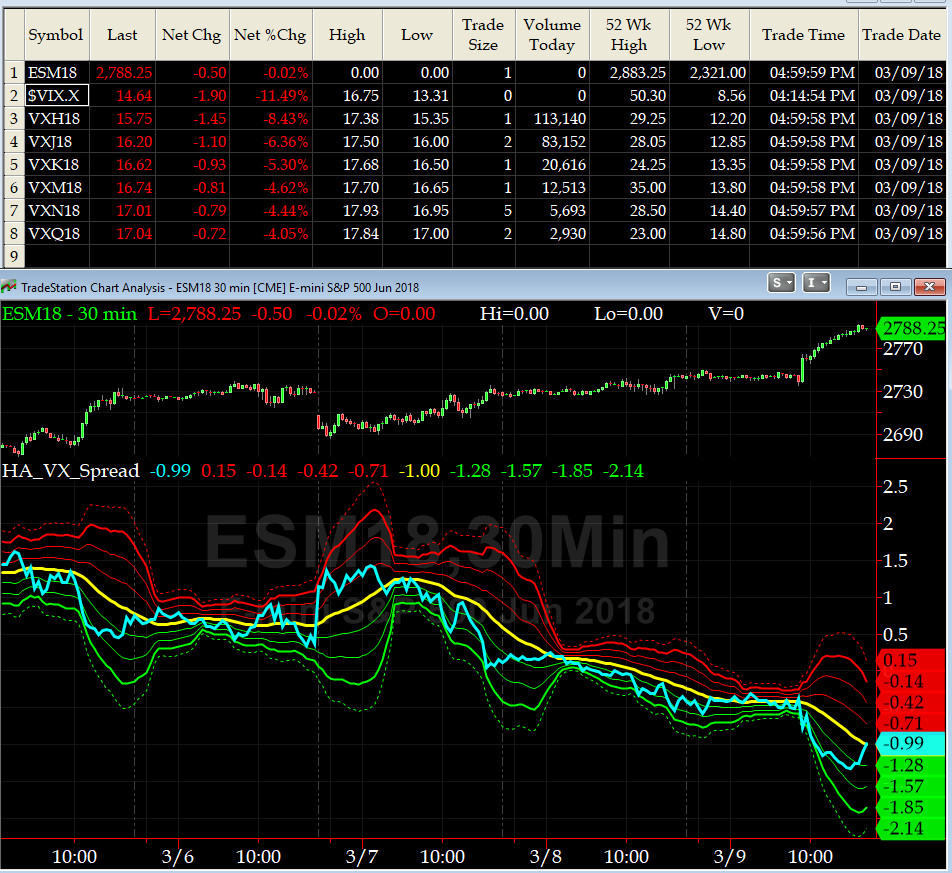
3-month VIX Futures Spread(VX) Chart
This popular timing indicator, now long March, short June VIX Futures again closed -1. Is the bottom in? @Capt_Tiko says who knows.
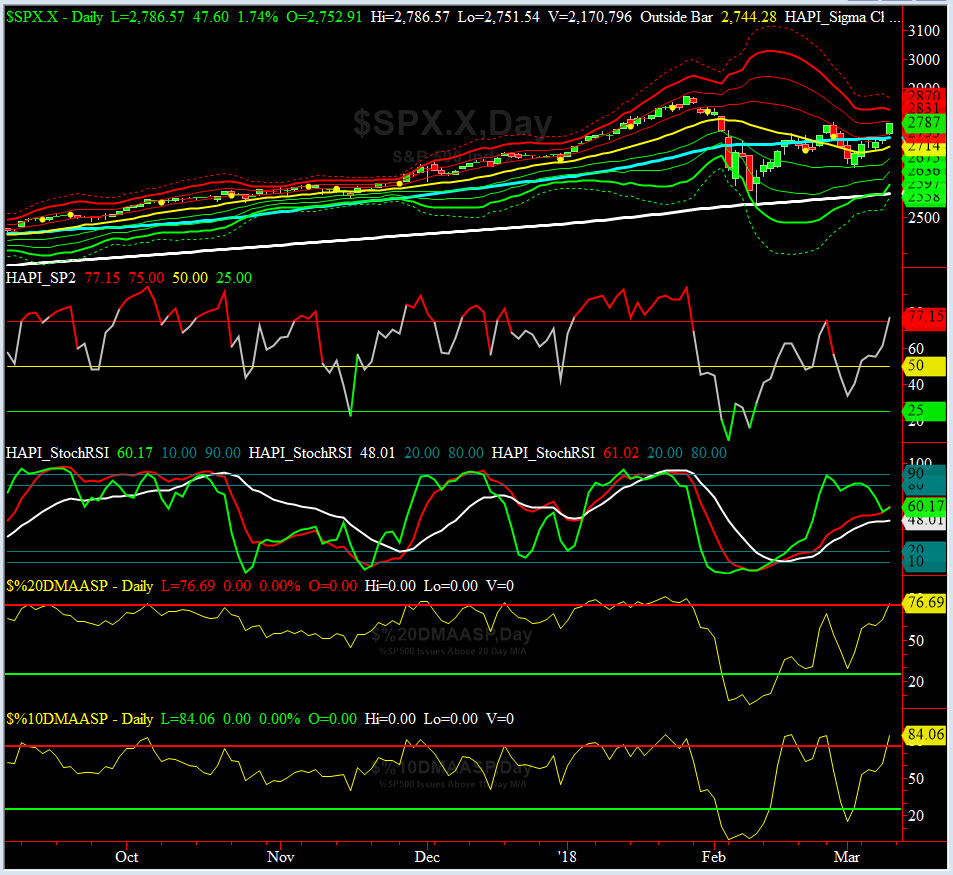
HA_SP2 Chart
HA_SP2 = 77.1 (Buy signal <= 25, Sell Signal >= 75)
This coveted prop indicator says we are about to enter overbought territory. Watch for possible retest failure in 80 to 85 area.
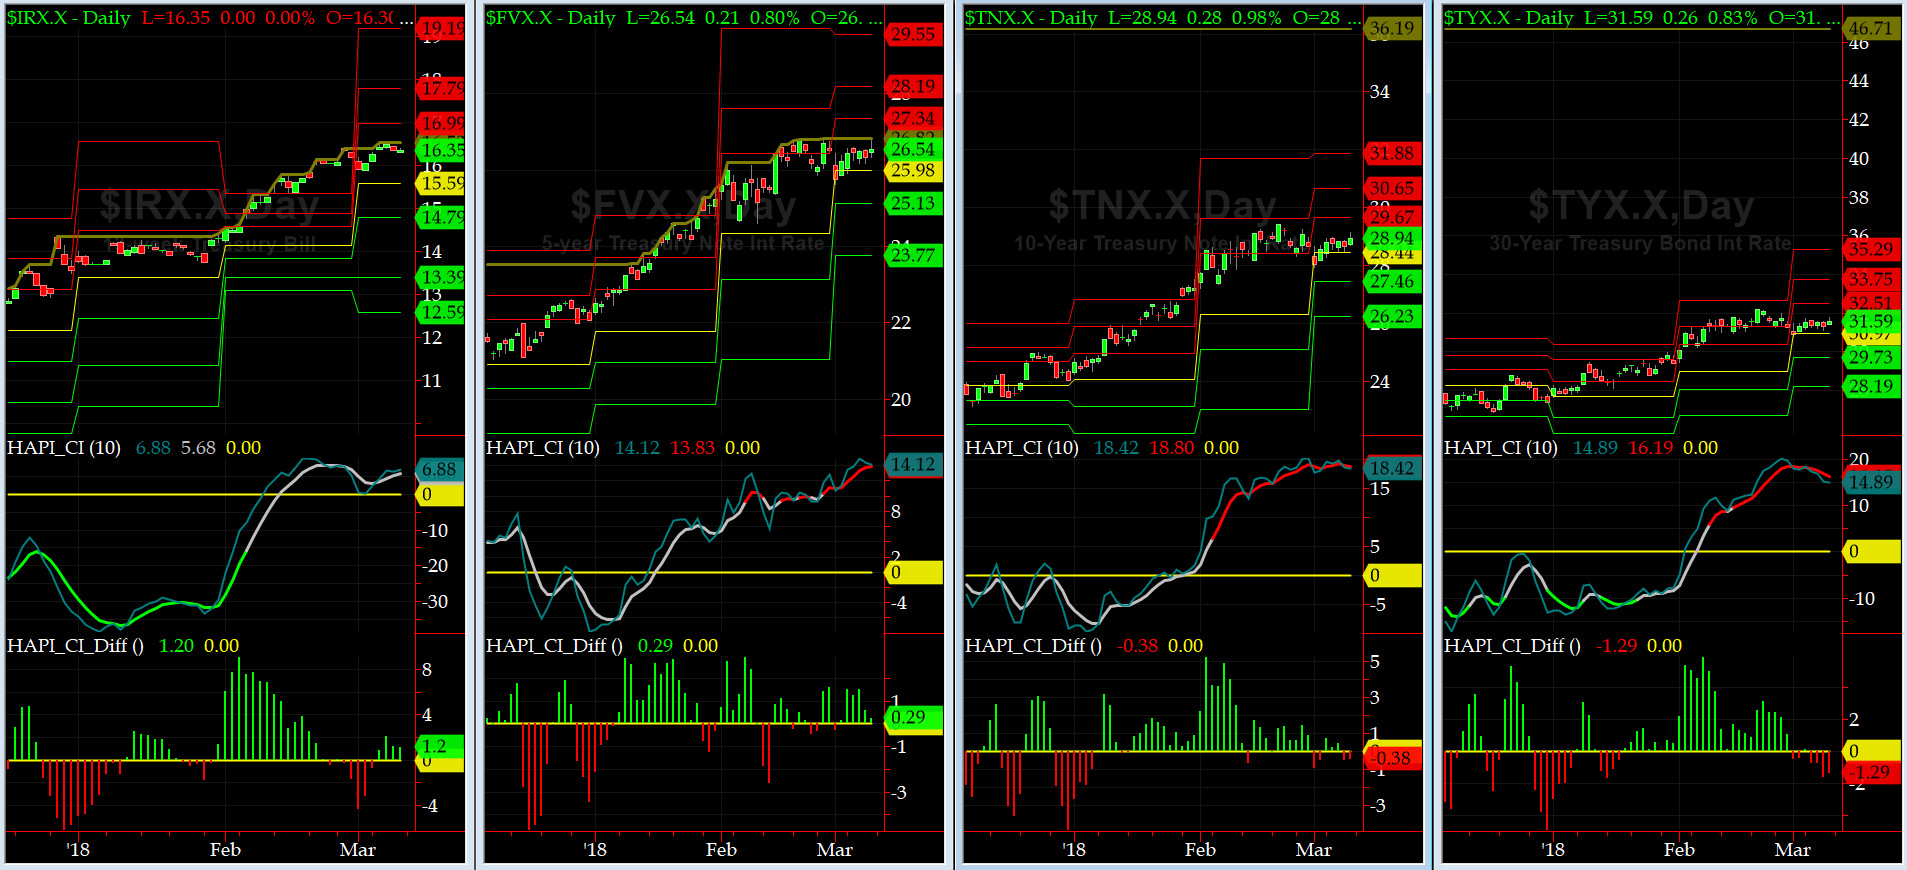
US Treasury T-Notes & T-Bonds Yields Chart
The Flight-to-Safety Trade is over.... our dear friends at Maury & Co. are happy again. And, now, we ask: For How Long?
Fari Hamzei
|


 Proactive Market Timing