|
Sunday, April 22, 2018, 1530ET
Market Timing Charts, Analysis & Commentary for Issue #237
Timer Charts of S&P-500 Cash Index (SPX) + NASDAQ-100 Cash Index (NDX)
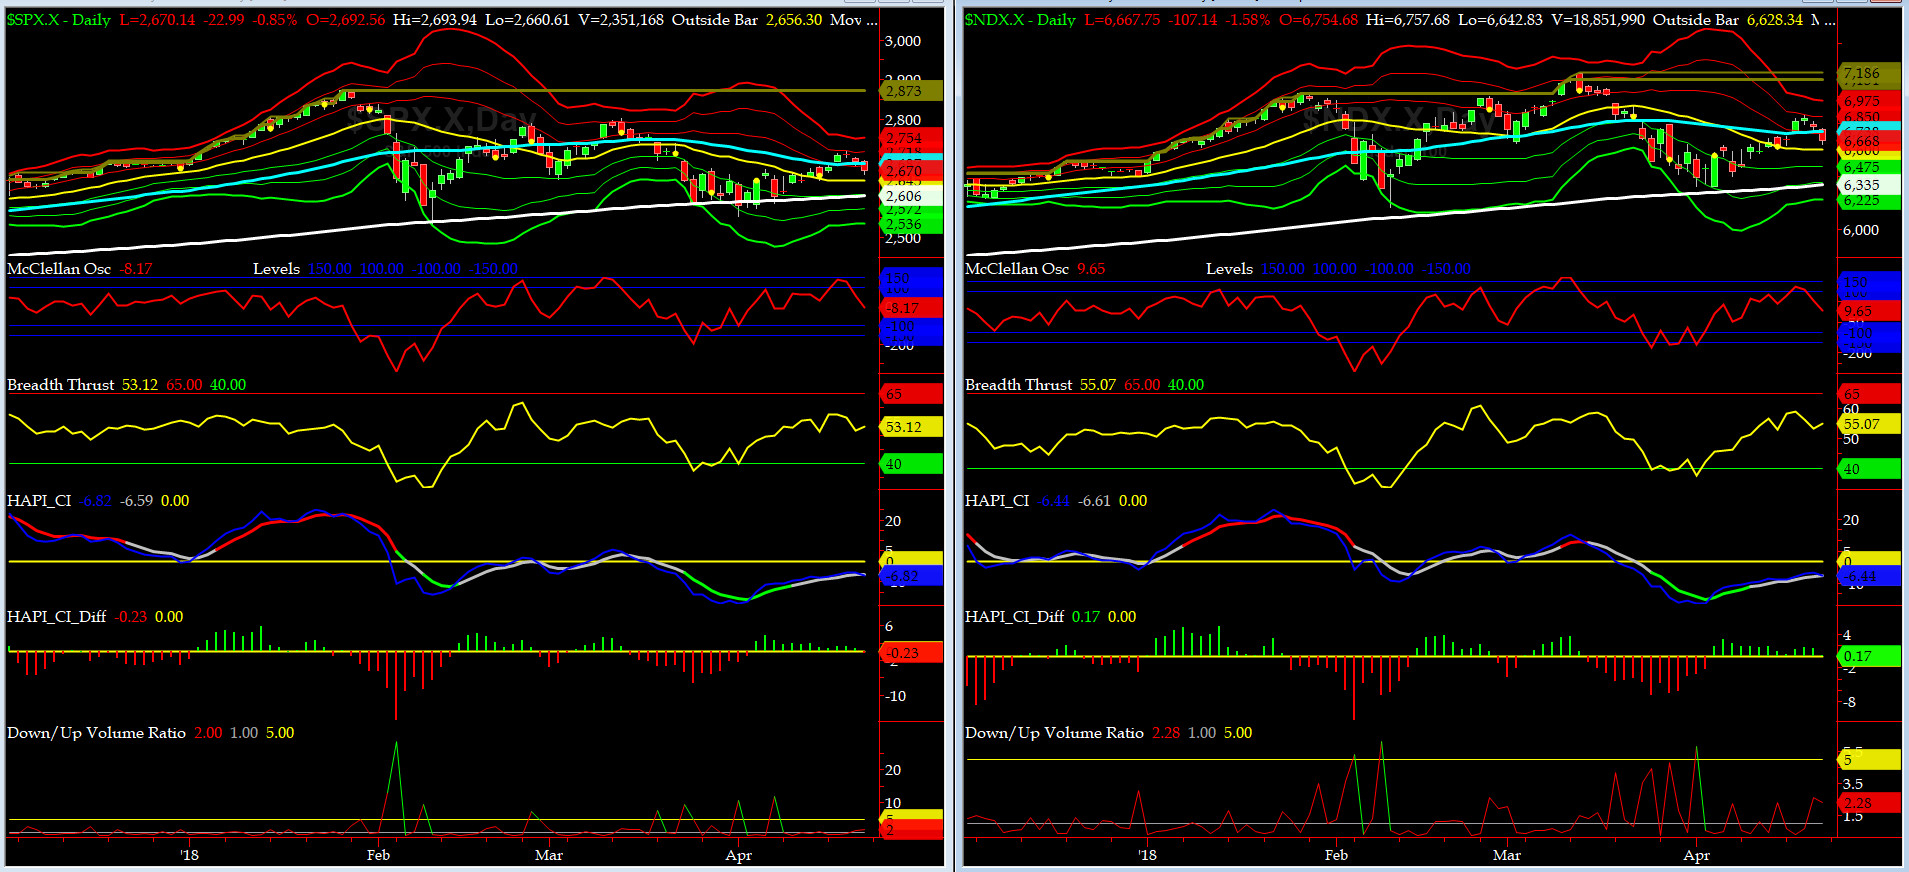
Most recent S&P-500 Cash Index (SPX): 2670.14 up +65.67 (up +2.5%) for the week ending on Friday, April 20, 2018, which closed just above its zero sigma.
SPX ALL TIME INTRADAY HIGH = 2872.87 (reached on Friday, Jan 26, 2018)
SPX ALL TIME CLOSING HIGH = 2872.87 (reached on Friday, Jan 26, 2018)
Current DAILY +2 Sigma SPX = 2718 with WEEKLY +2 Sigma = 2853
Current DAILY 0 Sigma (20 day MA) SPX = 2645 with WEEKLY 0 Sigma = 2707
Current DAILY -2 Sigma SPX = 2572 with WEEKLY -2 Sigma = 2562
NYSE McClellan Oscillator = -8 (-150 is start of the O/S area; around -275 to -300 area or lower, we go into the �launch-pad� mode, over +150, we are in O/B area)
NYSE Breadth Thrust = 53.1 (40 is considered as oversold and 65 as overbought)
This past week, SPX almost touched its +2 sigma and then pulled back. More crucial earnings are ahead this week
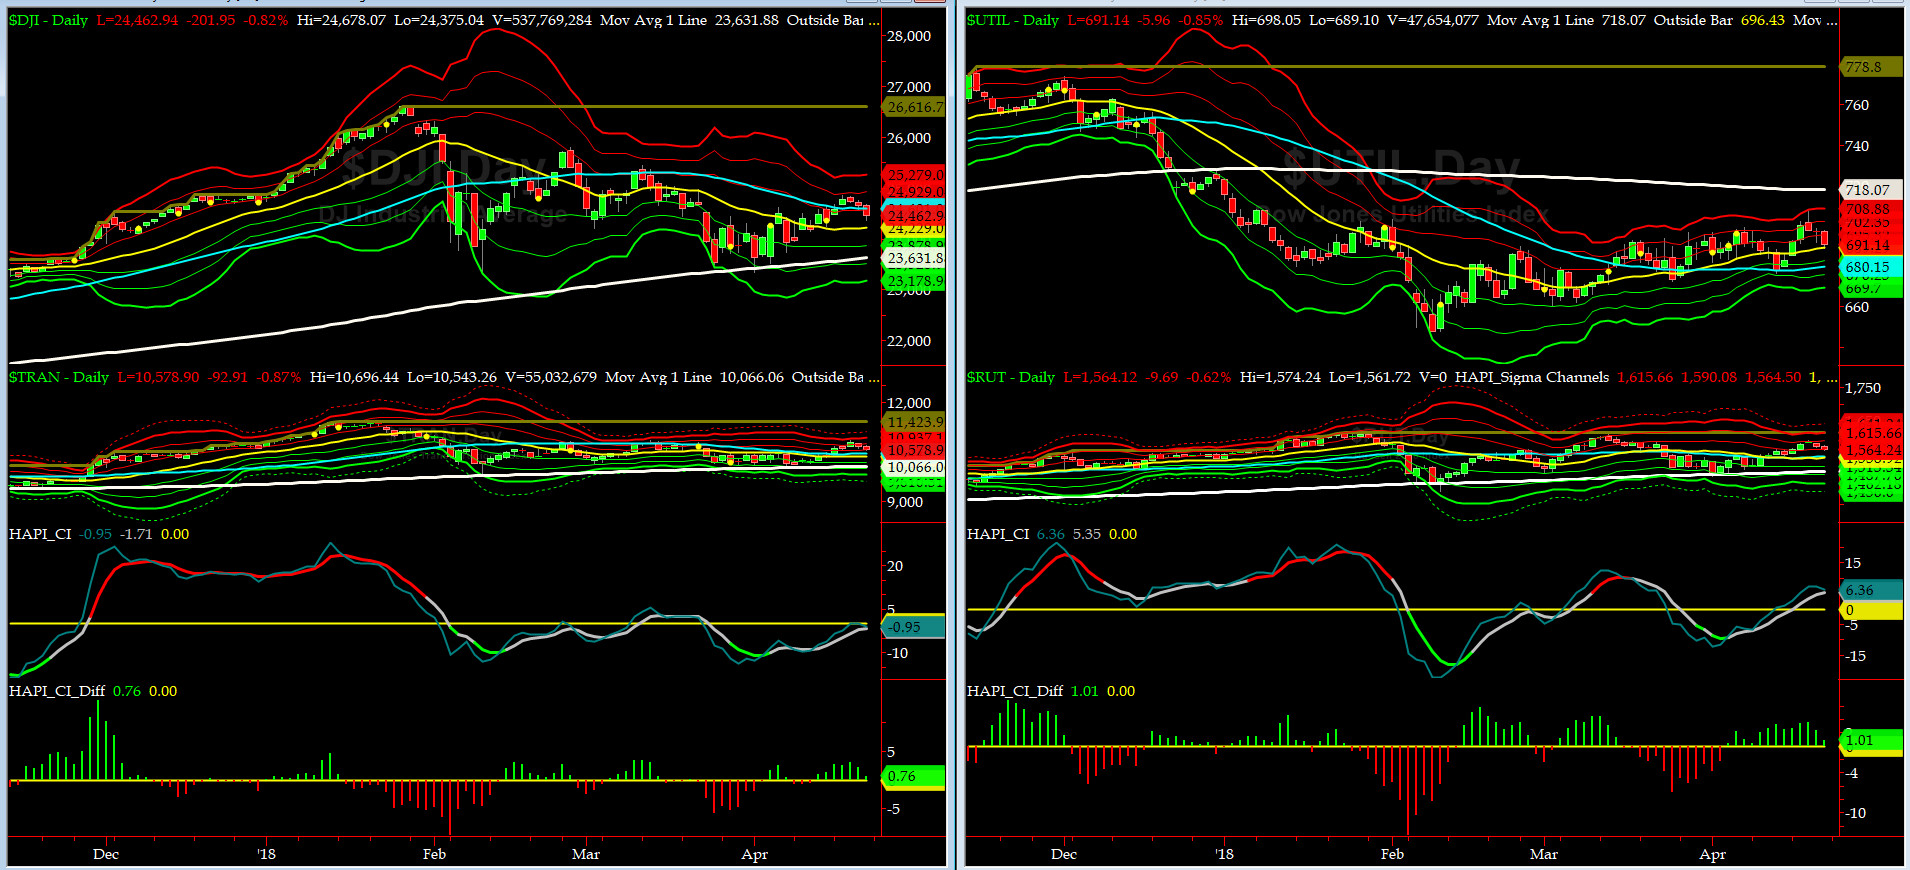
Canaries [in the Coal Mine] Chart for DJ TRAN & RUT Indices
200-Day MA DJ TRAN = 10,066 or 5.1% below DJ TRAN (max observed in last 7 yrs = 20.2%, min = -20.3%)
200-Day MA RUT = 1497 or 4.4% below RUT (max observed in last 7 yrs = 21.3%, min = -22.6%)
DJ Transportation Index (proxy for economic conditions 6 to 9 months hence) had a mixed week but its DTs were closed positive.
Russell 2000 Small Caps Index (proxy for Risk ON/OFF) also had a mixed week.
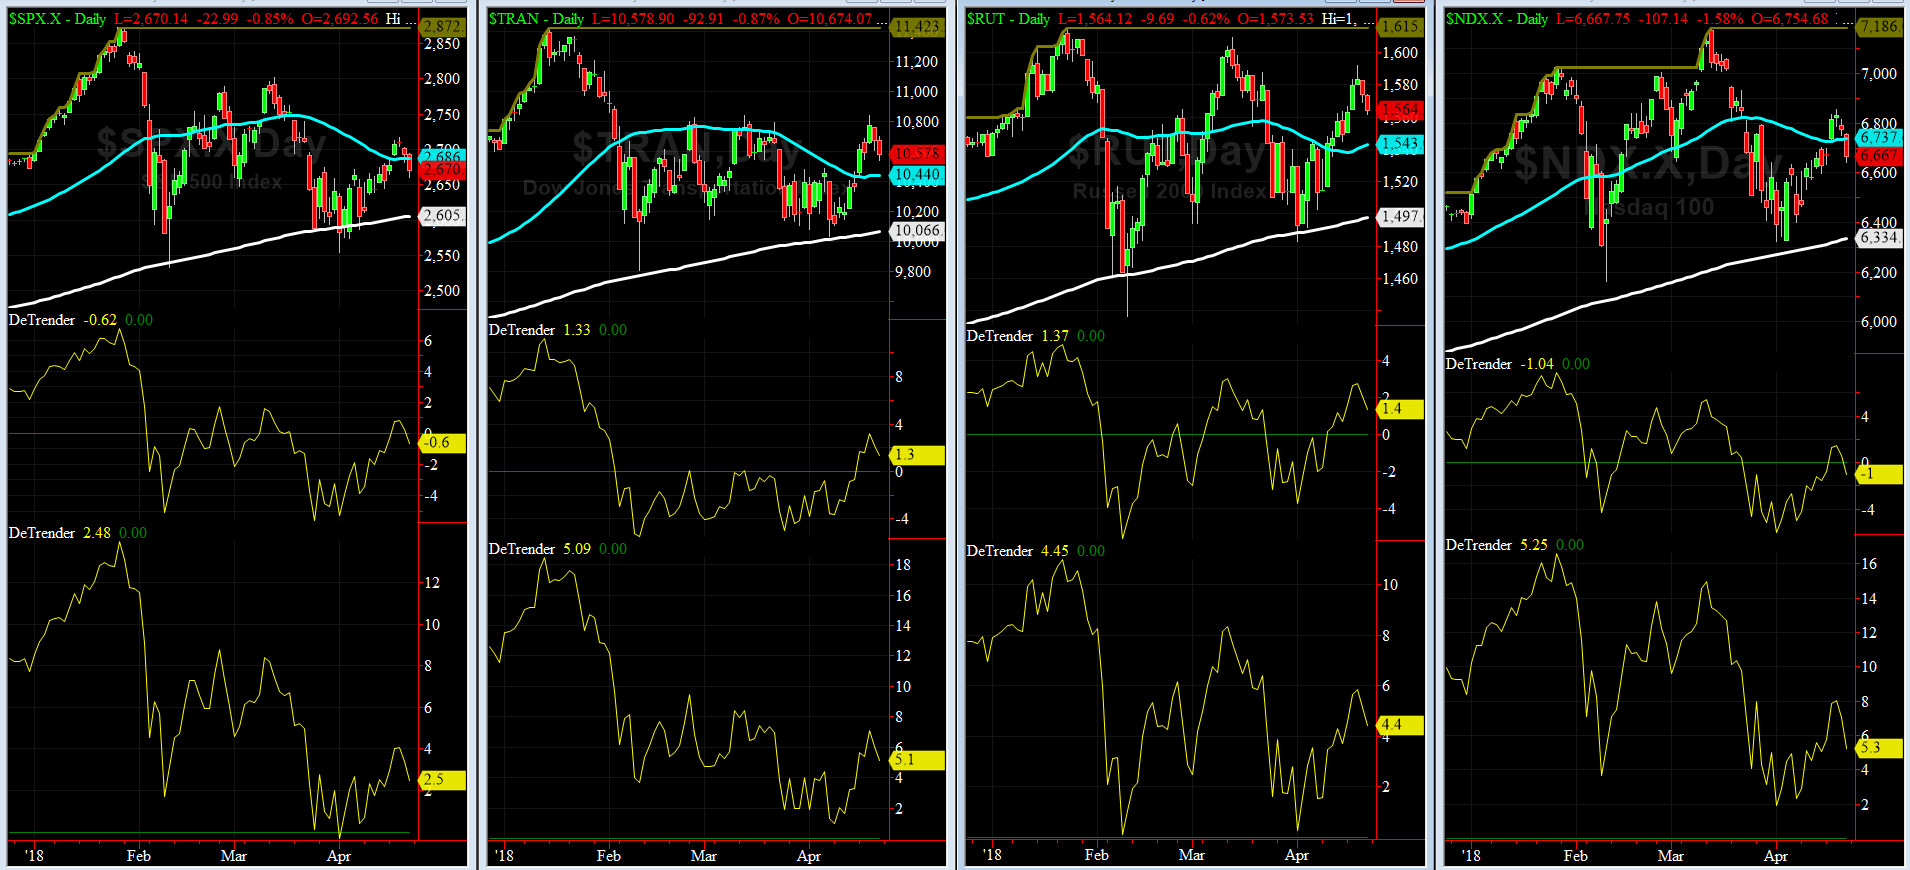
DeTrenders Charts for SPX, NDX, TRAN & RUT Indices
50-Day MA SPX = 2686 or 0.6% above SPX (max observed in last 7 yrs = +8.6%, min = -9.3%)
200-Day MA SPX = 2605 or 2.5% below SPX (max observed in last 7 yrs = 15.2%, min = -14%)
Only TWO of our EIGHT DeTrenders remain in POSITIVE territory. The DeTrenders for DJ Tran & RUT will continue to be harbingers of future price behavior in broad indices.

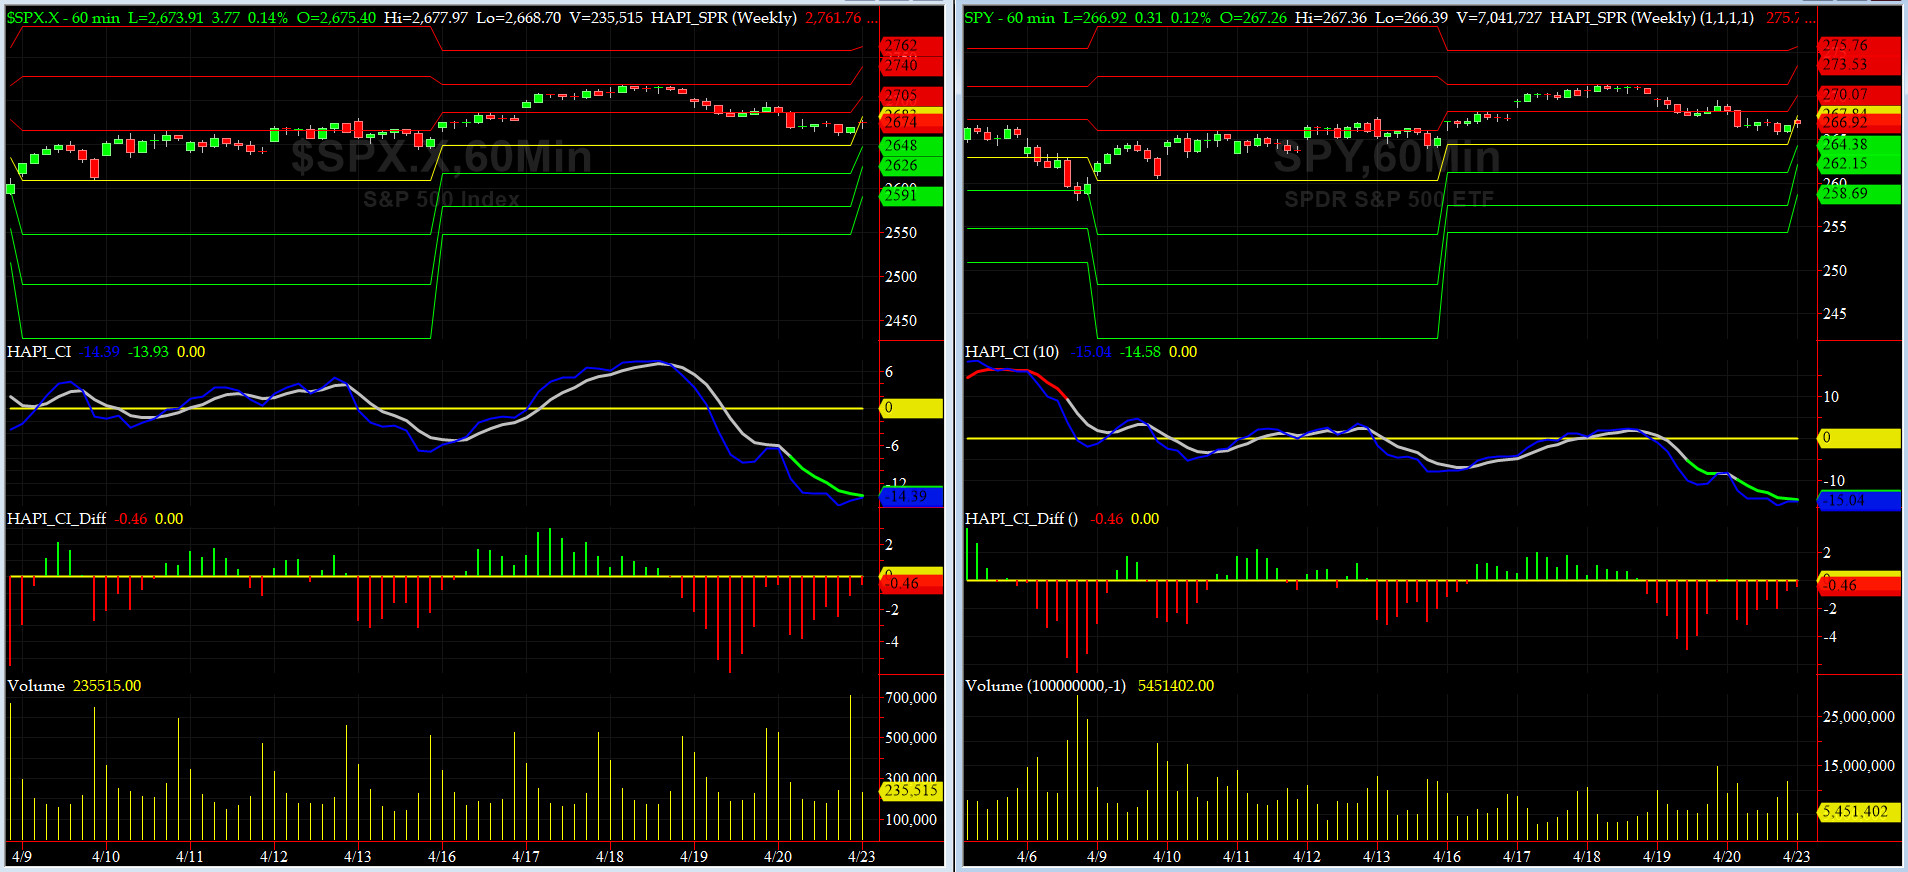
HA_SP1_Momo Chart
WEEKLY Timing Model = on a SELL Signal since Friday 4/06/118 CLOSE at 2604
DAILY Timing Model = on a BUY Signal since Tuesday 4/09/18 CLOSE at 2613
Max SPX 52wk-highs reading last week = 33 (over 120-140, the local maxima is in)
Max SPX 52wk-Lows reading last week = 22 (over 40-60, the local minima is in)
HA_SP1 closed below +1 sigma channels
HA_Momo = -0.54 (reversals most likely occur above +10 or below -10)
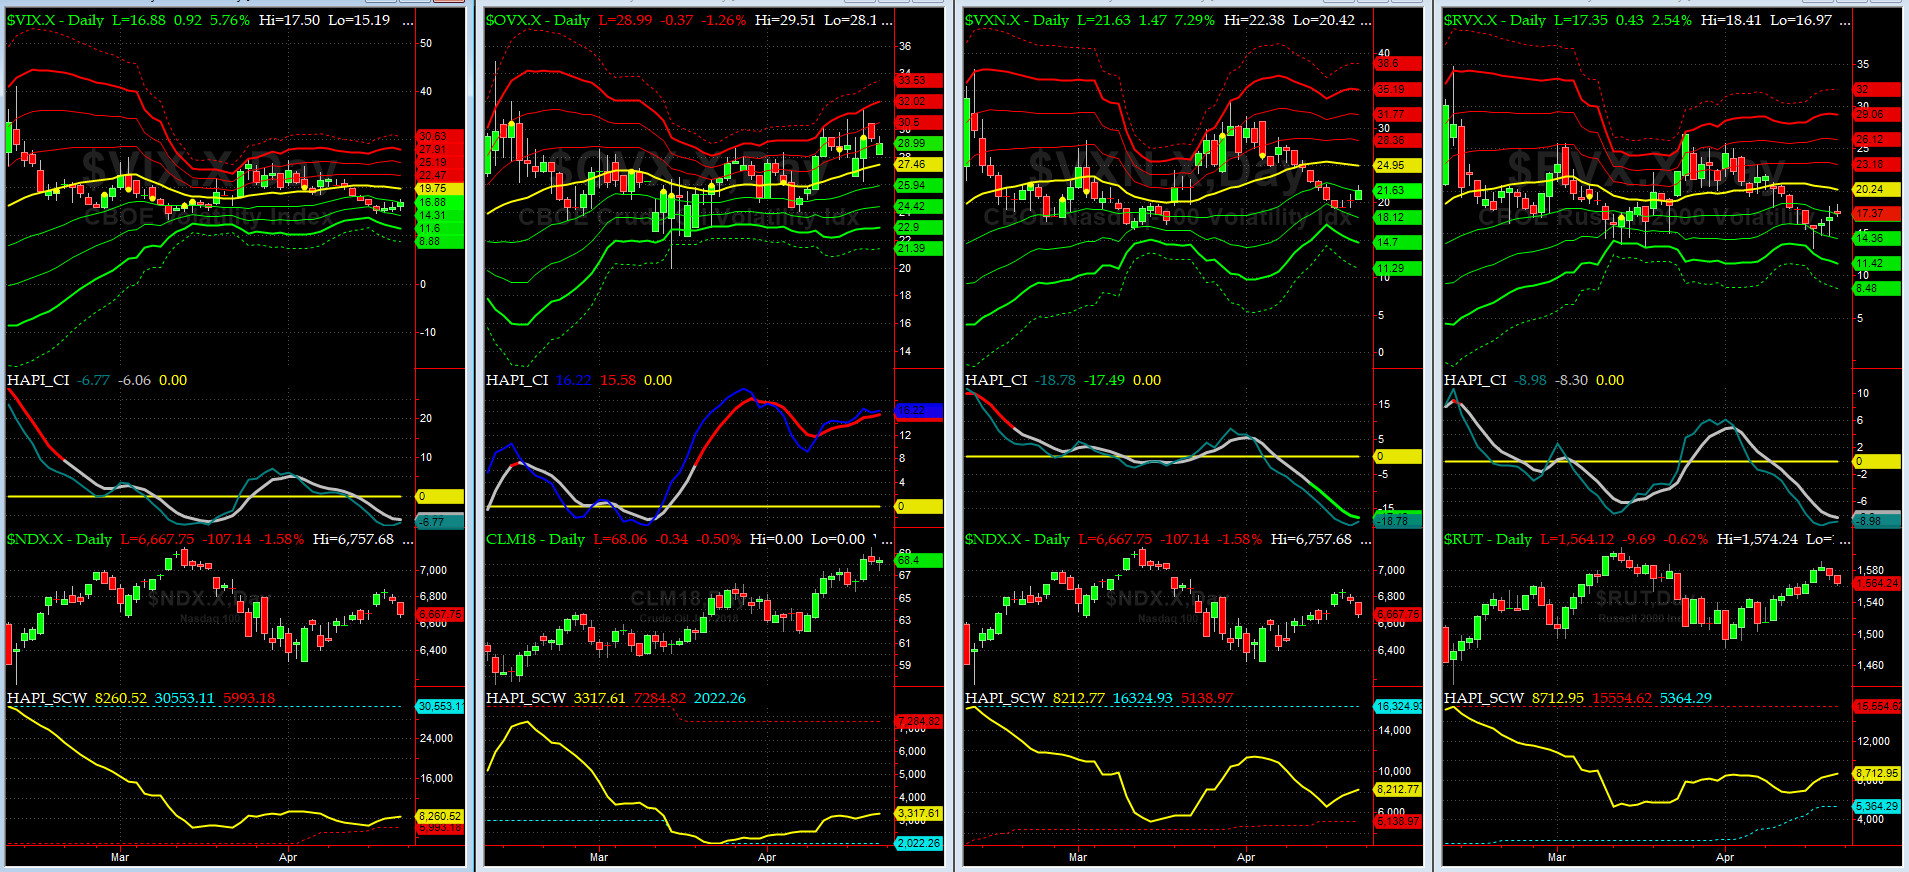
Vol of the Vols Chart
VIX currently stands at 16.88, just above its -1 sigma (remember it's the VIX volatility pattern aka "its sigma channels" that matters, and not the level of VIX itself (this is per Dr. Robert Whaley, a great mentor and inventor of original VIX, now called VXO). VIX usually peaks around a test of its +4 sigma).
This week, VIX Futures are in a mild backwardation. This again says we went thru a trade-able low. Our @Capt_Tiko also responds in the affirmative

5-day TRIN & TRINQ Charts
NYSE 5-day TRIN is near its SELL Zone while NASDAQ's is moving back into NEUTRAL zone.
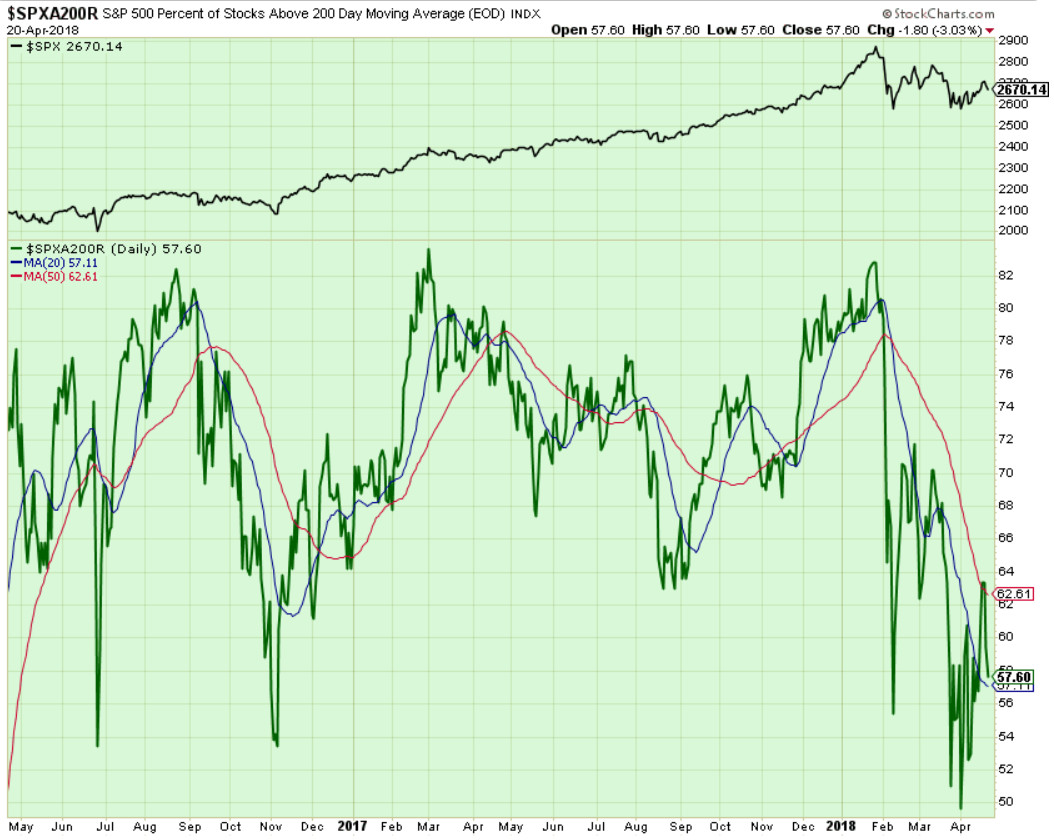
Components of SPX above their respective 200day MA Chart
This scoring indicator rallied to 62% on Wednesday and they got crushed and fell to 57% by Friday close. A breach below 55% this week is not good, and it's very bad below 50%. stay tuned sailors.
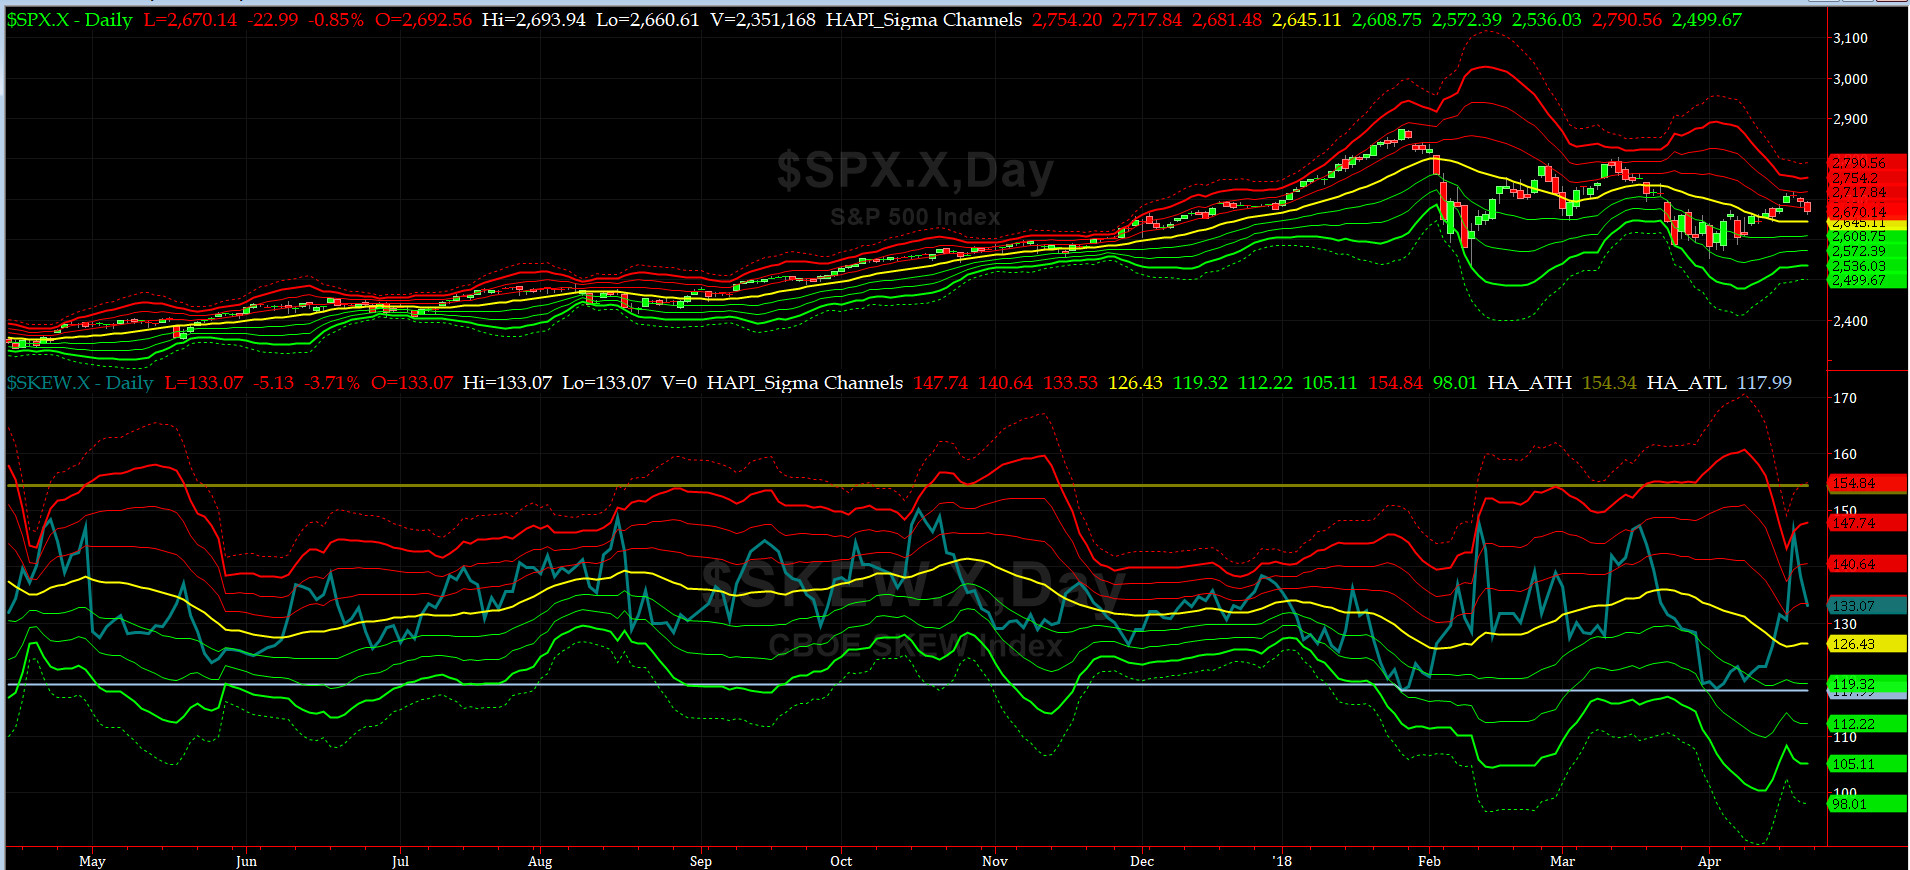
SPX SKEW (Tail Risk) Chart
Last week SPX SKEW (Tail Risk) closed at 133, or near its +1 sigma (normal = 120-125, range 100-150).
Is all quiet on the Eastern & Mid-Western Fronts? Smart Money says YES now but two days when SKEW was at 147, smart money was getting nervous again.
How to interpret the value of SPX SKEW? (from CBOE white paper on SKEW)

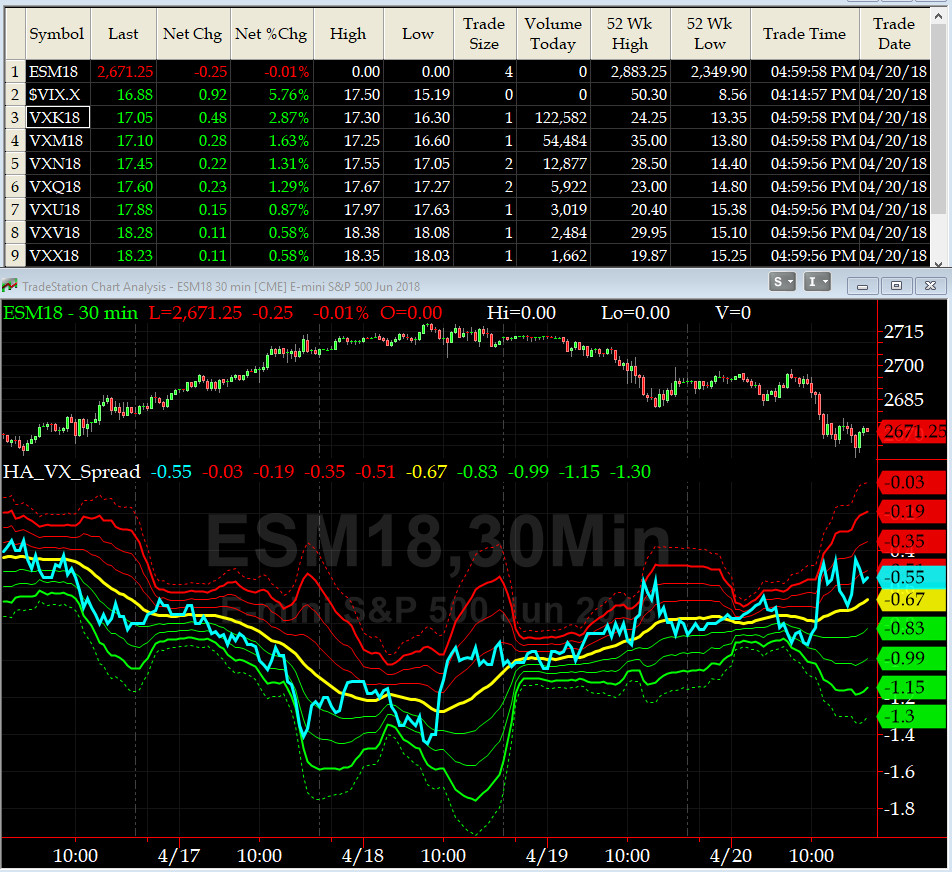
3-month VIX Futures Spread(VX) Chart
This popular timing indicator, now long May, and short August VIX Futures near -0.55. Is the bottom in? @Capt_Tiko shouts YES.
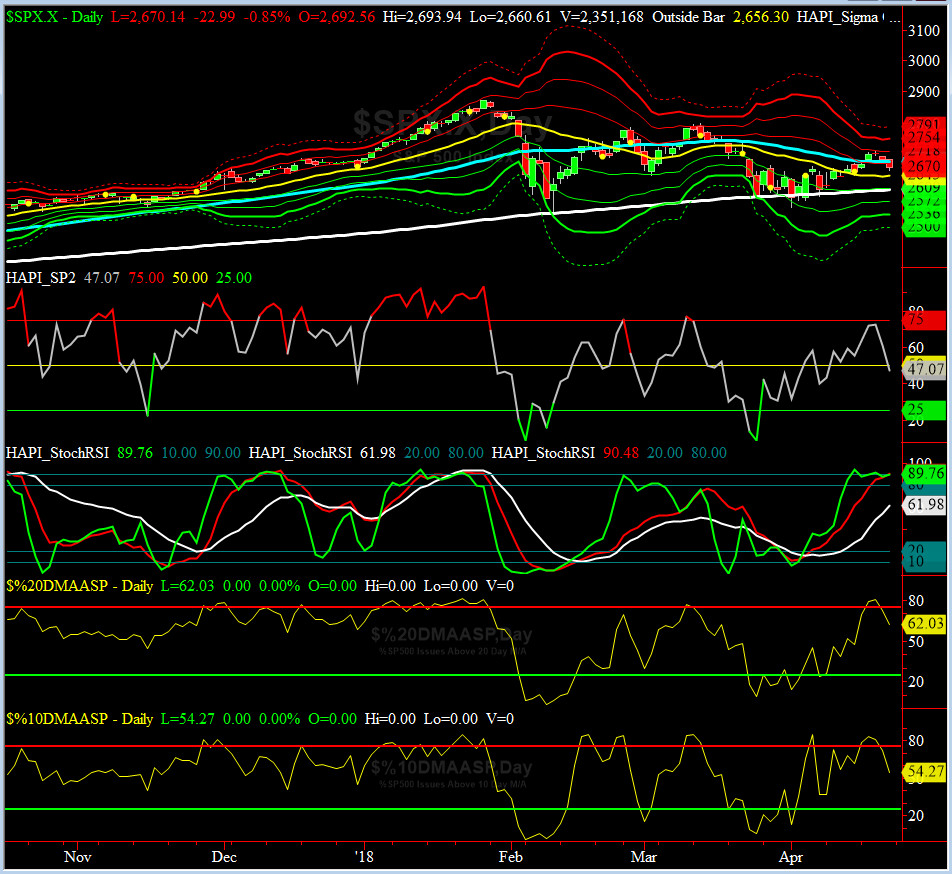
HA_SP2 Chart
HA_SP2 = 47 (Buy signal <= 25, Sell Signal >= 75)
This coveted prop indicator ran up to 72 by Wednesday before falling to 47 by Friday Close. Also worth noting is the updated pattern of 3 timeframe Stoch_RSIs. Looking to recompute/recaliberate our bias once all three are above 80% mark.
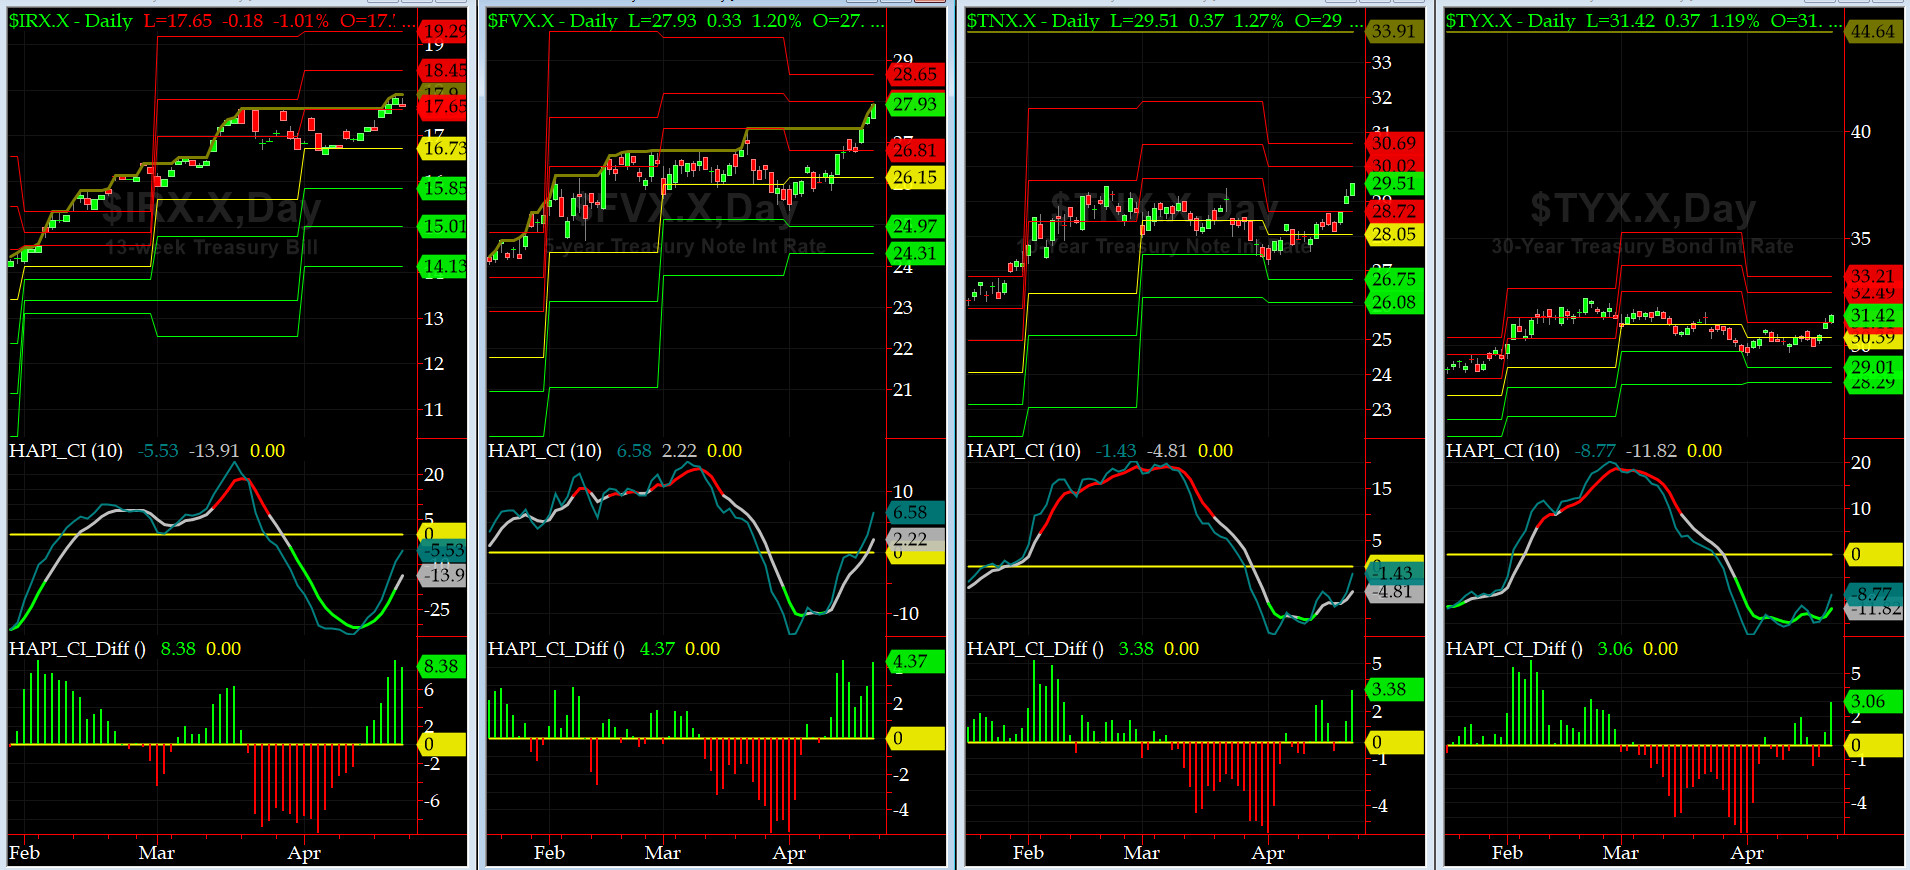
US Treasury T-Notes & T-Bonds Yields Chart
Our beloved Maury, has kept his dancing shoes on as Treasury Complex takes it in the chin, big time (specially look at 5 (leasing) & 10 yr (mortgages)). Maybe the broken covenant with net savors will revive soon (but then we will bust the Fed Budget big time if Grumpino goes ahead with his trade wars).
Fari Hamzei
|


 Proactive Market Timing