|
Monday, April 30, 2018, 2330ET
Market Timing Charts, Analysis & Commentary for Issue #238
Timer Charts of S&P-500 Cash Index (SPX) + NASDAQ-100 Cash Index (NDX)
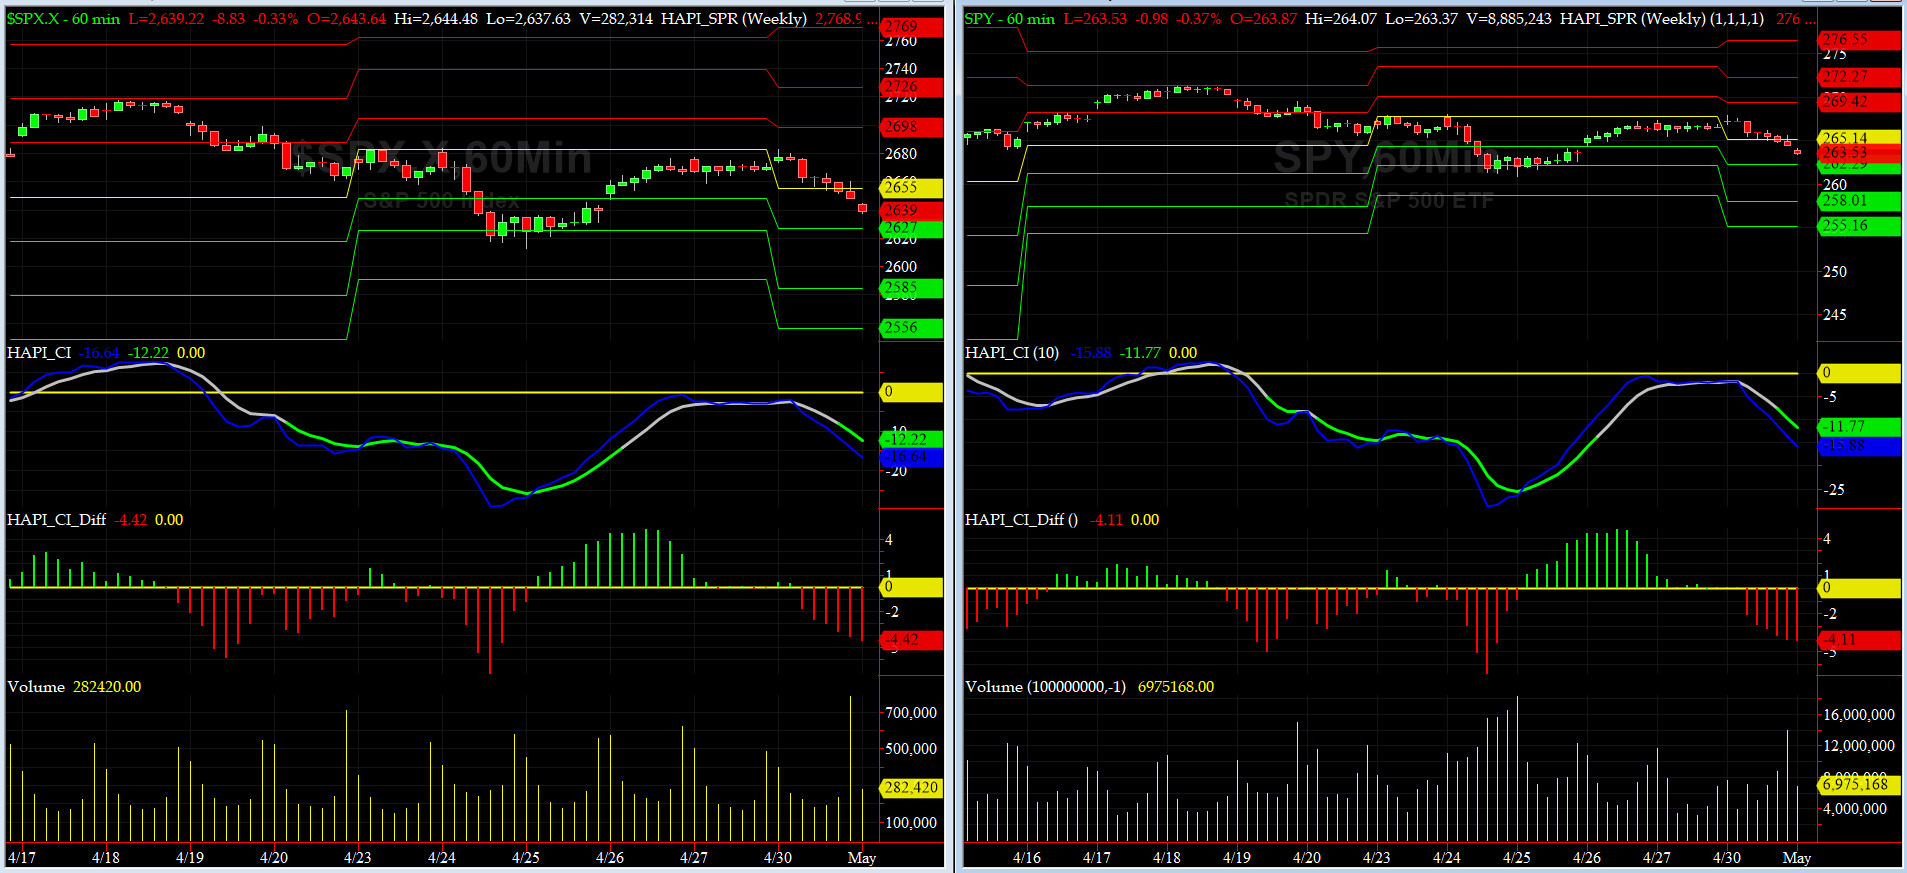
Most recent S&P-500 Cash Index (SPX): 2648.05 down -22.09.67 (down -0.83%) for the six trading days ending on Monday, April 30, 2018, which closed just below its zero sigma.
SPX ALL TIME INTRADAY HIGH = 2872.87 (reached on Friday, Jan 26, 2018)
SPX ALL TIME CLOSING HIGH = 2872.87 (reached on Friday, Jan 26, 2018)
Current DAILY +2 Sigma SPX = 2713 with WEEKLY +2 Sigma = 2853
Current DAILY 0 Sigma (20 day MA) SPX = 2648 with WEEKLY 0 Sigma = 2707
Current DAILY -2 Sigma SPX = 2602 with WEEKLY -2 Sigma = 2561
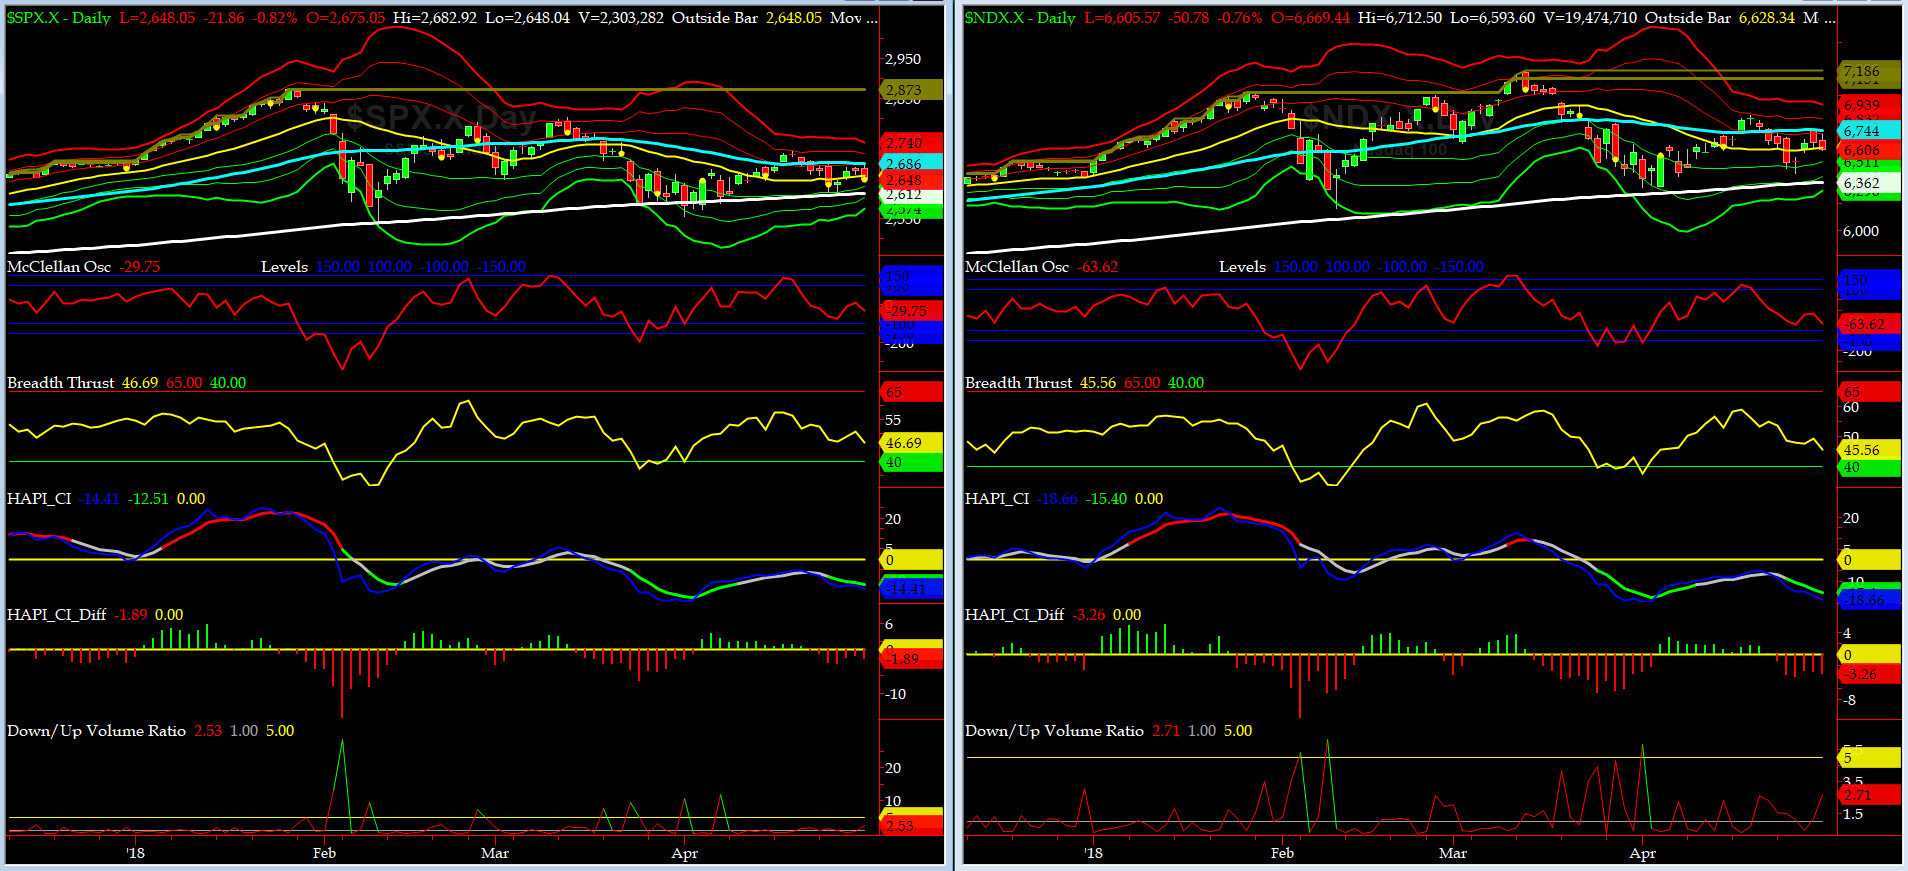
NYSE McClellan Oscillator = -30 (-150 is start of the O/S area; around -275 to -300 area or lower, we go into the �launch-pad� mode, over +150, we are in O/B area)
NYSE Breadth Thrust = 46.7 (40 is considered as oversold and 65 as overbought)
Last Tuesday was a rough day for the LONGs. The rest of the days were tight range days till today. We need to see a close above 50day MA (2686) for us to get more excited about the upside.
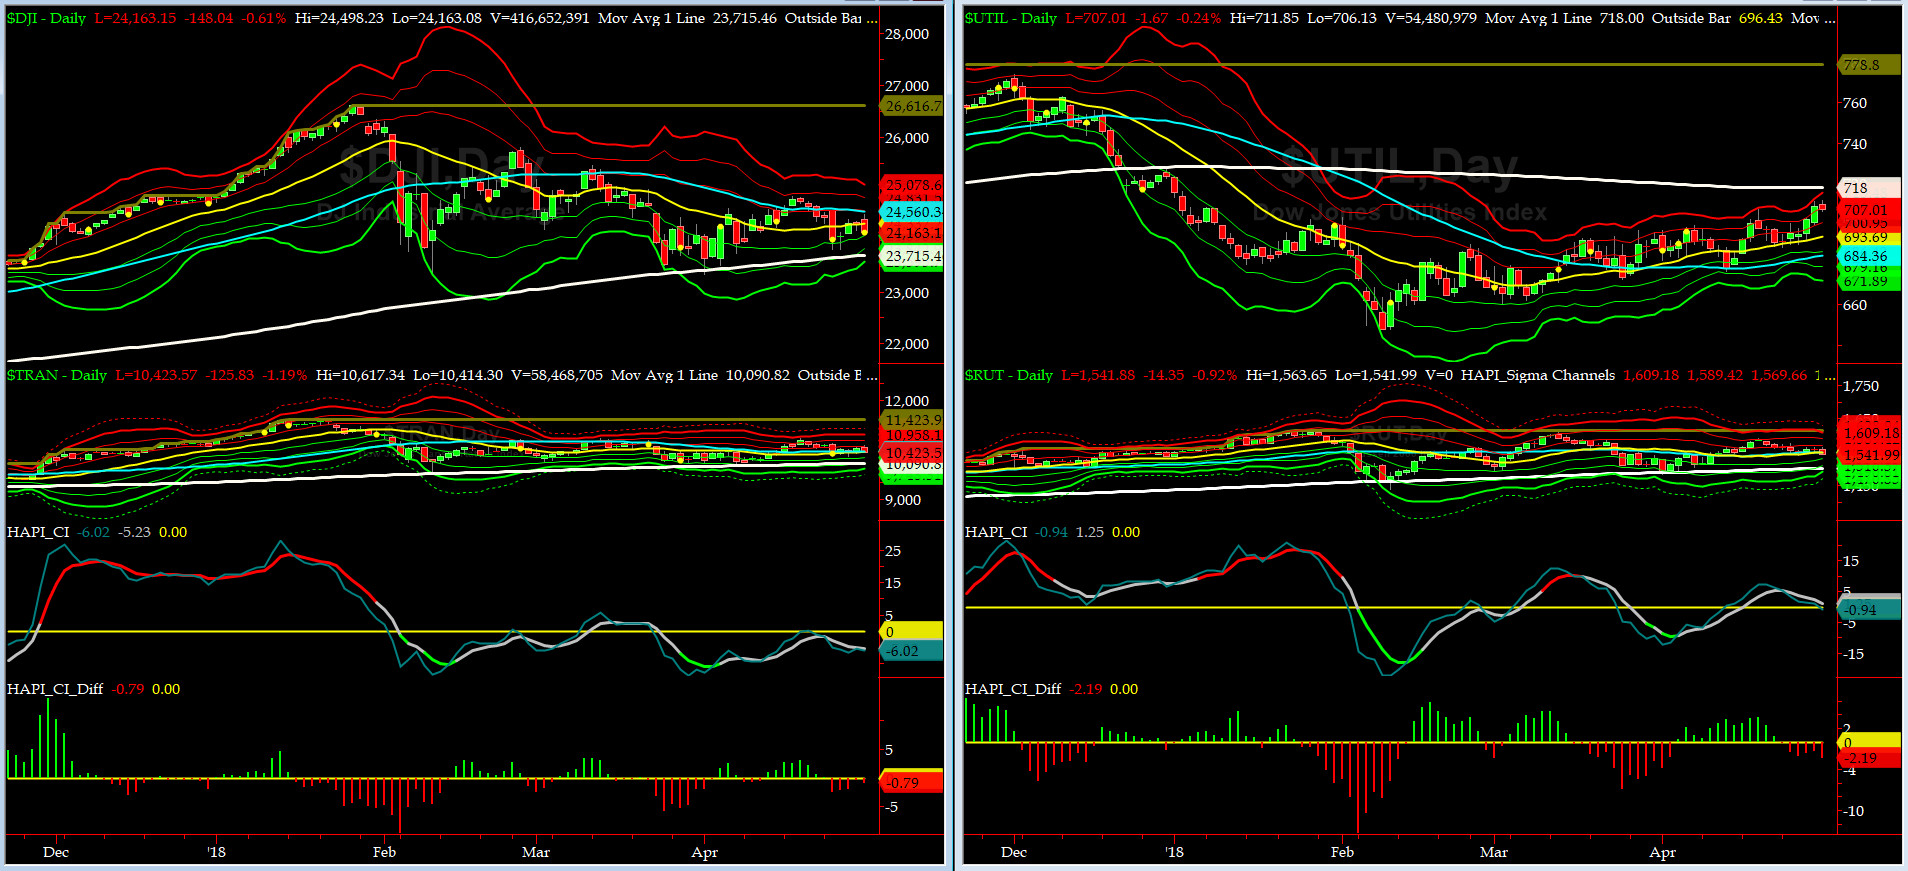
Canaries [in the Coal Mine] Chart for DJ TRAN & RUT Indices
200-Day MA DJ TRAN = 10,090 or 3.3% below DJ TRAN (max observed in last 7 yrs = 20.2%, min = -20.3%)
200-Day MA RUT = 1501 or 2.7% below RUT (max observed in last 7 yrs = 21.3%, min = -22.6%)
DJ Transportation Index (proxy for economic conditions 6 to 9 months hence) sold off a tad but mainly hovered around its 50day MA.
Russell 2000 Small Caps Index (proxy for Risk ON/OFF) also had a mixed week and closed below its 50day MA
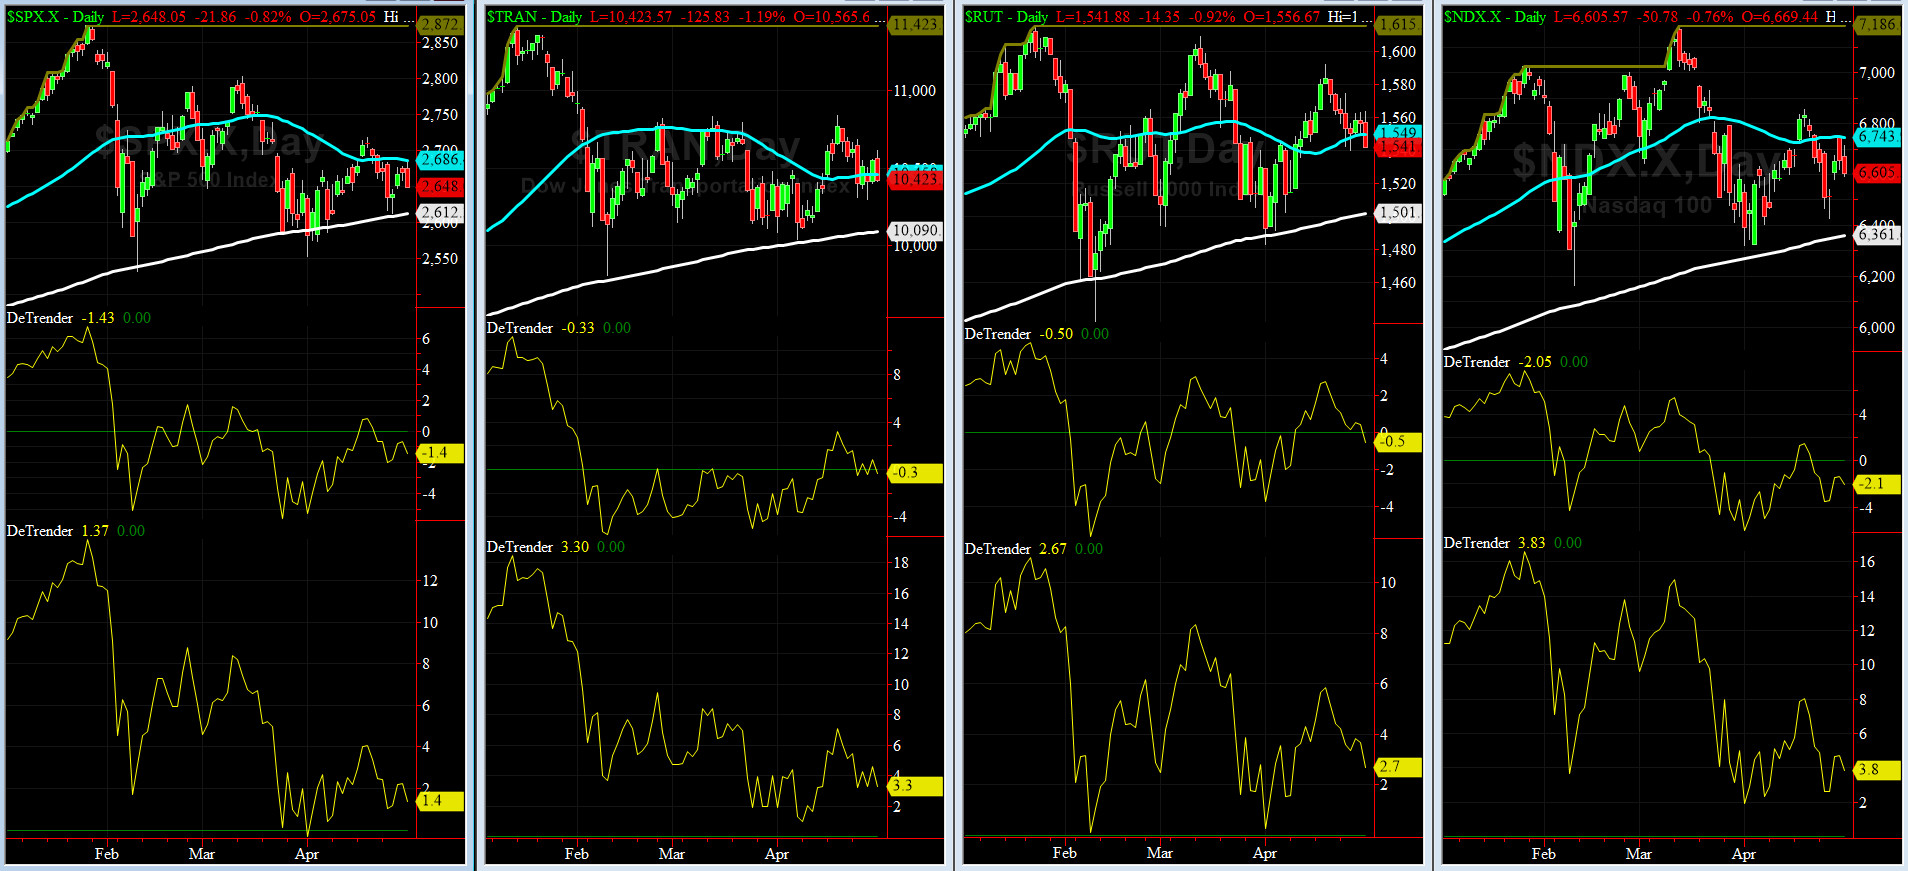
DeTrenders Charts for SPX, NDX, TRAN & RUT Indices
50-Day MA SPX = 2686 or 1.4% above SPX (max observed in last 7 yrs = +8.6%, min = -9.3%)
200-Day MA SPX = 2612 or 1.4% below SPX (max observed in last 7 yrs = 15.2%, min = -14%)
Only THREE of our EIGHT DeTrenders remain in POSITIVE territory. The DeTrenders for DJ Tran & RUT will continue to be harbingers of future price behavior in broad indices.
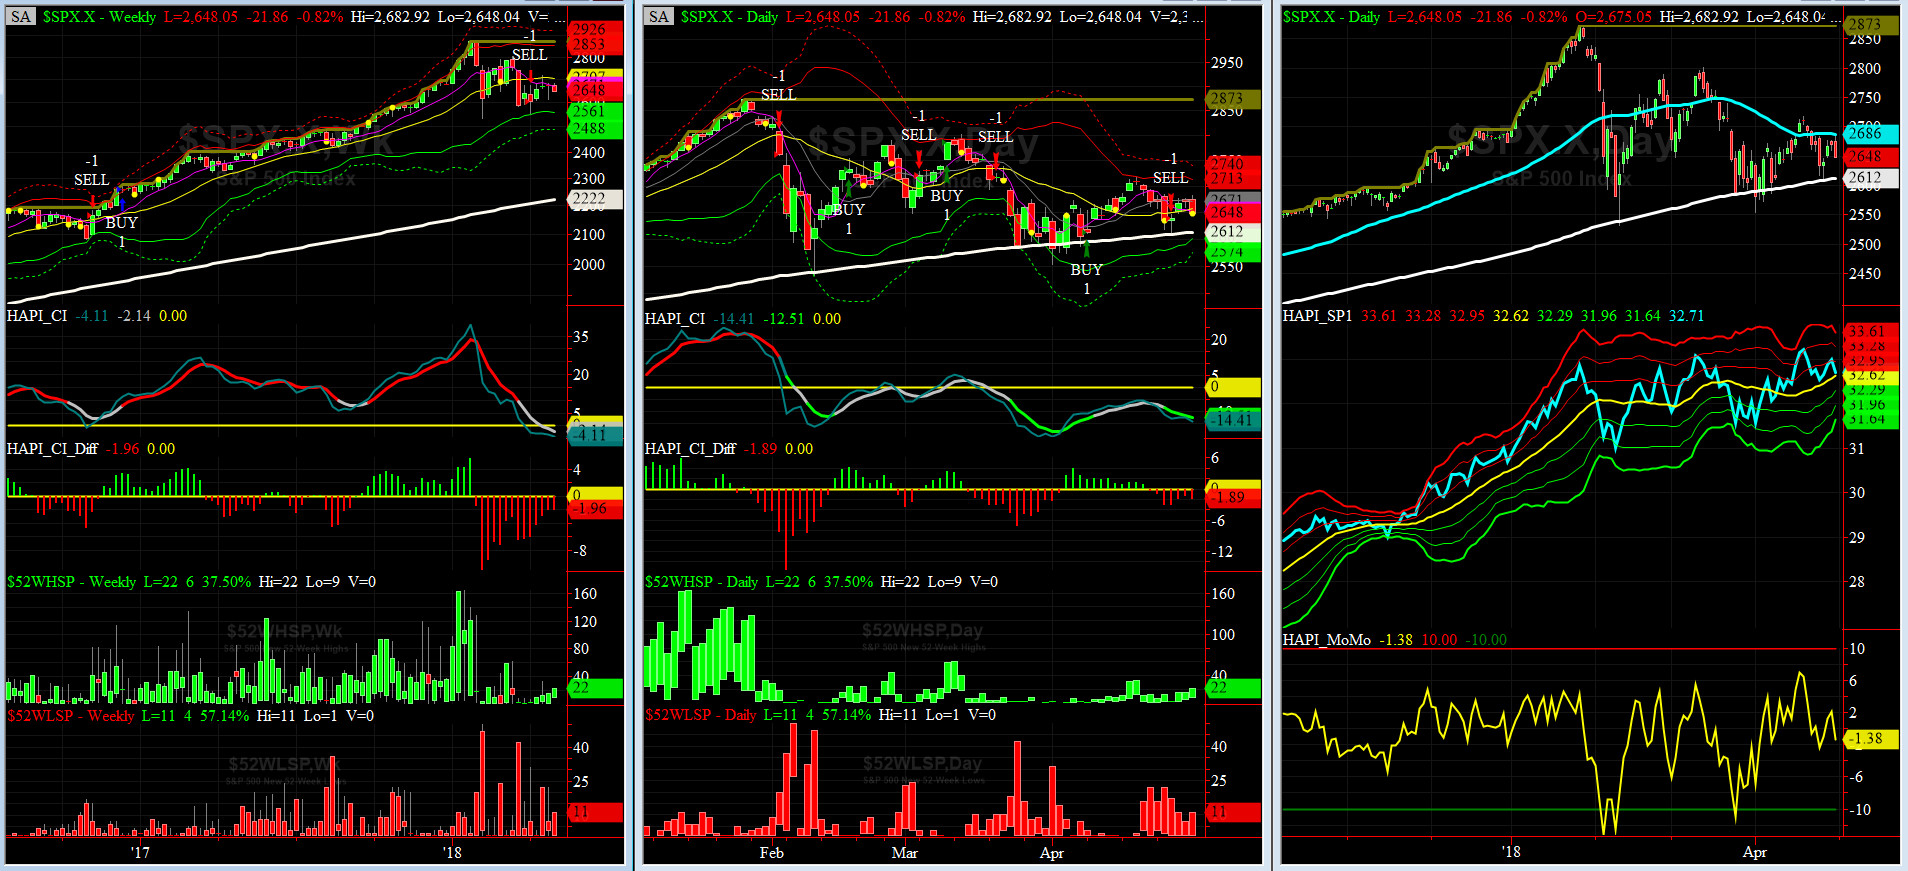
HA_SP1_Momo Chart
WEEKLY Timing Model = on a SELL Signal since Friday 4/06/118 CLOSE at 2604
DAILY Timing Model = on a SELL Signal since Tuesday 4/25/18 CLOSE at 2639
Max SPX 52wk-highs reading last week = 22 (over 120-140, the local maxima is in)
Max SPX 52wk-Lows reading last week = 22 (over 40-60, the local minima is in)
HA_SP1 closed at its zero sigma channels
HA_Momo = -1.38 (reversals most likely occur above +10 or below -10)
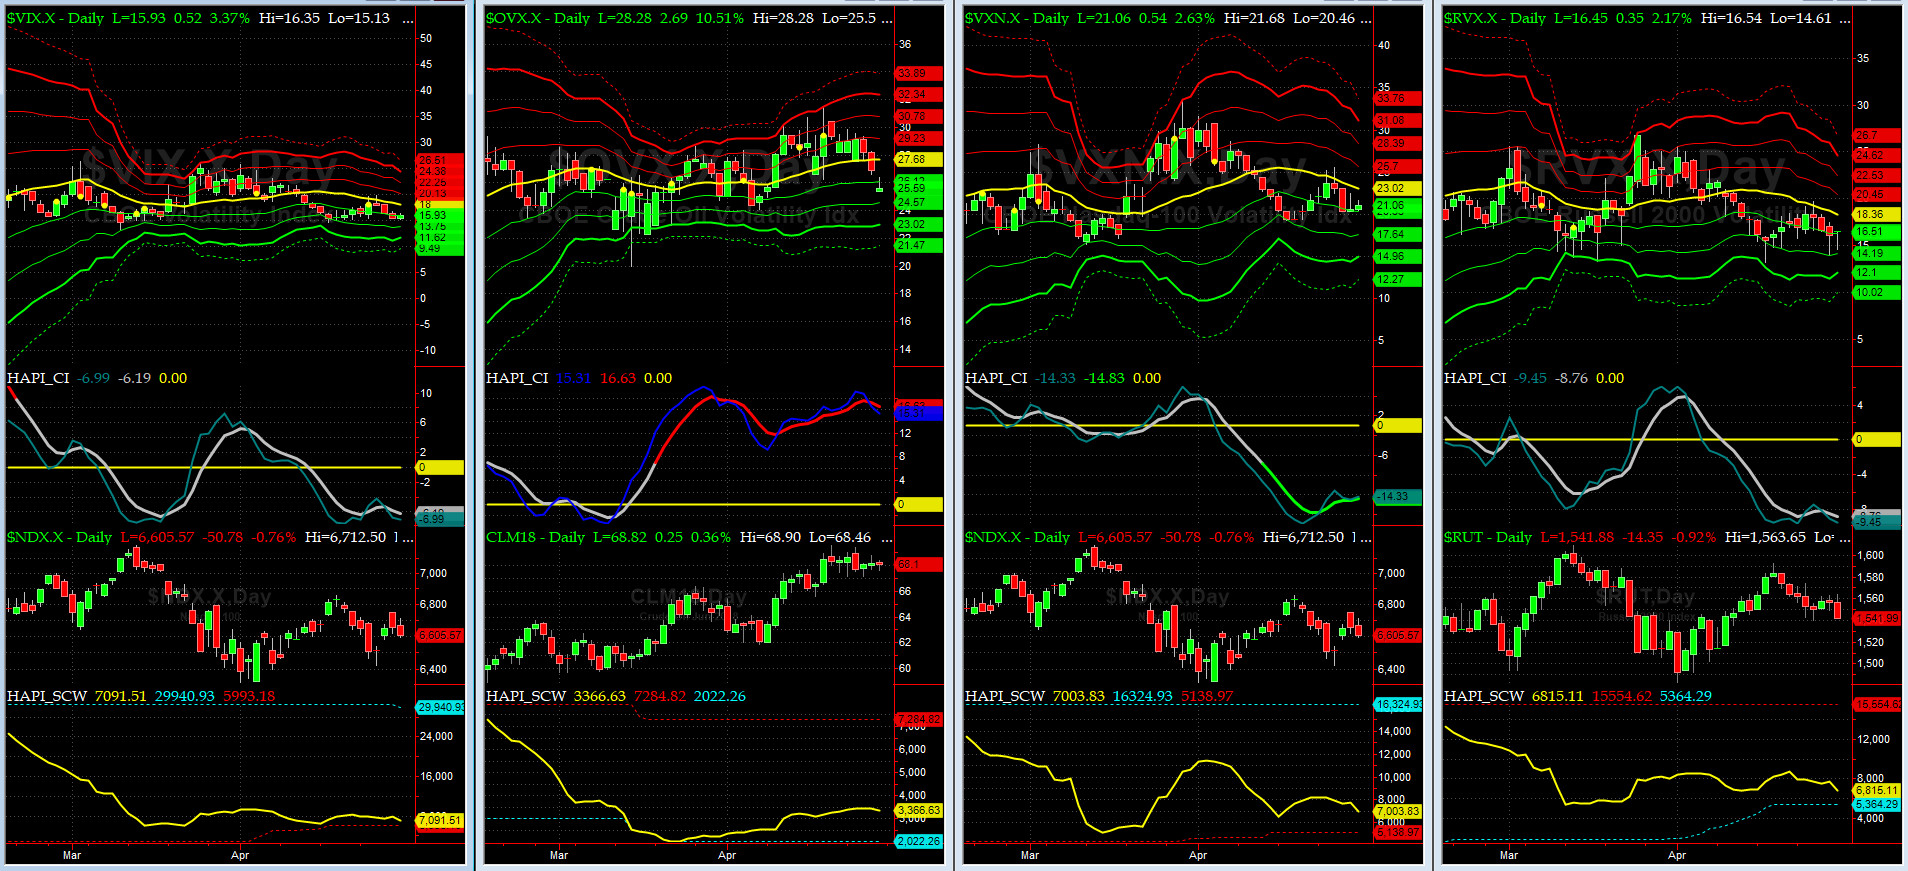
Vol of the Vols Chart
VIX currently stands at 15.93, just about its -1 sigma (remember it's the VIX volatility pattern aka "its sigma channels" that matters, and not the level of VIX itself (this is per Dr. Robert Whaley, a great mentor and inventor of original VIX, now called VXO). VIX usually peaks around a test of its +4 sigma).
Low Vols are back. The qustion is for how long?
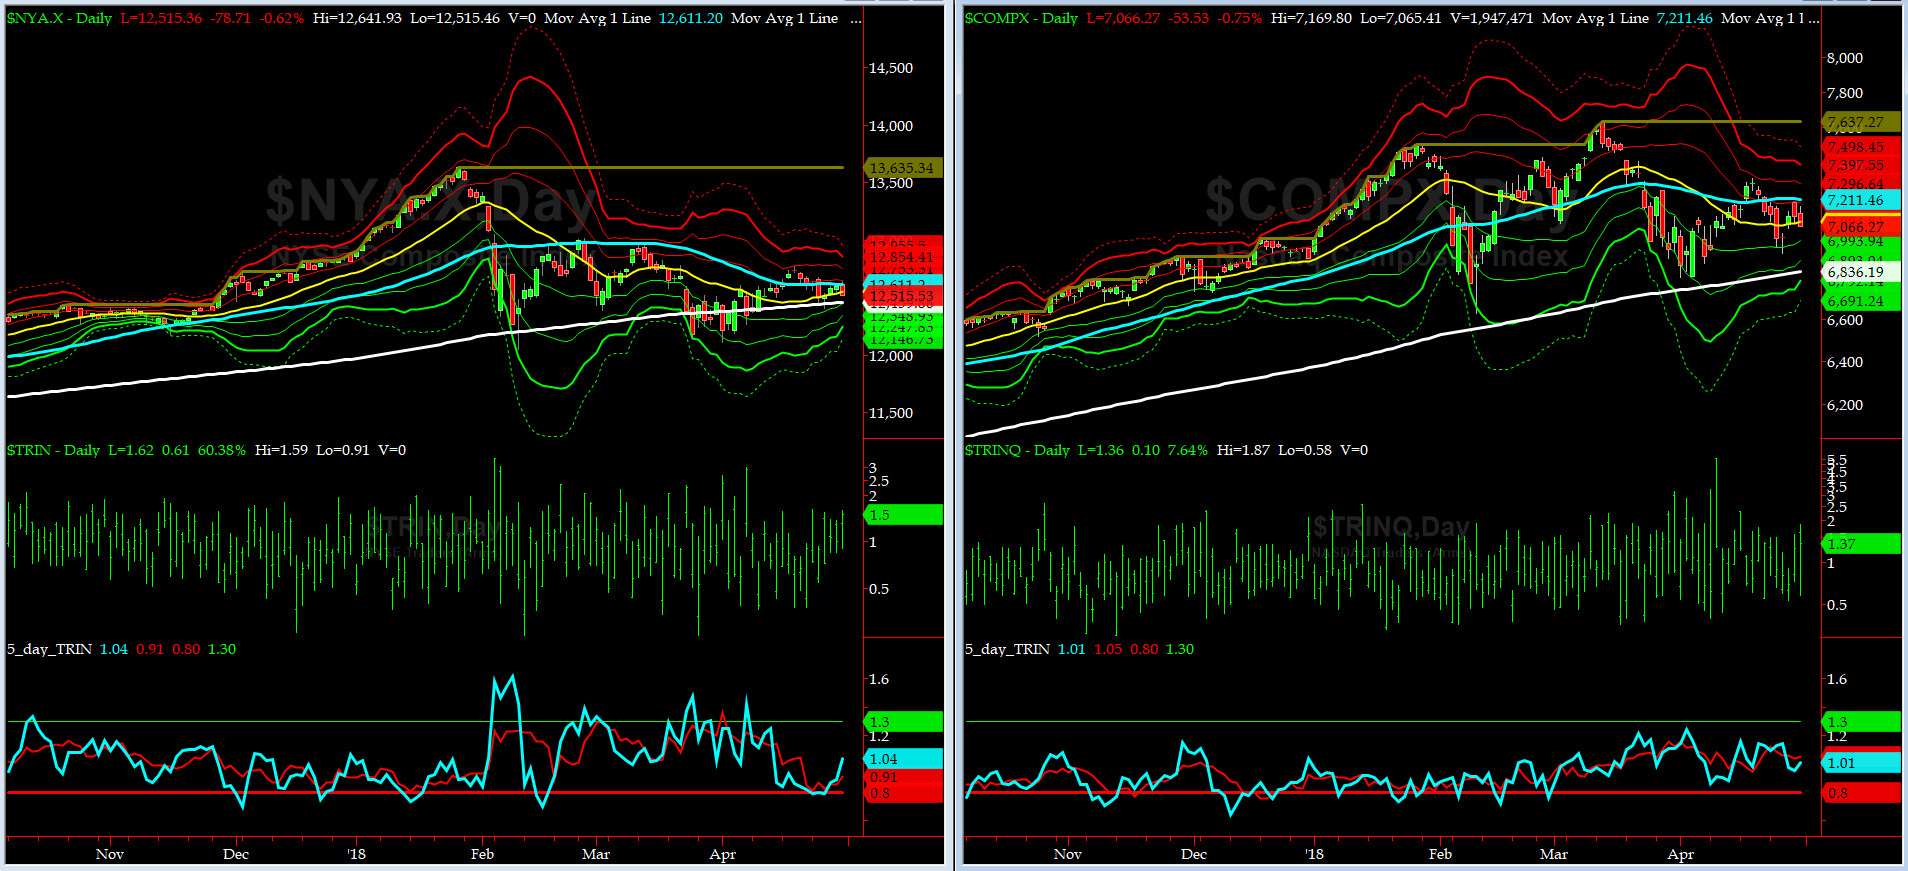
5-day TRIN & TRINQ Charts
Both NYSE & NASDAQ 5-day TRINs are in NEUTRAL zone.
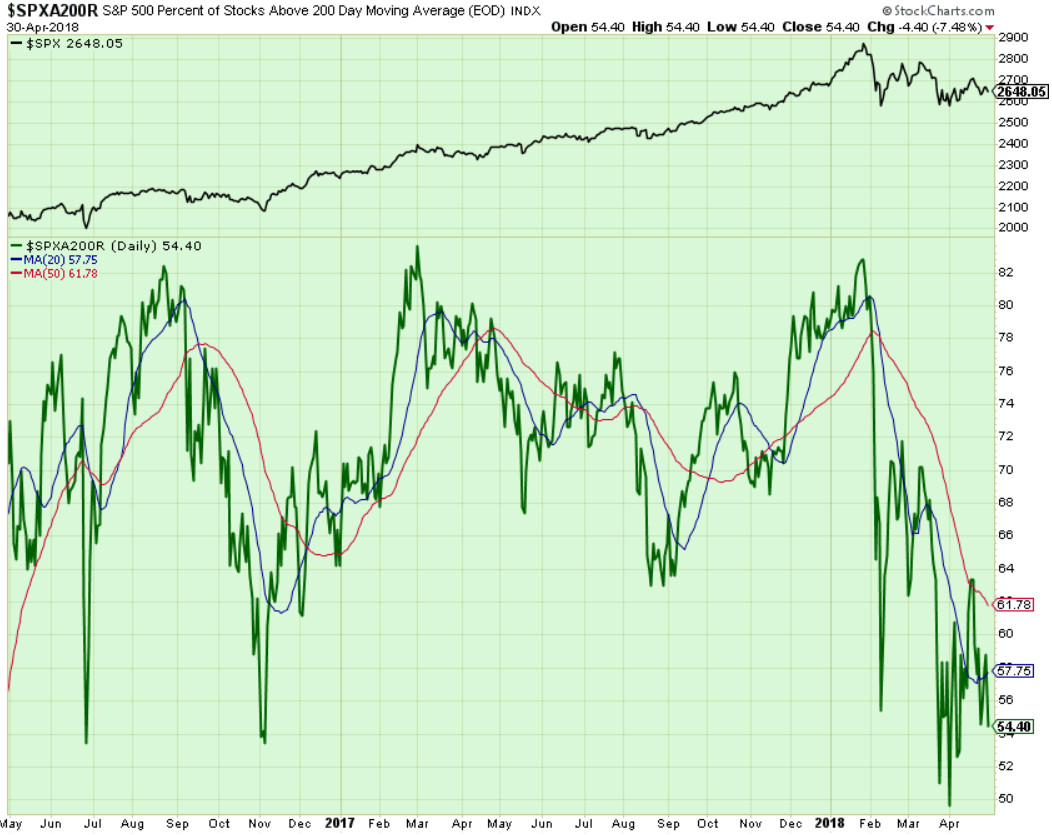
Components of SPX above their respective 200day MA Chart
This scoring indicator rallied to 62% on Wednesday and they got crushed and fell to 57% by Friday close. A breach below 55% this week is not good, and it's very bad below 50%. stay tuned sailors.
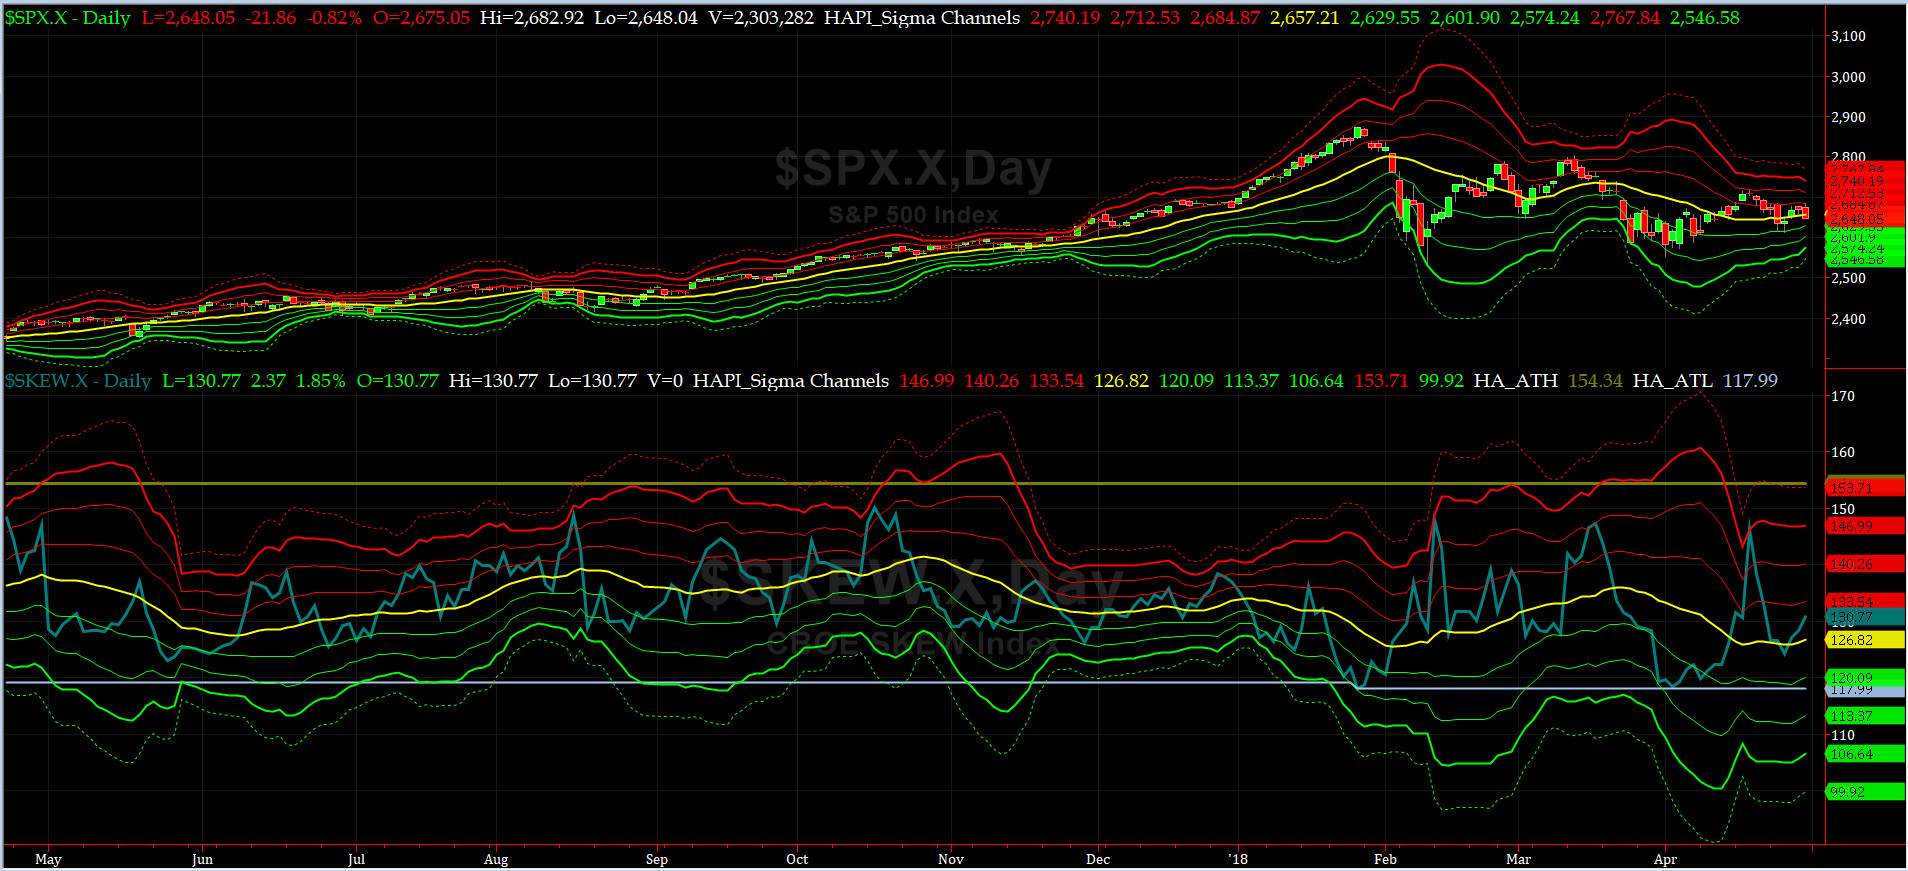
SPX SKEW (Tail Risk) Chart
On Monday, SPX SKEW (Tail Risk) closed near 131, or near its +1 sigma (normal = 120-125, range 100-150).
Is all quiet on the Eastern & Mid-Western Fronts? Smart Money says YES, for now!!
How to interpret the value of SPX SKEW? (from CBOE white paper on SKEW)

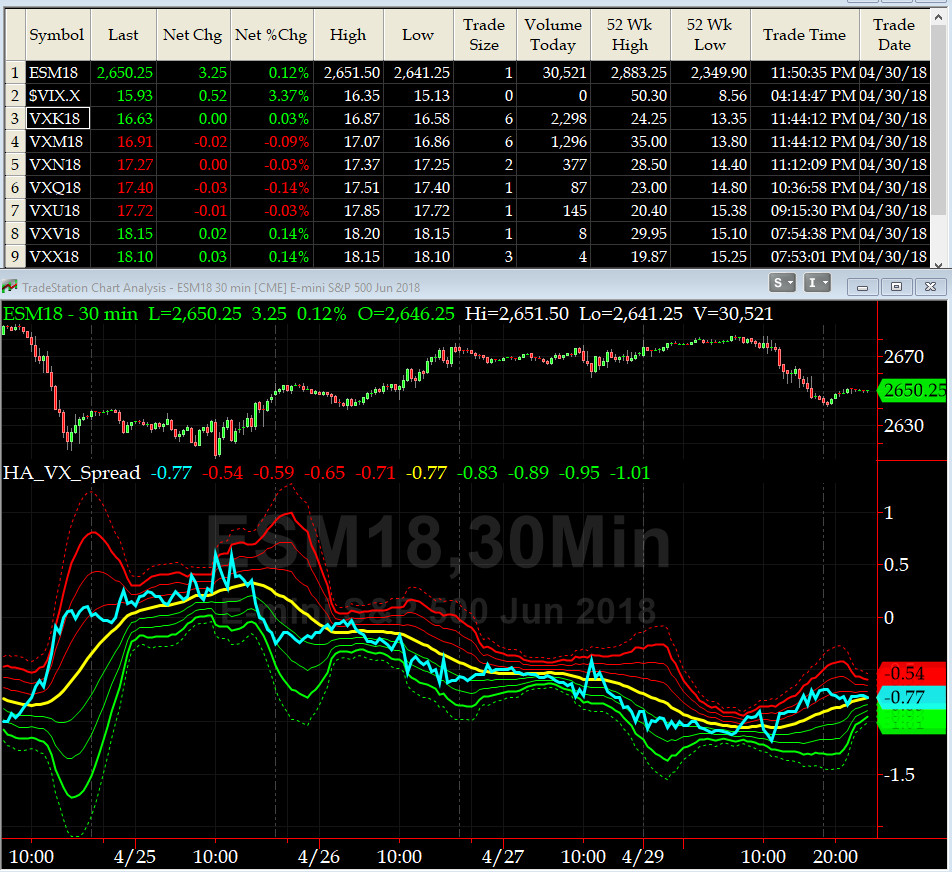
3-month VIX Futures Spread(VX) Chart
This popular timing indicator, now long May, and short August VIX Futures near -0.80. Is the bottom in? Our beloved @Capt_Tiko still thinks YES.
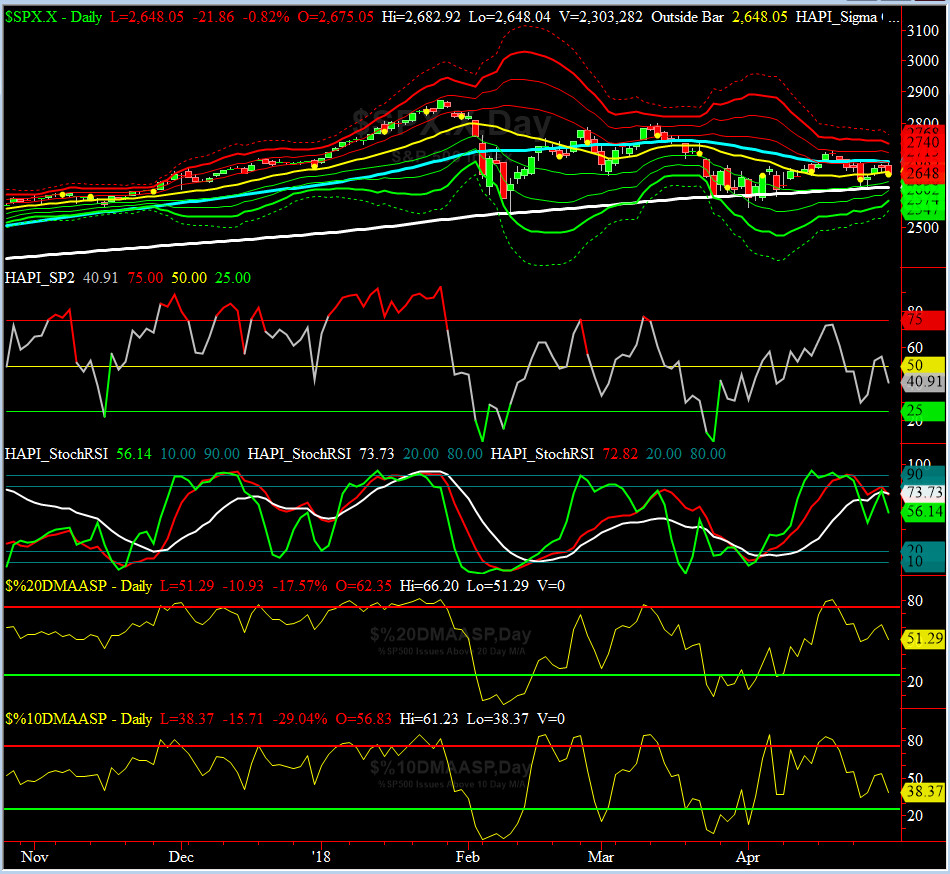
HA_SP2 Chart
HA_SP2 = 40.9 (Buy signal <= 25, Sell Signal >= 75)
This coveted prop indicator put in a lower high this past week. This is of concern to us.

US Treasury T-Notes & T-Bonds Yields Chart
Our beloved Maury, got a bit concern last week as we saw couple of sharo Flight-to-Quality days.
Fari Hamzei
|


 Proactive Market Timing