|
Sunday, May 6, 2018, 1545ET
Market Timing Charts, Analysis & Commentary for Issue #239
Timer Charts of S&P-500 Cash Index (SPX) + NASDAQ-100 Cash Index (NDX)
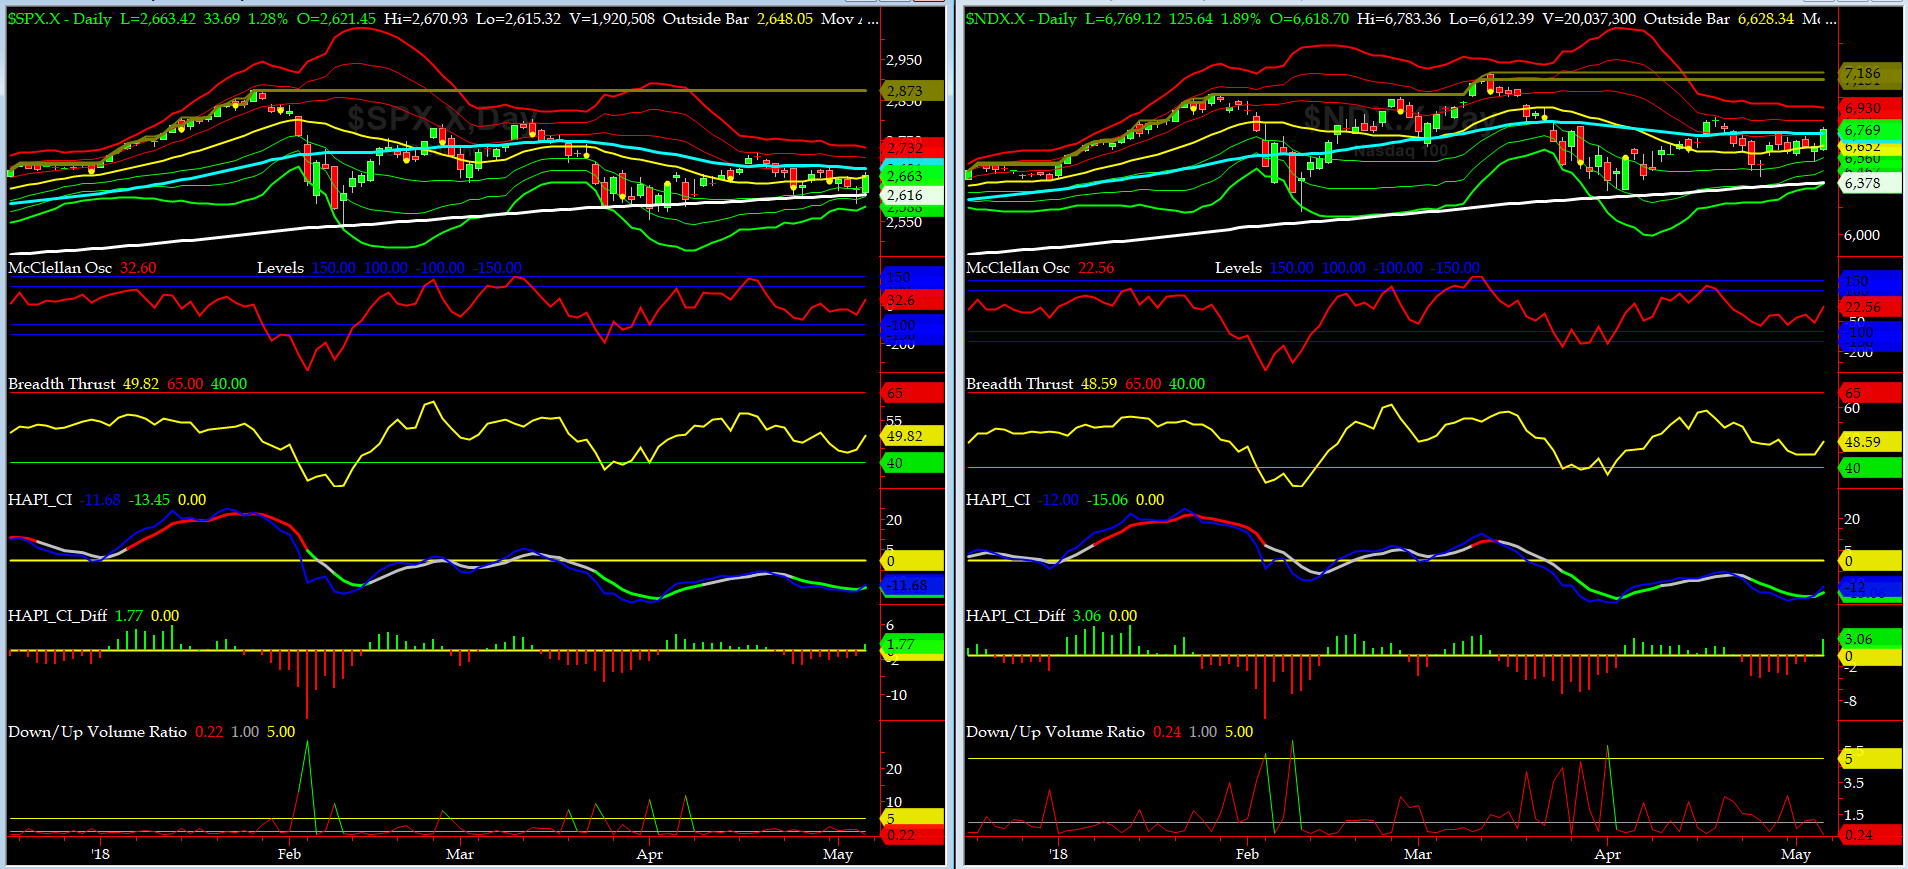
Most recent S&P-500 Cash Index (SPX): 2663.42 up +15.37 (up +0.58%) for the four trading days ending on Friday, May 4, 2018, which closed just below its zero sigma.
SPX ALL TIME INTRADAY HIGH = 2872.87 (reached on Friday, Jan 26, 2018)
SPX ALL TIME CLOSING HIGH = 2872.87 (reached on Friday, Jan 26, 2018)
Current DAILY +2 Sigma SPX = 2708 with WEEKLY +2 Sigma = 2853
Current DAILY 0 Sigma (20 day MA) SPX = 2660 with WEEKLY 0 Sigma = 2708
Current DAILY -2 Sigma SPX = 2612 with WEEKLY -2 Sigma = 2563
NYSE McClellan Oscillator = -30 (-150 is start of the O/S area; around -275 to -300 area or lower, we go into the �launch-pad� mode, over +150, we are in O/B area)
NYSE Breadth Thrust = 46.7 (40 is considered as oversold and 65 as overbought)
Last Thursday was another rough day for the LONGs. Mid-day we alerted everyone to get back ahead of April NFP Report on Friday which came below expectations. Nonetheless, many shorts got their clocks cleaned, Chicago-style.
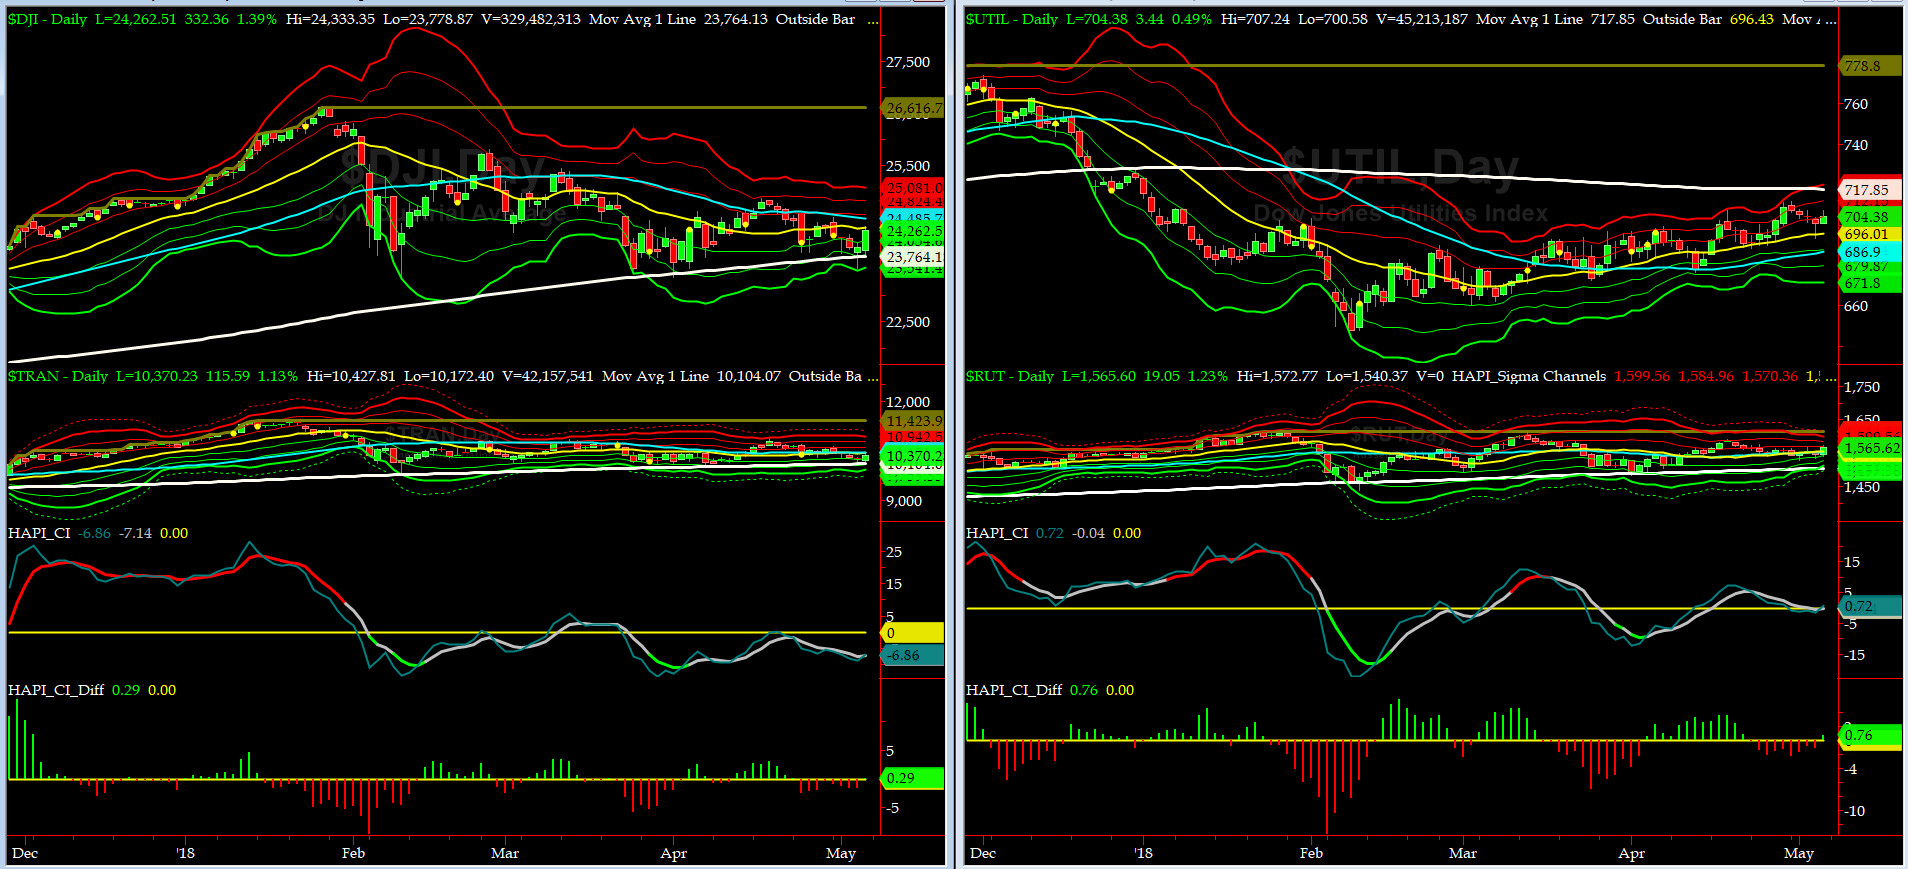
Canaries [in the Coal Mine] Chart for DJ TRAN & RUT Indices
200-Day MA DJ TRAN = 10,104 or 2.6% below DJ TRAN (max observed in last 7 yrs = 20.2%, min = -20.3%)
200-Day MA RUT = 1504 or 4.1% below RUT (max observed in last 7 yrs = 21.3%, min = -22.6%)
DJ Transportation Index (proxy for economic conditions 6 to 9 months hence) sold off hard to its 200day MA & then bounced hard post Apr NFP on Friday, to retest its 50day MA.
Russell 2000 Small Caps Index (proxy for Risk ON/OFF) held its 50day MA and then closed above it hard on Friday. RISK is ON, at least for now.

DeTrenders Charts for SPX, NDX, TRAN & RUT Indices
50-Day MA SPX = 2681 or 0.7% above SPX (max observed in last 7 yrs = +8.6%, min = -9.3%)
200-Day MA SPX = 2615 or 1.8% below SPX (max observed in last 7 yrs = 15.2%, min = -14%)
Only THREE of our EIGHT DeTrenders remain in POSITIVE territory. The DeTrenders for DJ Tran & RUT will continue to be harbingers of future price behavior in broad indices.
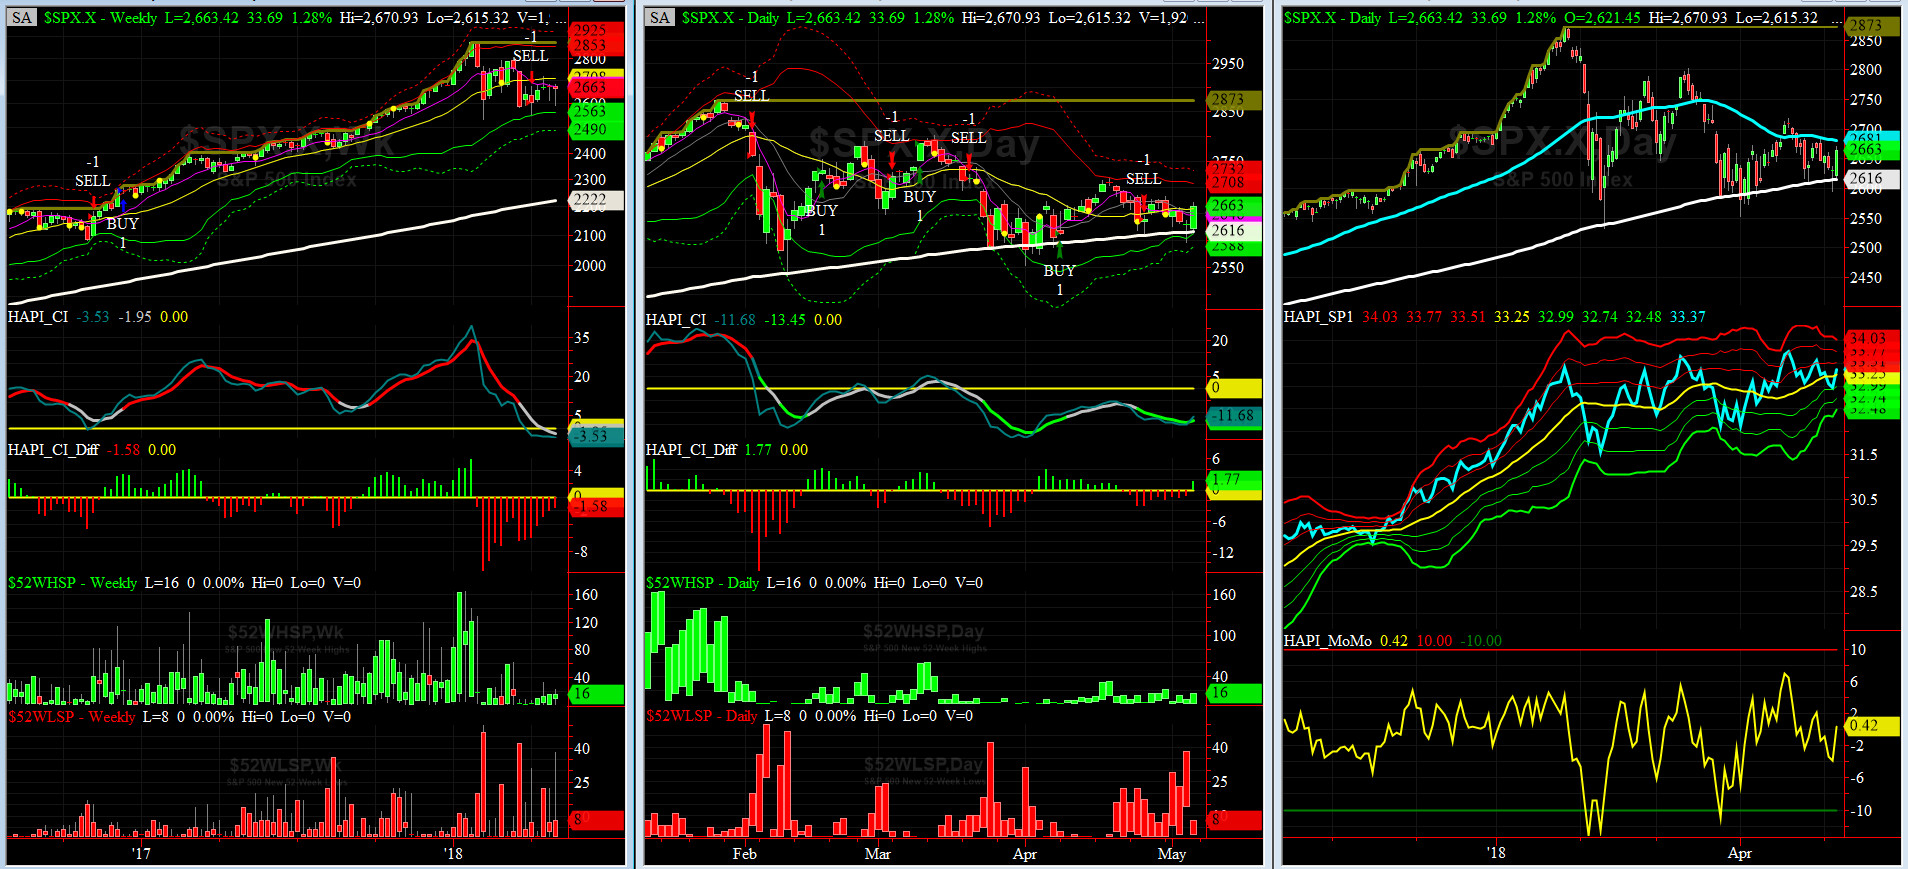
HA_SP1_Momo Chart
WEEKLY Timing Model = on a SELL Signal since Friday 4/06/118 CLOSE at 2604
DAILY Timing Model = on a SELL Signal since Tuesday 4/25/18 CLOSE at 2639
Max SPX 52wk-highs reading last week = 22 (over 120-140, the local maxima is in)
Max SPX 52wk-Lows reading last week = 38 (over 40-60, the local minima is in)
HA_SP1 again closed at its zero sigma channels
HA_Momo = +0.42 (reversals most likely occur above +10 or below -10)
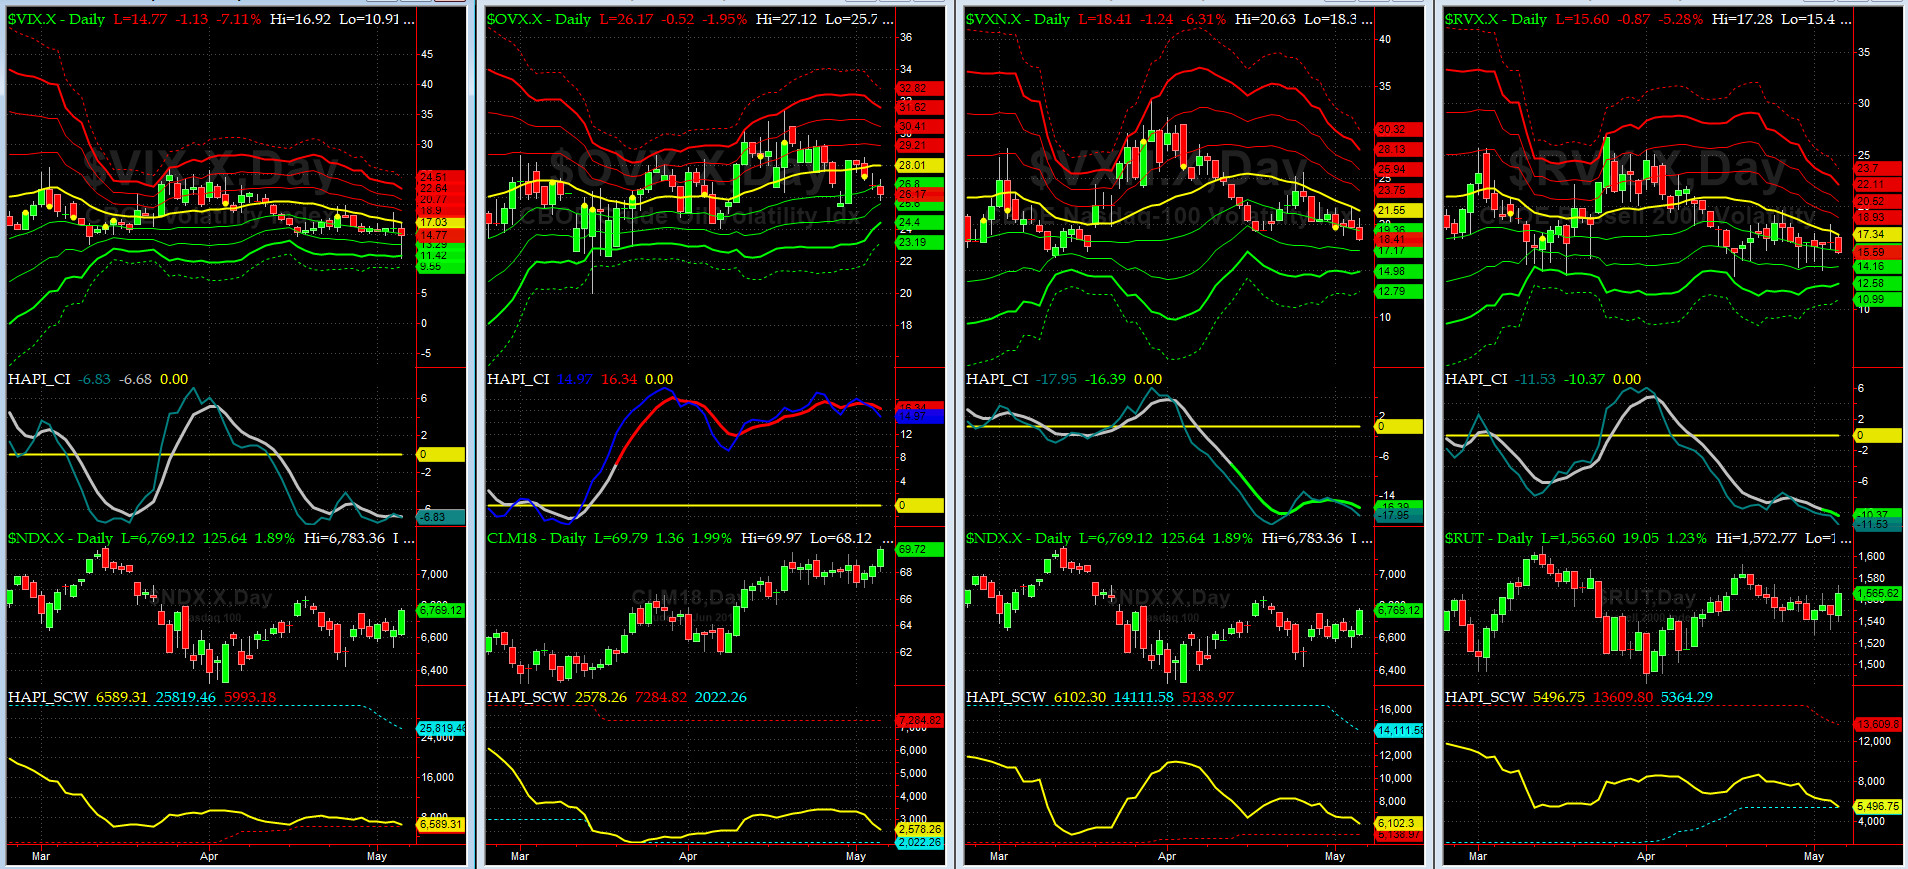
Vol of the Vols Chart
VIX currently stands at 14.77, again just about its -1 sigma (remember it's the VIX volatility pattern aka "its sigma channels" that matters, and not the level of VIX itself (this is per Dr. Robert Whaley, a great mentor and inventor of original VIX, now called VXO). VIX usually peaks around a test of its +4 sigma).
Low Vols are back. The qustion remains for how long?

5-day TRIN & TRINQ Charts
NYSE 5-day TRIN in BUY zone while NASDAQ's remains in NEUTRAL zone.
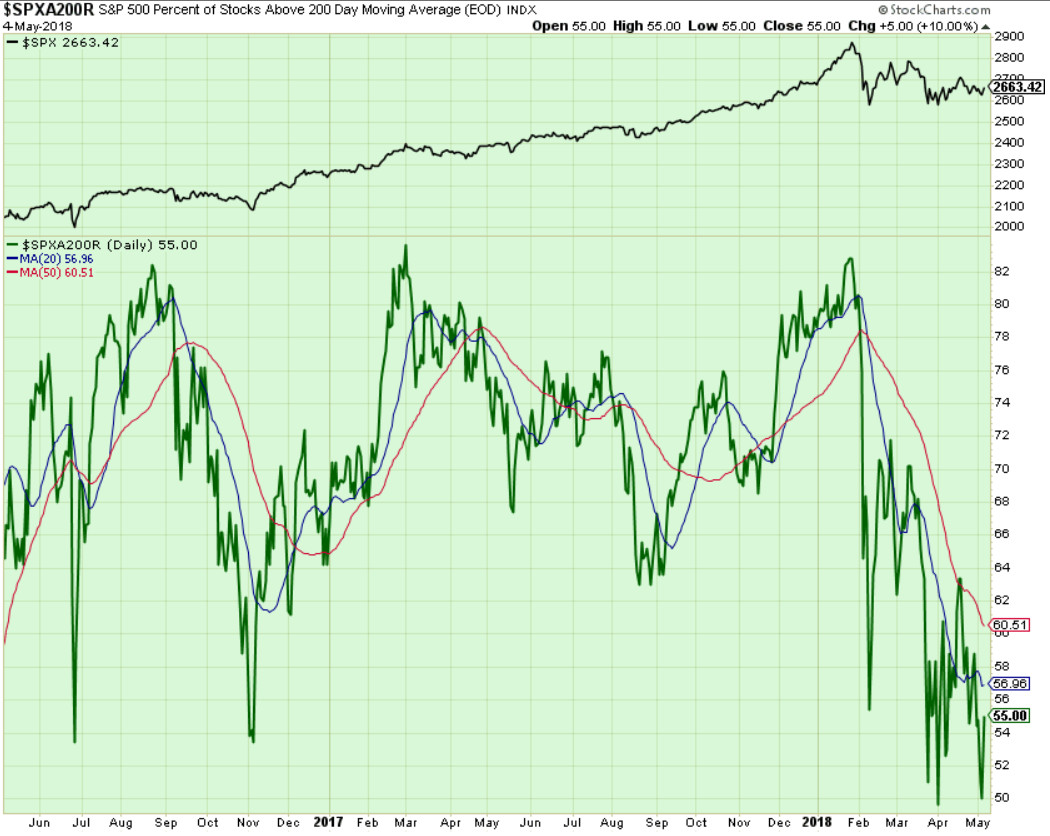
Components of SPX above their respective 200day MA Chart
This scoring indicator retested our target we talked about last week at the 50% mark on Thursday (much like it did in early April). stay tuned sailors.
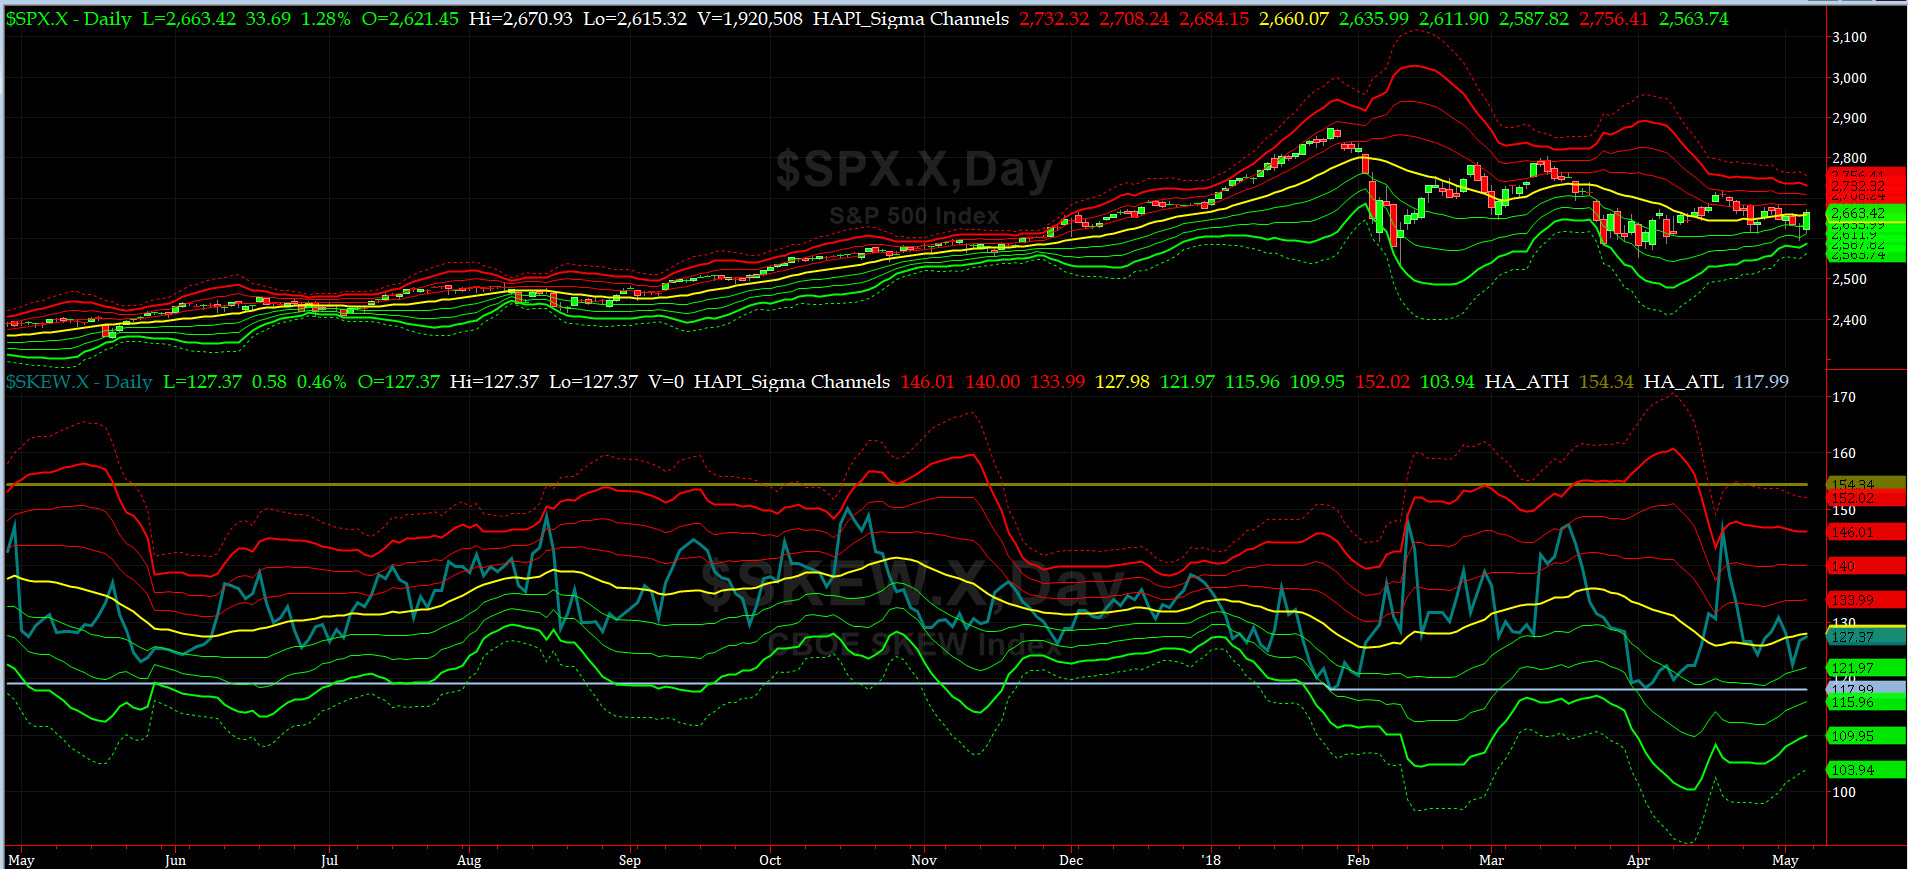
SPX SKEW (Tail Risk) Chart
On Monday, SPX SKEW (Tail Risk) closed near 127, or near its zero sigma (normal = 120-125, range 100-150).
Is all quiet on the Eastern & Mid-Western Fronts? Smart Money says YES, for now, but our very own @Capt_Tiko is staying a tad defensive here.
How to interpret the value of SPX SKEW? (from CBOE white paper on SKEW)

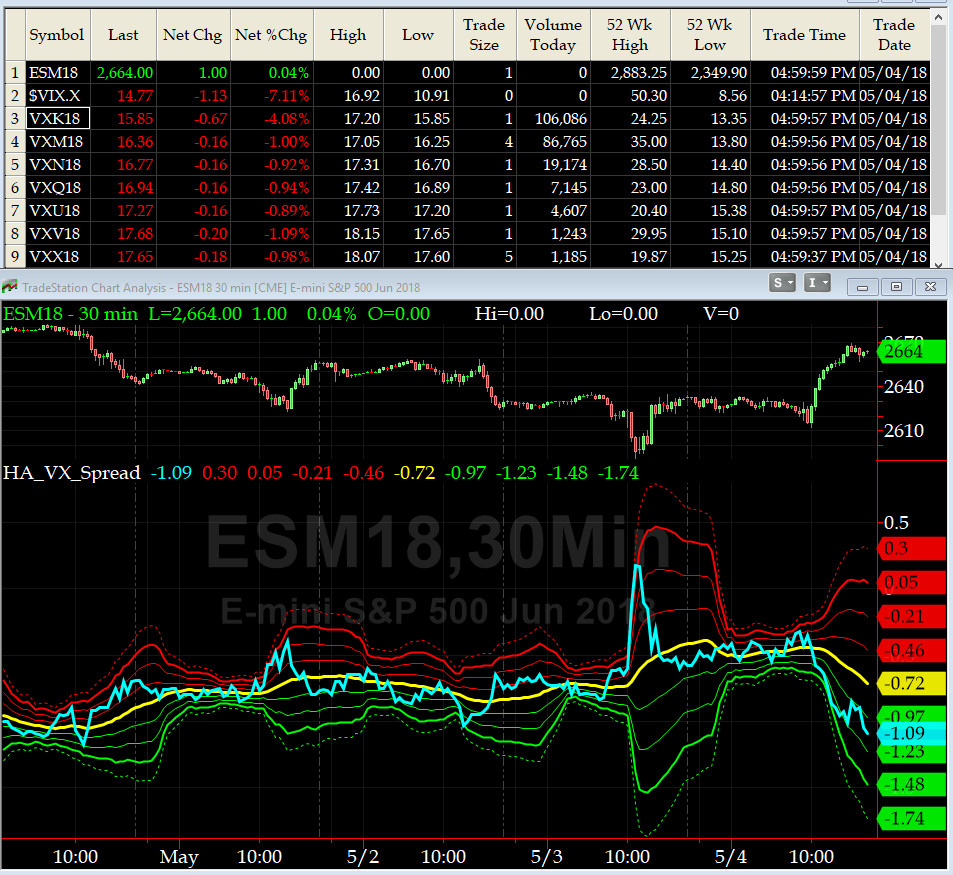
3-month VIX Futures Spread(VX) Chart
This popular timing indicator, now long May, and short August VIX Futures near -1.09. Is the bottom in? Our beloved @Capt_Tiko still thinks YES.
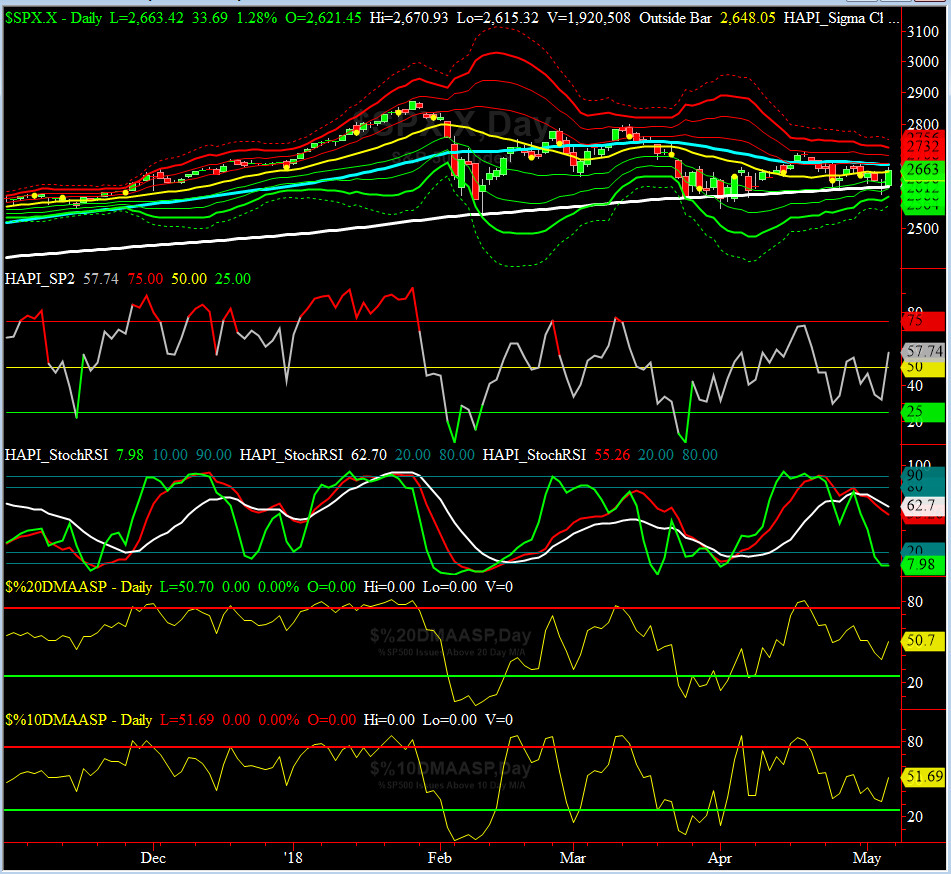
HA_SP2 Chart
HA_SP2 = 40.9 (Buy signal <= 25, Sell Signal >= 75)
This coveted prop indicator put in higher low, at 32, on Thursday and then rushed to claost at 57.7 for the week. This is somewhat encouraging.
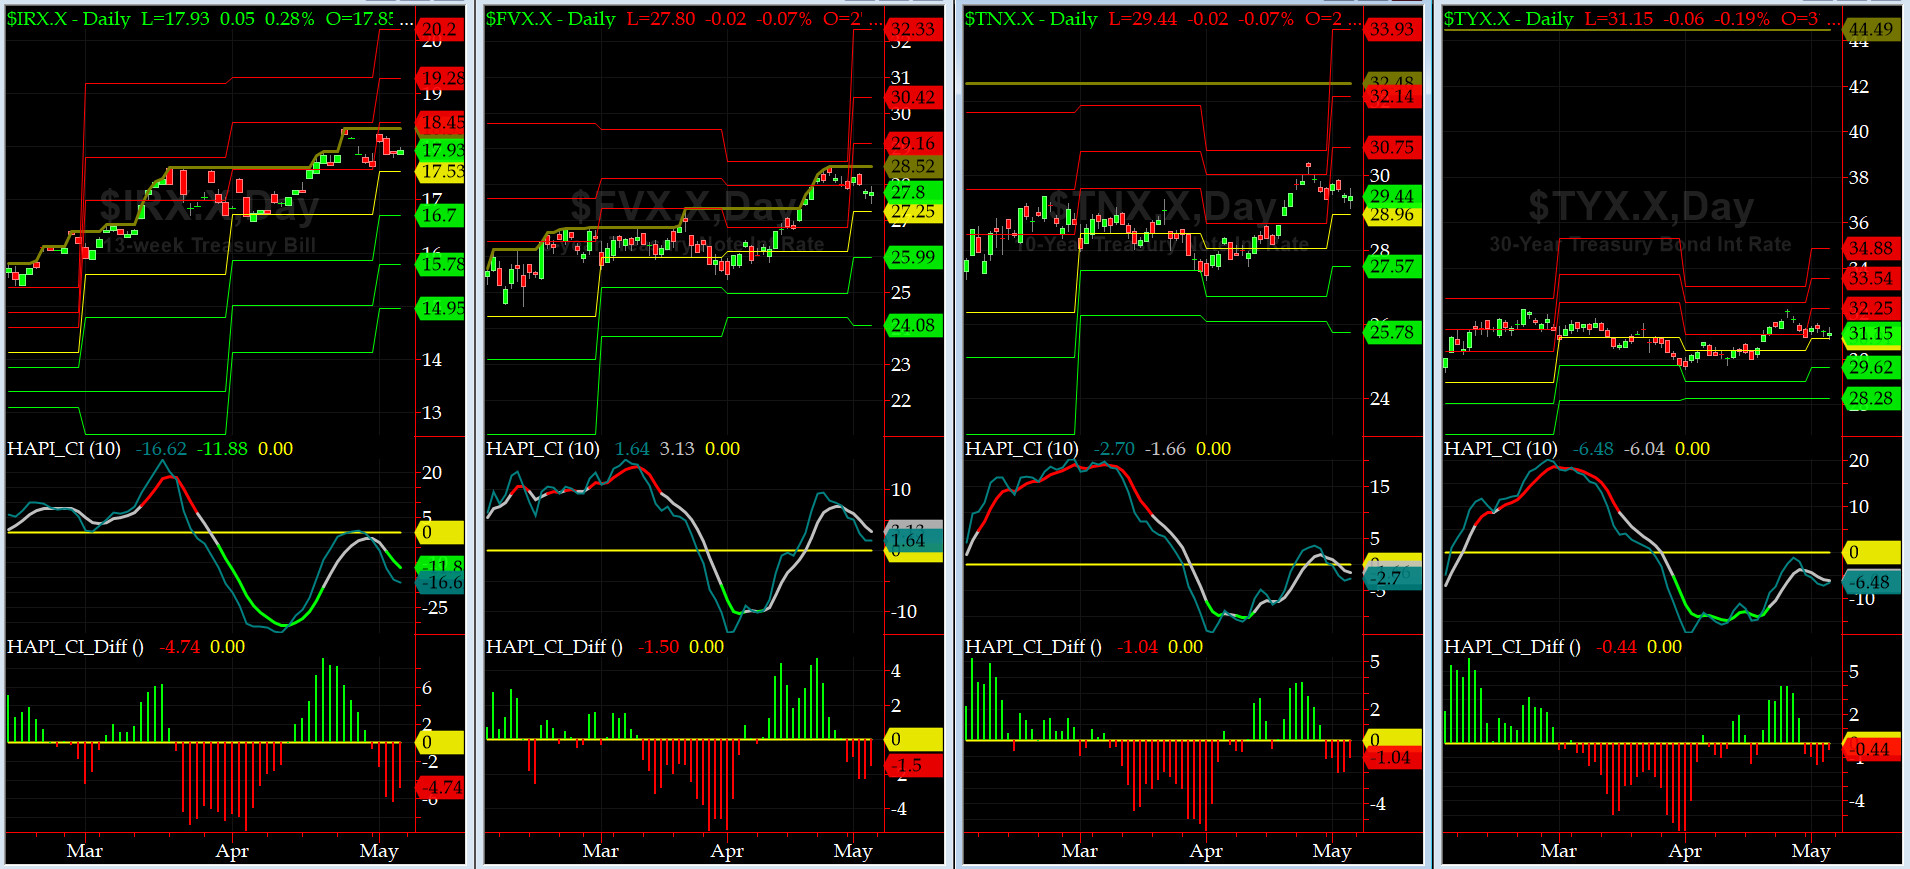
US Treasury T-Notes & T-Bonds Yields Chart
Our beloved Maury, is again concerned, as Flight-to-Quality keeps pressuring the Yield lower as he try to put in more cash to work in the bond market (he remains scared of stocks up here).
Fari Hamzei
|


 Proactive Market Timing


