|
Sunday, May 13, 2018, 2200ET
Market Timing Charts, Analysis & Commentary for Issue #240
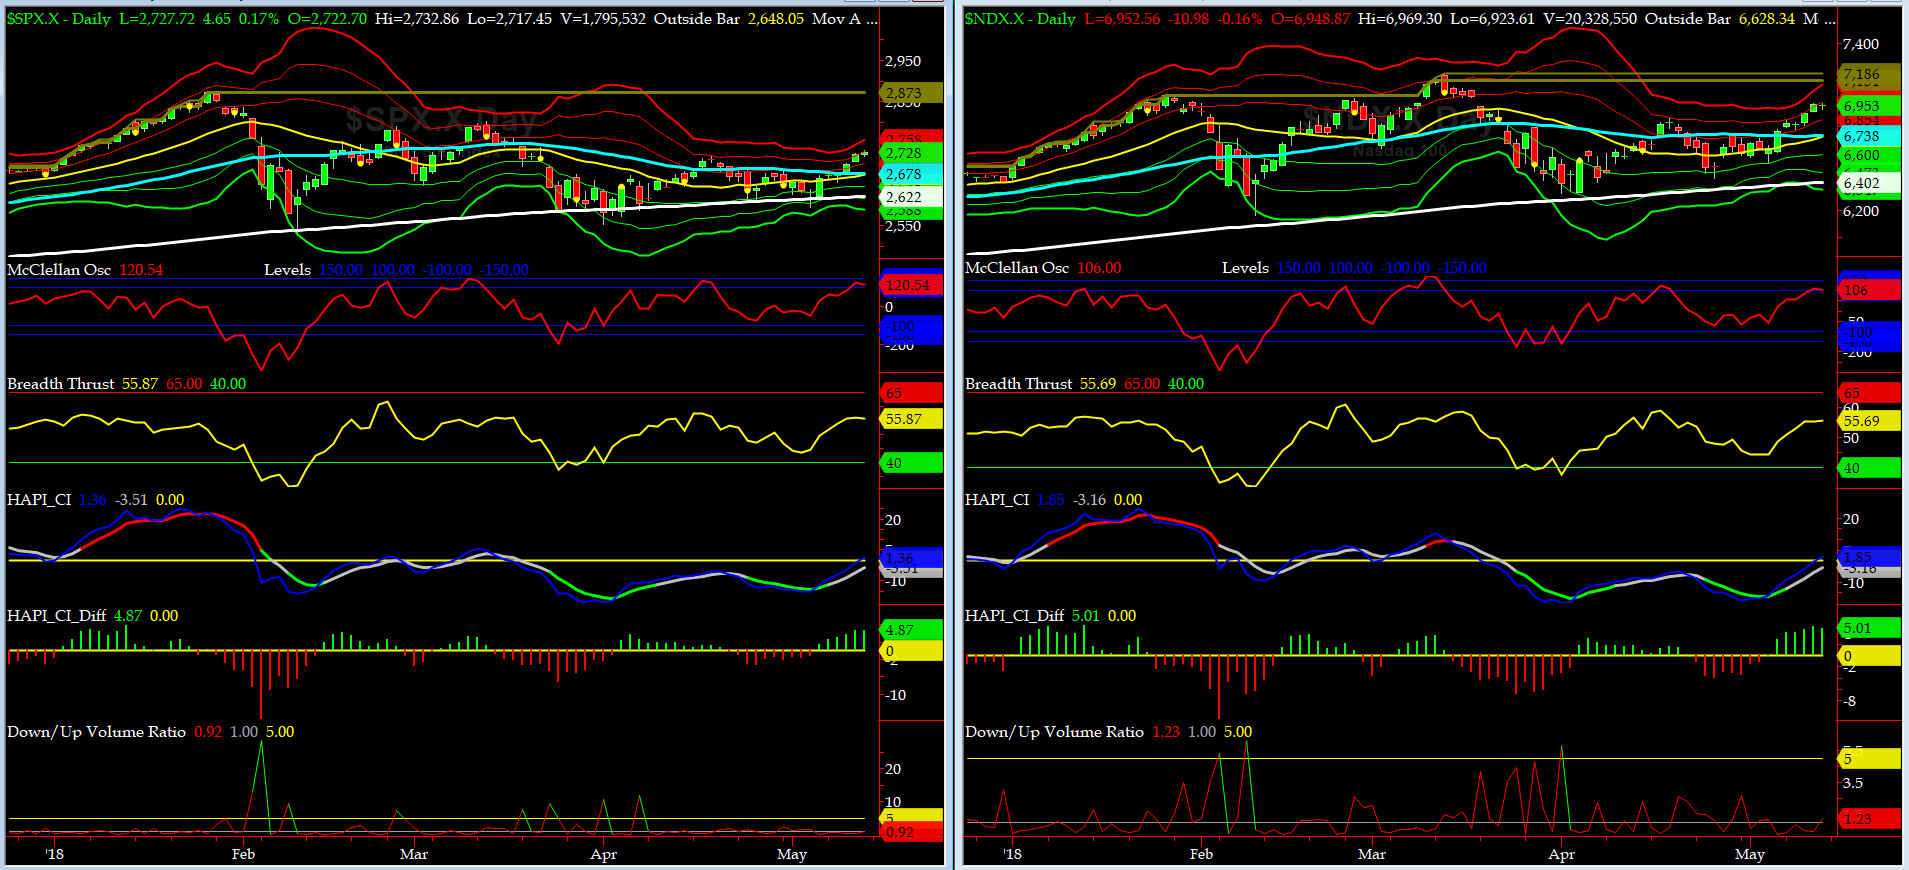
Timer Charts of S&P-500 Cash Index (SPX) + NASDAQ-100 Cash Index (NDX)
Most recent S&P-500 Cash Index (SPX): 2727.72 up +64.30 (up +2.4%) for the week ending on Friday, May 11, 2018, which closed just below its +2 sigma.
SPX ALL TIME INTRADAY HIGH = 2872.87 (reached on Friday, Jan 26, 2018)
SPX ALL TIME CLOSING HIGH = 2872.87 (reached on Friday, Jan 26, 2018)
Current DAILY +2 Sigma SPX = 2730 with WEEKLY +2 Sigma = 2855
Current DAILY 0 Sigma (20 day MA) SPX = 2673 with WEEKLY 0 Sigma = 2710
Current DAILY -2 Sigma SPX = 2617 with WEEKLY -2 Sigma = 2565
NYSE McClellan Oscillator = +120.5 (-150 is start of the O/S area; around -275 to -300 area or lower, we go into the �launch-pad� mode, over +150, we are in O/B area)
NYSE Breadth Thrust = 55.9 (40 is considered as oversold and 65 as overbought)
Speaking of shorts getting their clocks cleaned, Chicago-style, all of the sudden, by middle of last week, we heard nothing more from the perma-bears out there. Not even a peep. Bye Bye Shorts? History points otherwise. They are just hibernating for now, @Capt_Tiko reminds us while reading Rumi & having his tea.
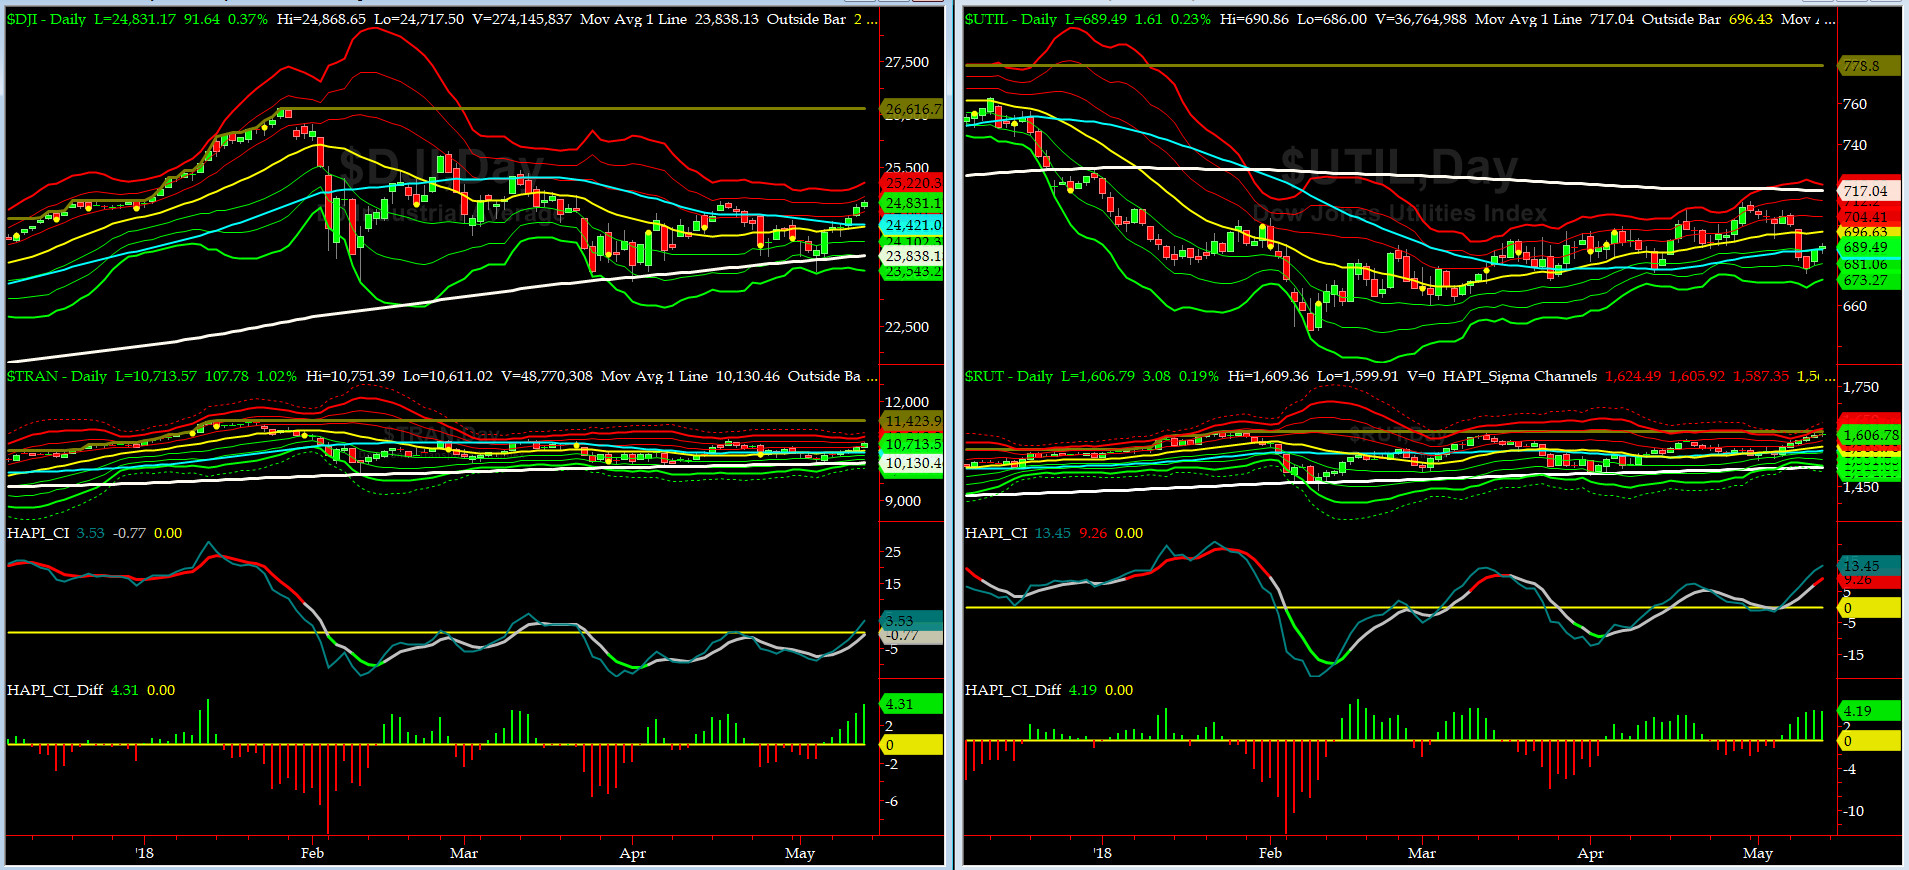
Canaries [in the Coal Mine] Chart for DJ TRAN & RUT Indices
200-Day MA DJ TRAN = 10,130 or 5.8% below DJ TRAN (max observed in last 7 yrs = 20.2%, min = -20.3%)
200-Day MA RUT = 1508 or 6.5% below RUT (max observed in last 7 yrs = 21.3%, min = -22.6%)
DJ Transportation Index (proxy for economic conditions 6 to 9 months hence) rallied hard this weeks (its second best week in 2018). Watch for a test of 10,770 on closing basis.
Russell 2000 Small Caps Index (proxy for Risk ON/OFF) had another great week and should put in new ATHs (first time since Jan '18). RISK is UBER ON.
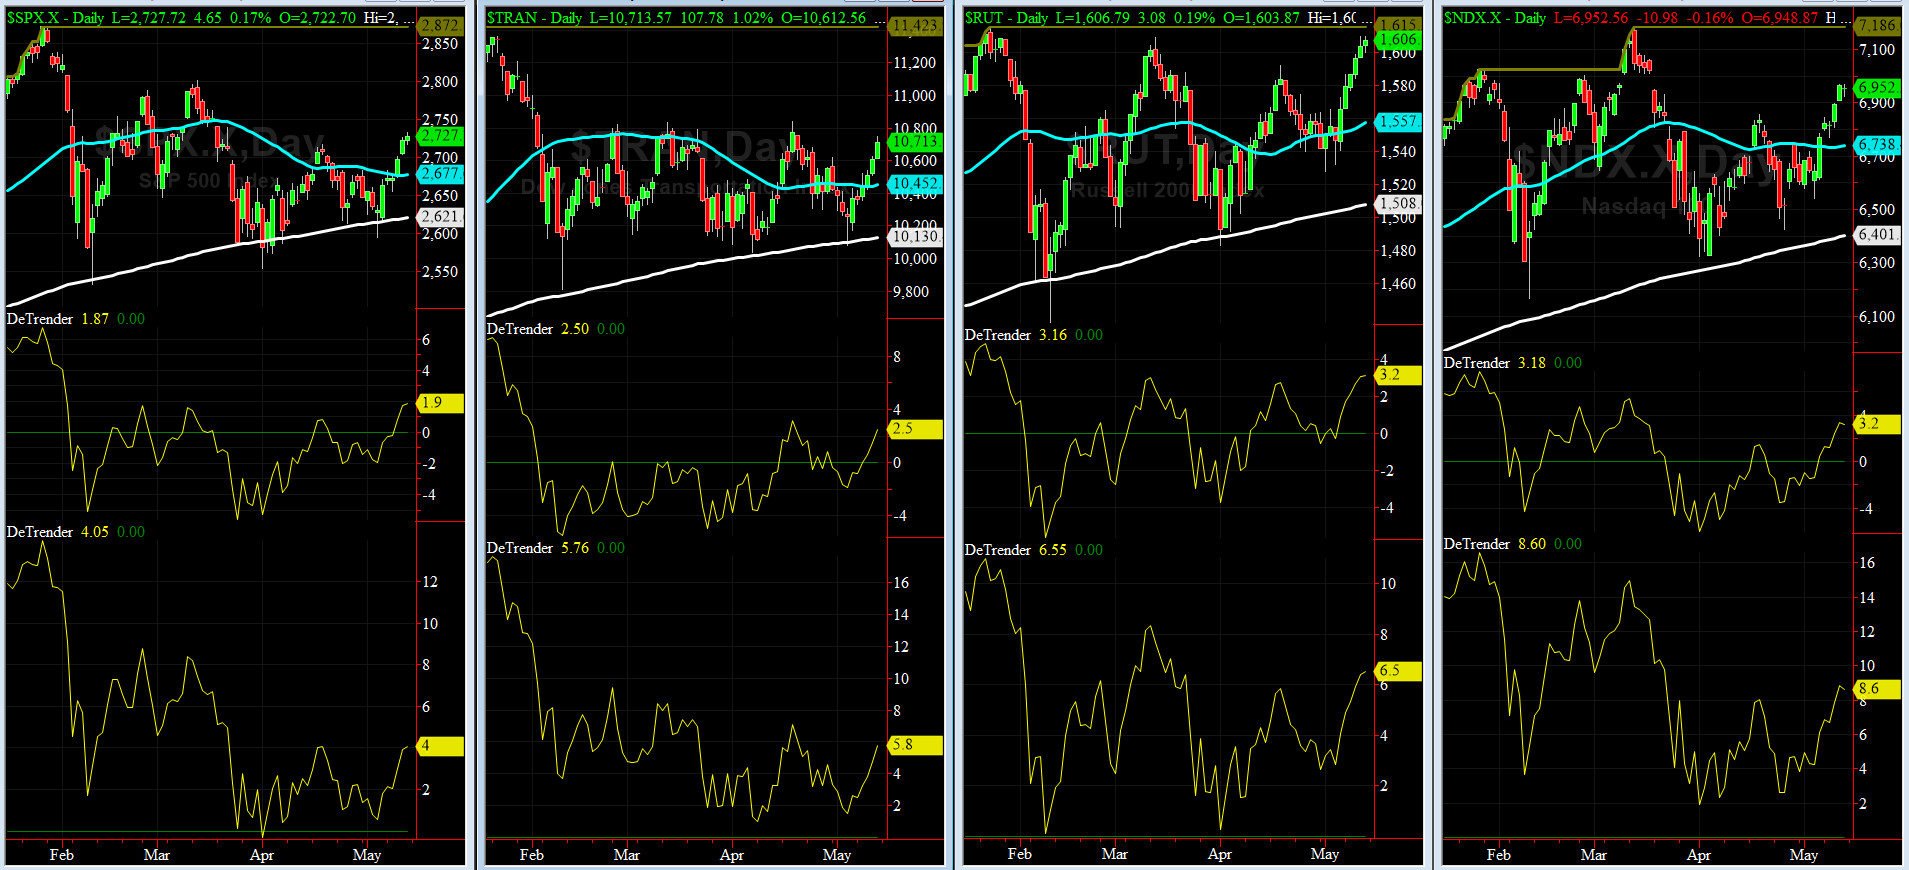
DeTrenders Charts for SPX, NDX, TRAN & RUT Indices
50-Day MA SPX = 2677 or 1.9% below SPX (max observed in last 7 yrs = +8.6%, min = -9.3%)
200-Day MA SPX = 2621 or 4% below SPX (max observed in last 7 yrs = 15.2%, min = -14%)
All EIGHT of our EIGHT DeTrenders remain in POSITIVE territory. The DeTrenders for DJ Tran & RUT will continue to be harbingers of future price behavior in broad indices.
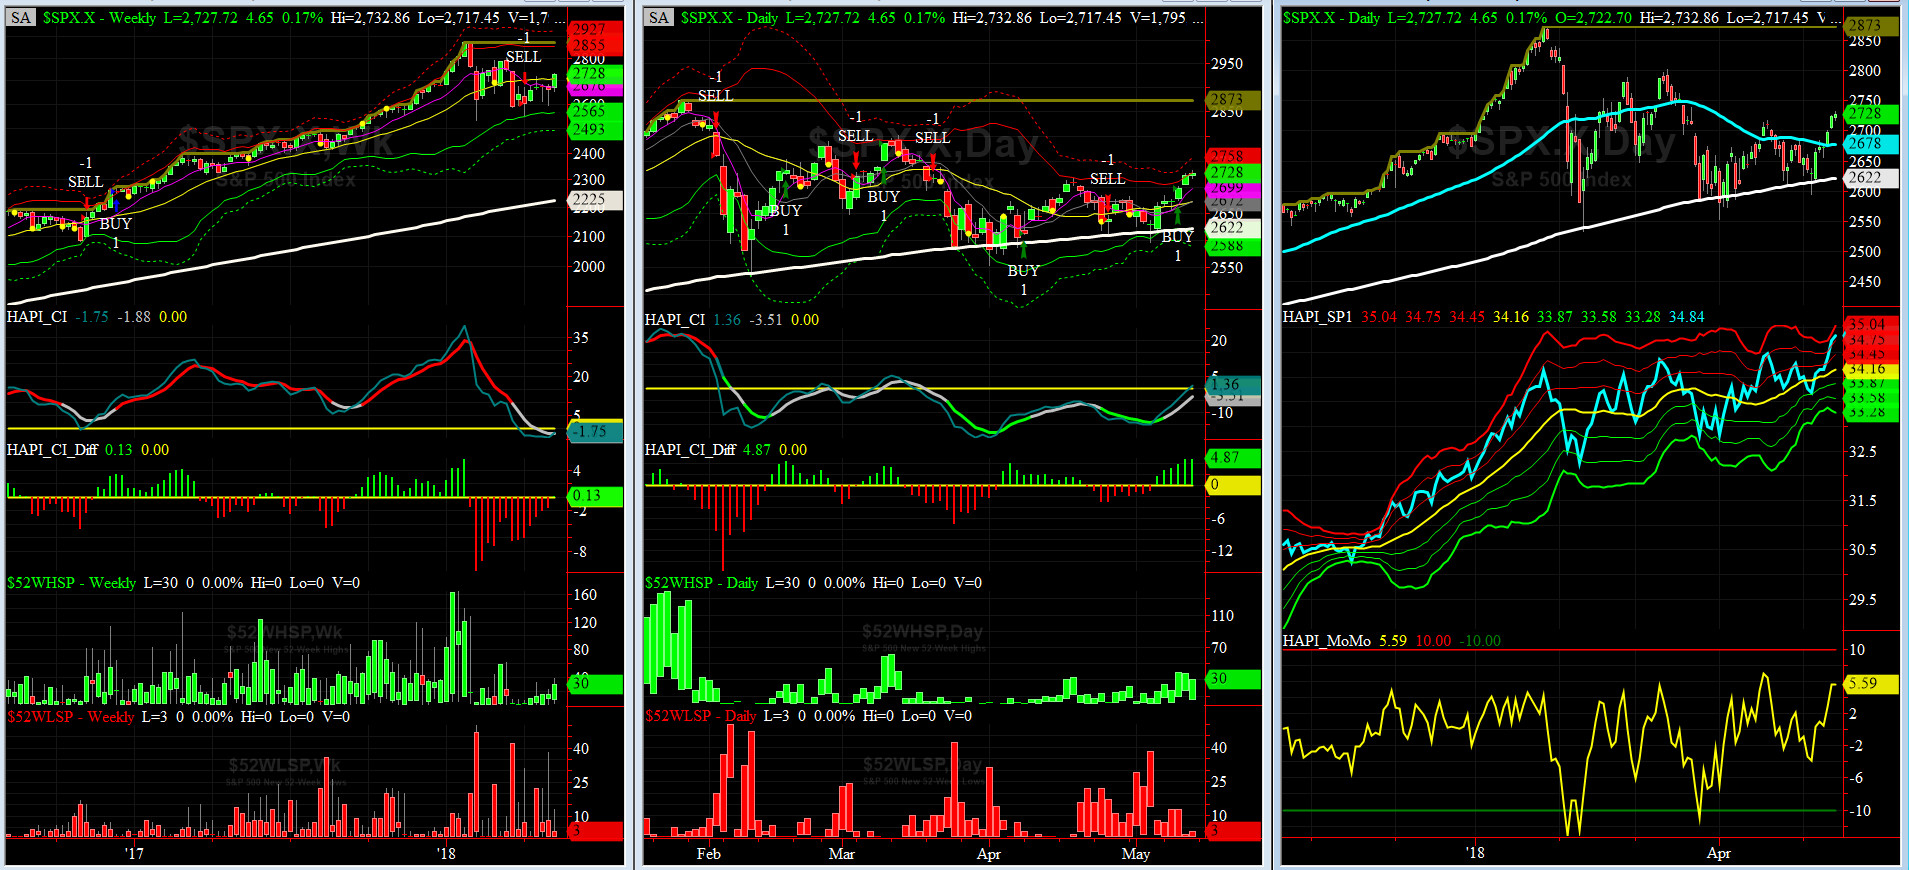
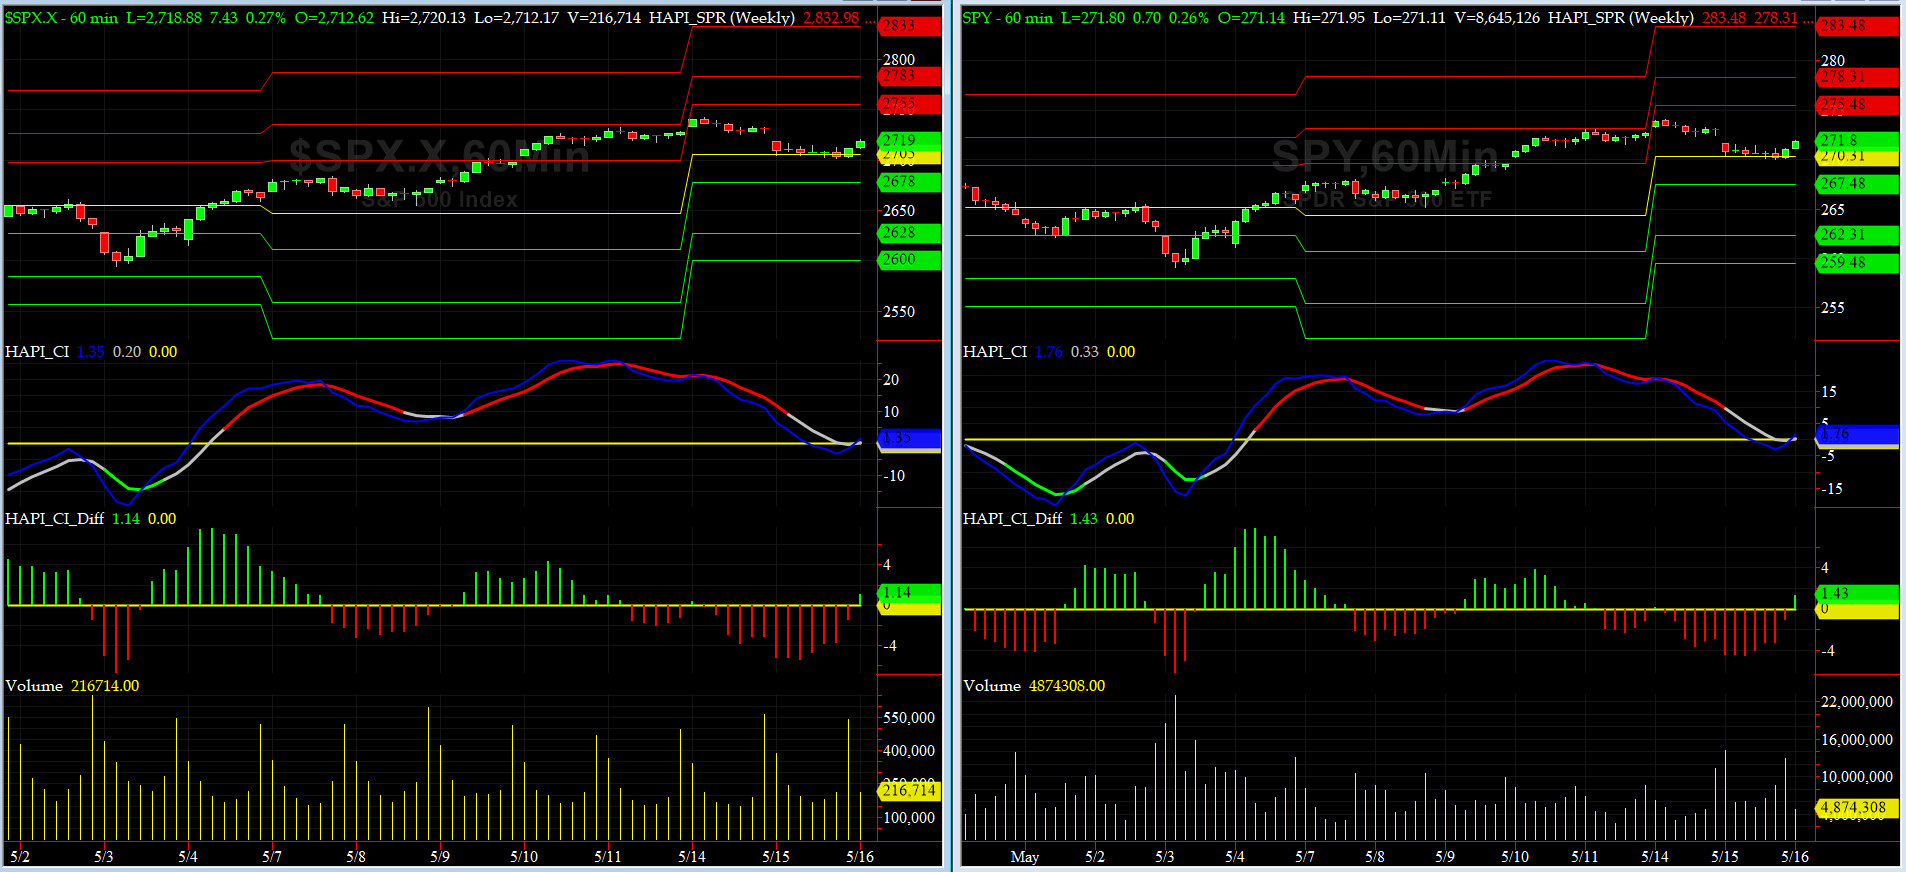
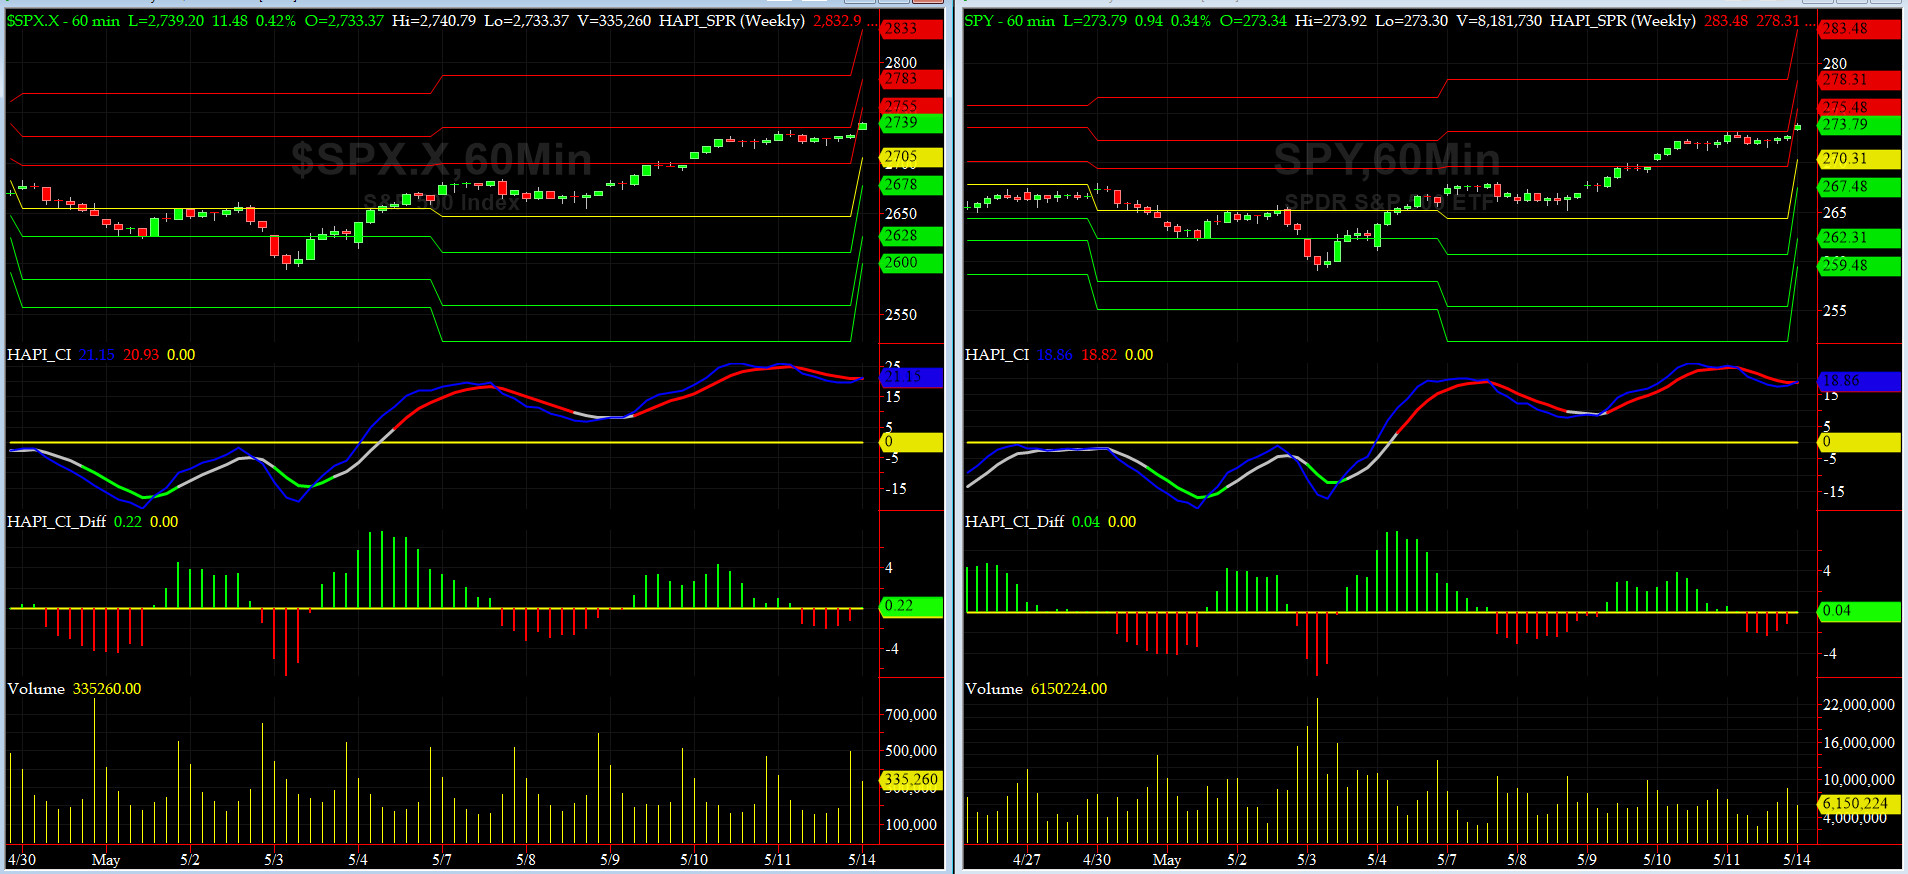
HA_SP1_Momo Chart
WEEKLY Timing Model = on a SELL Signal since Friday 4/06/118 CLOSE at 2604
DAILY Timing Model = on a BUY Signal since Wednesday 5/9/18 CLOSE at 2697
Max SPX 52wk-highs reading last week = 39 (over 120-140, the local maxima is in)
Max SPX 52wk-Lows reading last week = 13 (over 40-60, the local minima is in)
HA_SP1 again closed at its +2.5 sigma channels
HA_Momo = +5.6 (reversals most likely occur above +10 or below -10)
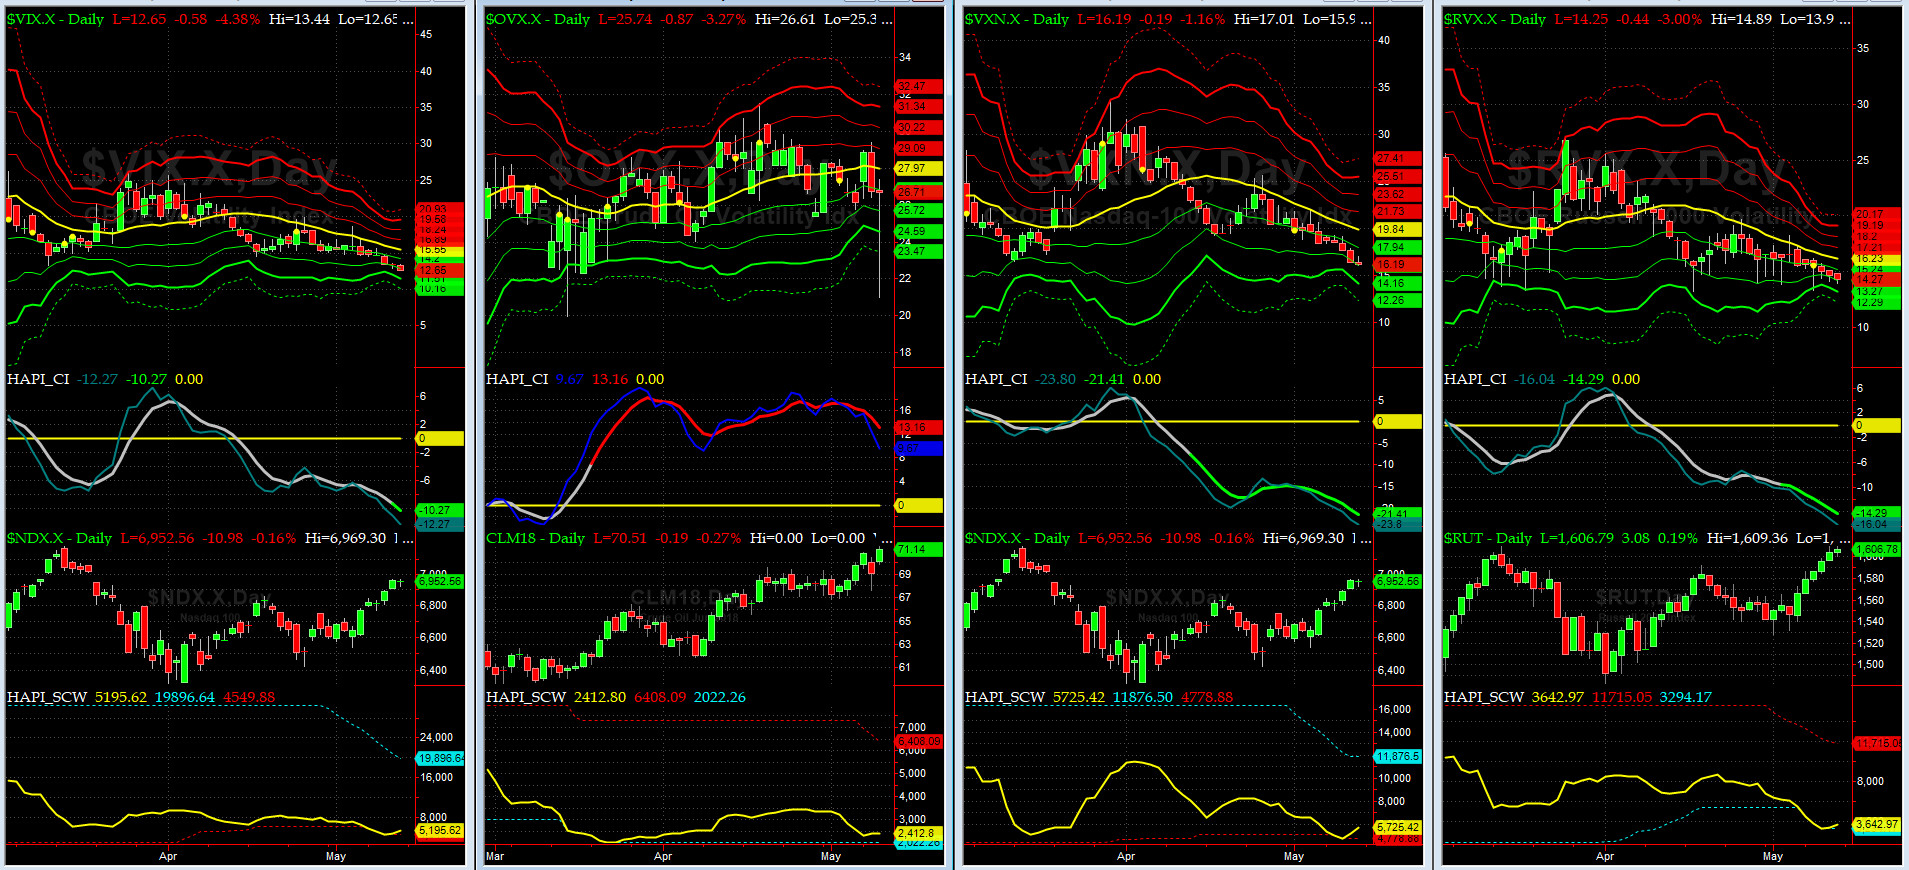
Vol of the Vols Chart
VIX currently stands at 12.65, again just about its -2 sigma (remember it's the VIX volatility pattern aka "its sigma channels" that matters, and not the level of VIX itself (this is per Dr. Robert Whaley, a great mentor and inventor of original VIX, now called VXO). VIX usually peaks around a test of its +4 sigma).
Lower Low Vols are back. @Capt_Tiko, watching the VX Futures Contango, for better part of two weeks ago and early this past week, got him a tad excited. He is back to sipping on his tea and reading Rumi again.

5-day TRIN & TRINQ Charts
Both NYSE & NASDAQ 5-day TRINs are in the SELL zone.
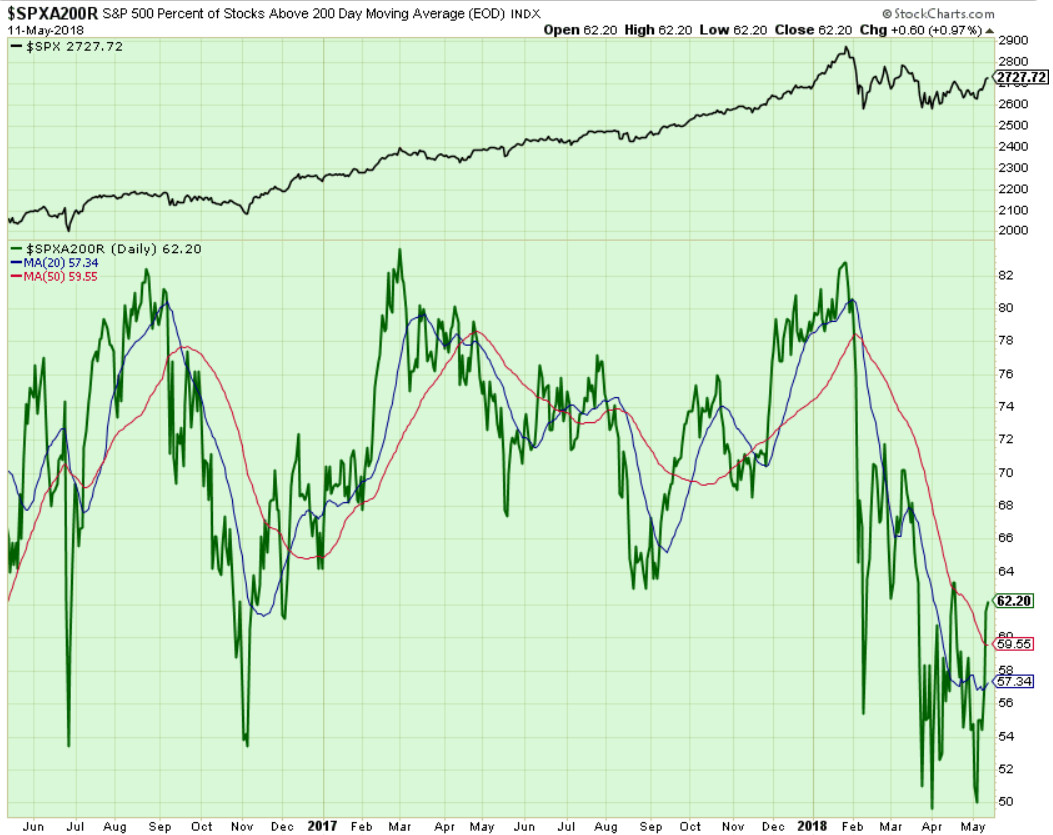
Components of SPX above their respective 200day MA Chart
This scoring indicator looks a lot healthier after double testing the 50% level and then multiple restests of 55% level in April and May. But, we are not out of the woods till we get to 70s.
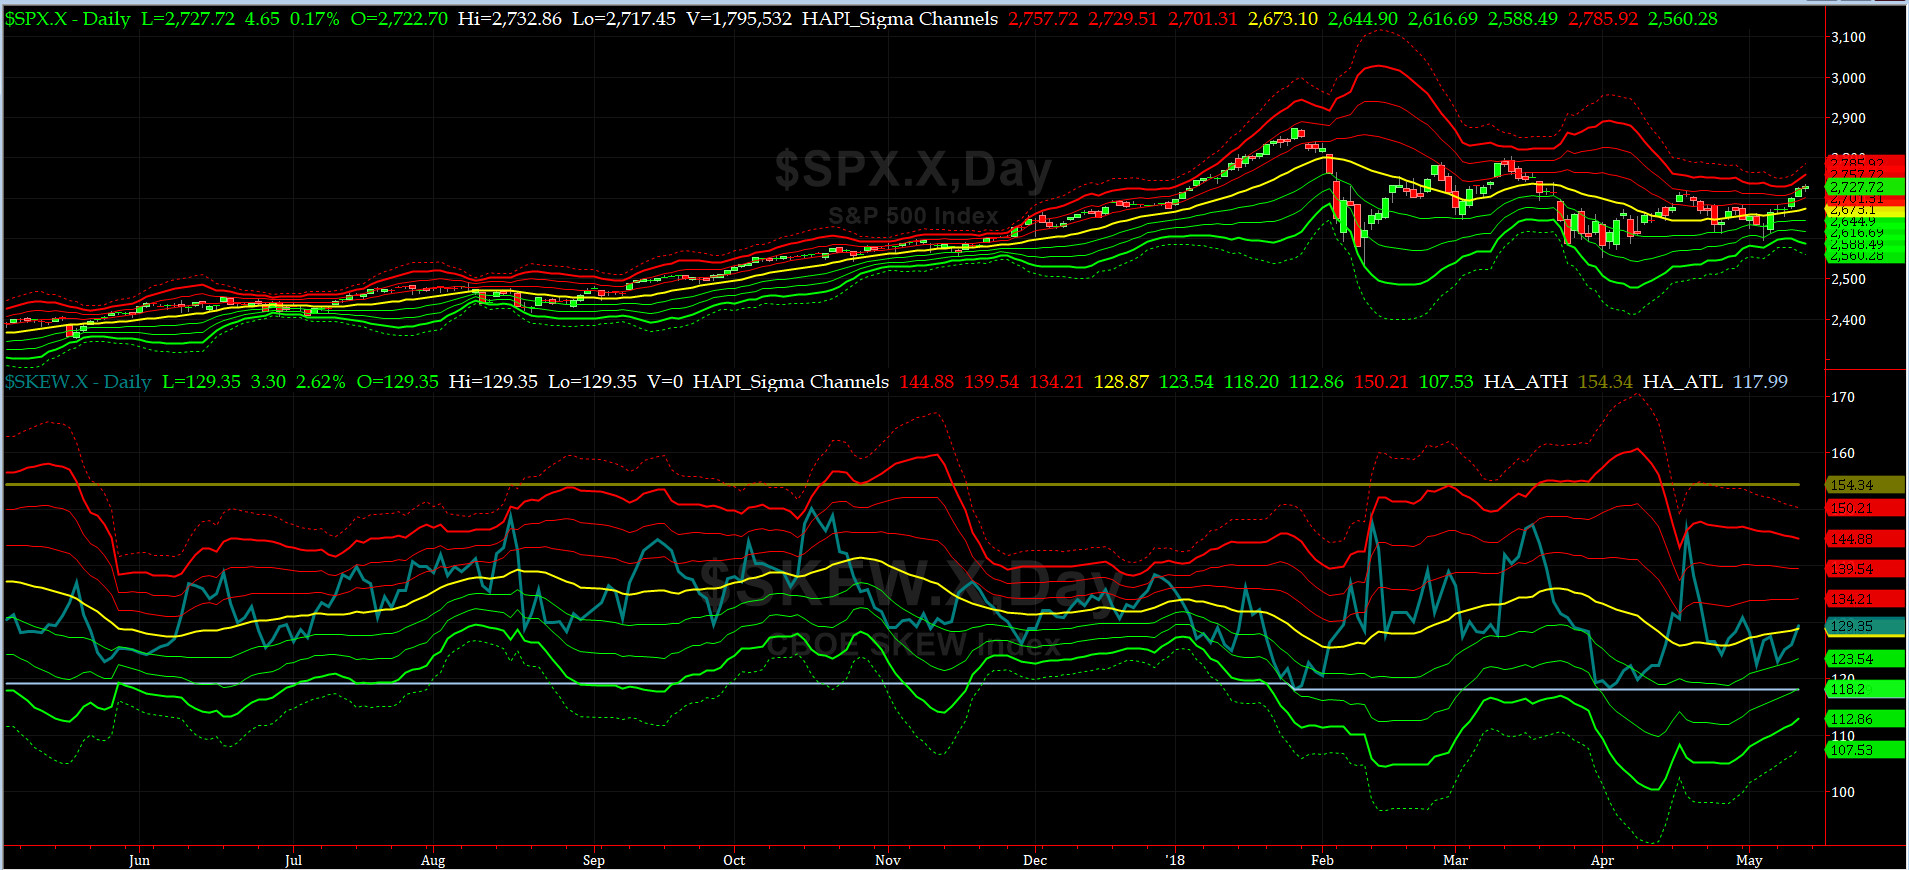
SPX SKEW (Tail Risk) Chart
On Monday, SPX SKEW (Tail Risk) closed near 129, or near its zero sigma (normal = 120-125, range 100-150).
Is all quiet on the Eastern & Mid-Western Fronts? Smart Money says YES, and pretty much has convinced our @Capt_Tiko that water is not that cold any more and he should step in, at least knee high.
How to interpret the value of SPX SKEW? (from CBOE white paper on SKEW)

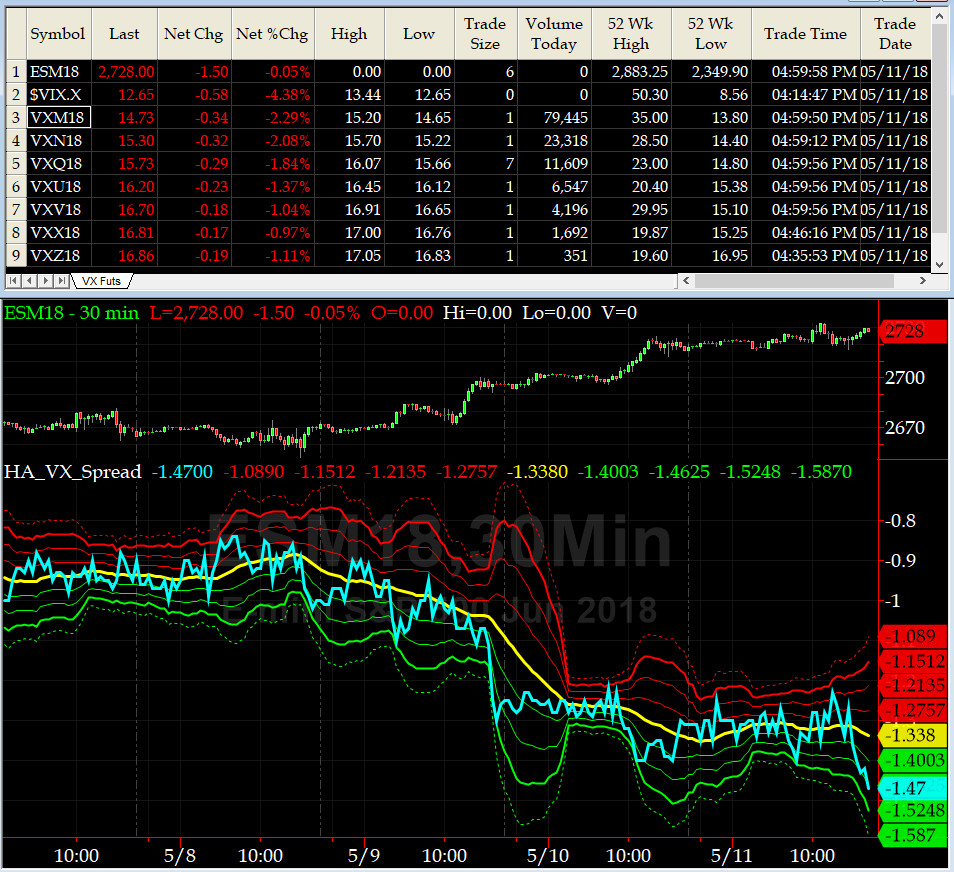
3-month VIX Futures Spread(VX) Chart
This popular timing indicator, now long June, and short September VIX Futures near -1.5. Is the bottom in? @Capt_Tiko says "YES, we told you so two weeks ago."
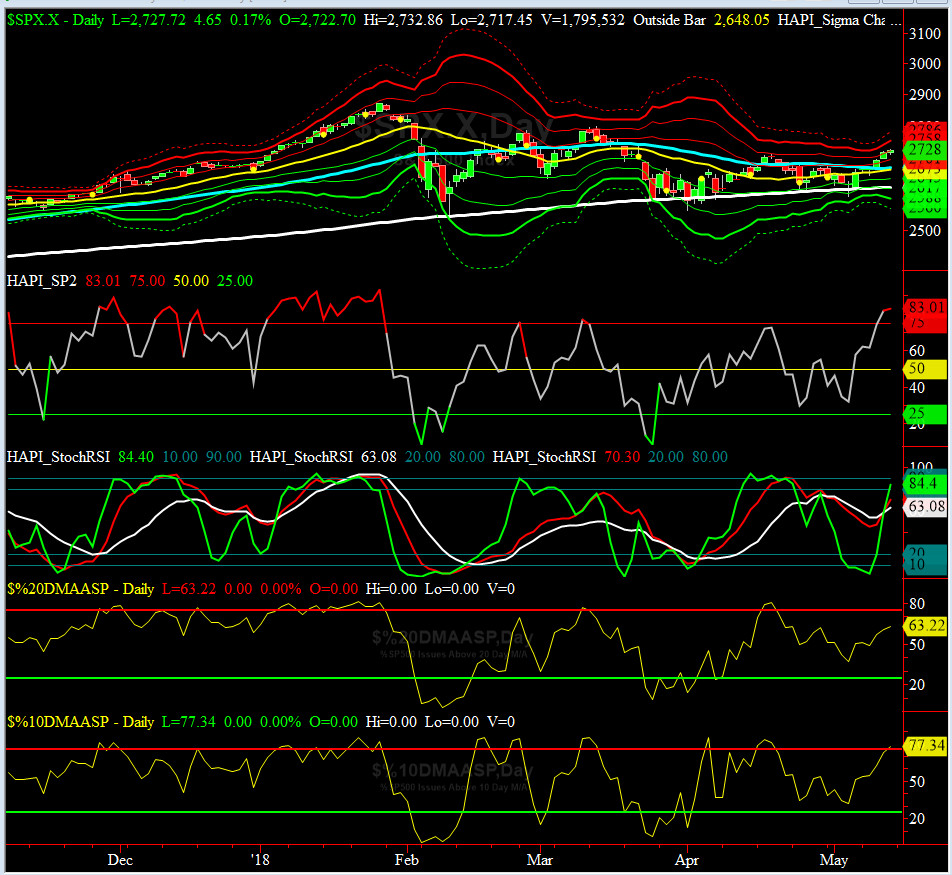
HA_SP2 Chart
HA_SP2 = 83 (Buy signal <= 25, Sell Signal >= 75)
This coveted prop indicator is now overbought. What's next? Well, topping formation can take time and the $64K question becomes what is the catalyst for a pull-back? And a lot of that depends who you talk to.

US Treasury T-Notes & T-Bonds Yields Chart
Our beloved Maury is finally doing cartwheels. That should sum up the state of affairs of our Bond Market.
Fari Hamzei
|


 Proactive Market Timing