
|
 |
 |
 |
 |
 |
 |
 |
 |
 Proactive Market Timing Proactive Market Timing
|
|
|
Most Recent PMT vs SPX Performance Chart

|
|
|
|
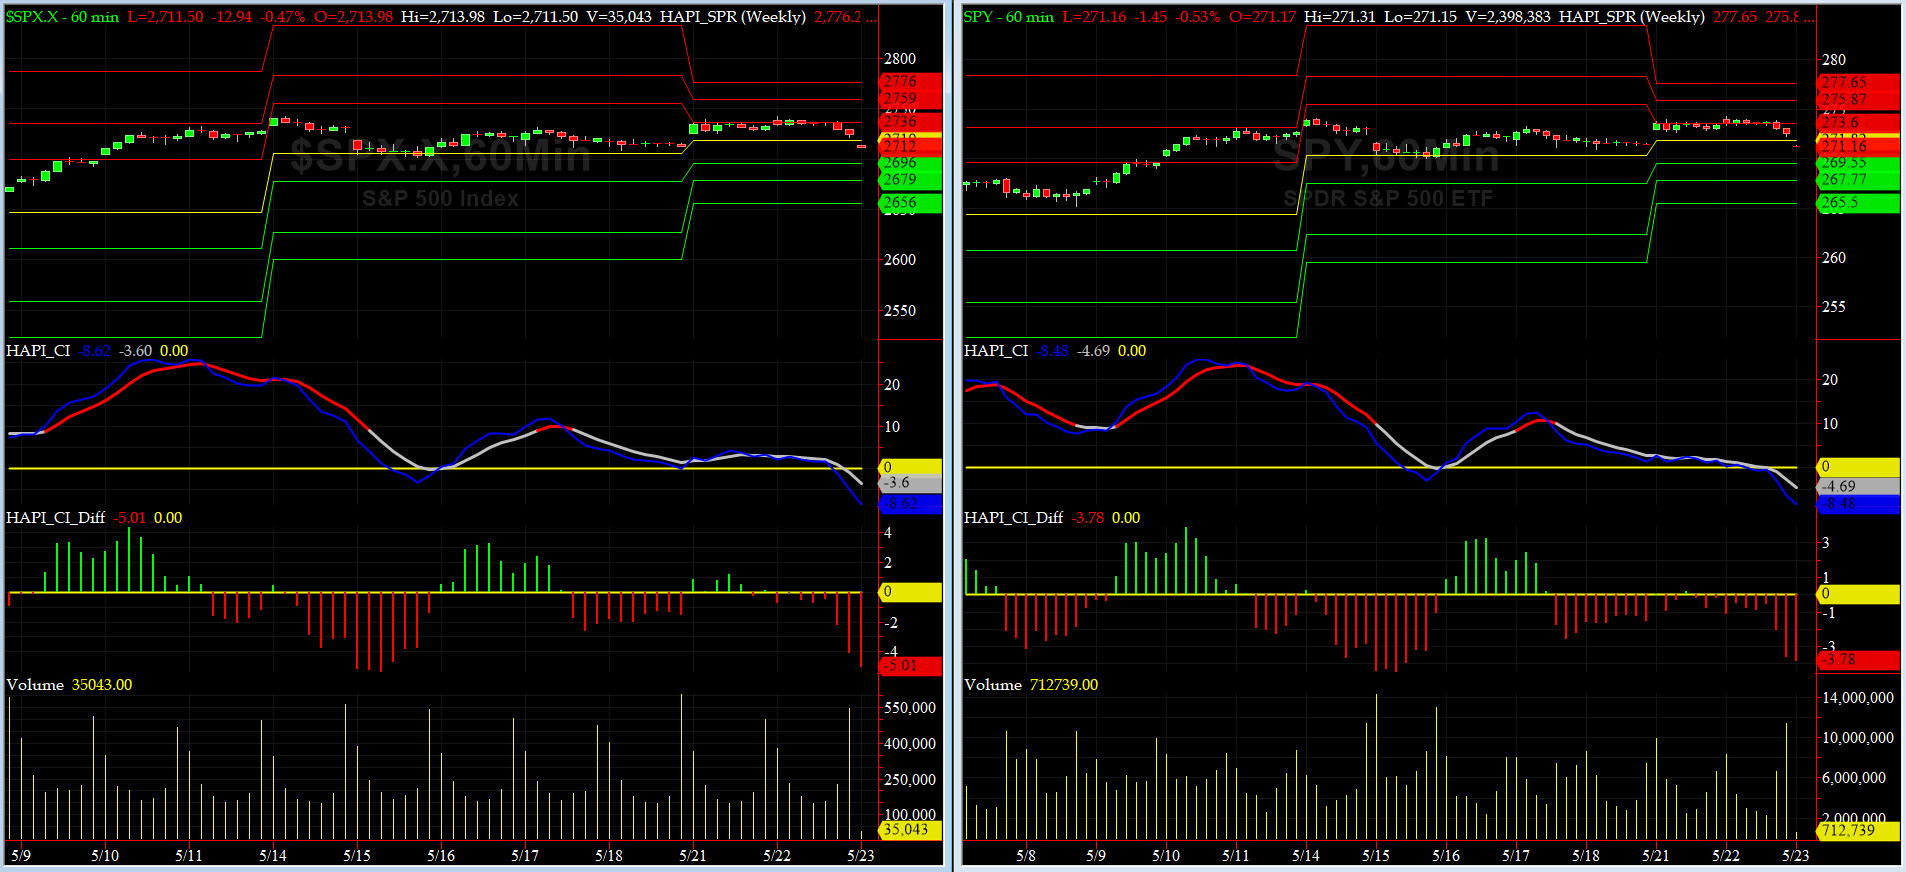
Wednesday, May 23, 2018, 0935ET
UPDATED Timer & Companion Chart for Market Bias Review, Issue #241

Timer Charts of S&P-500 Cash Index (SPX) + NASDAQ-100 Cash Index (NDX)
|
|
|
|
|
|
Wednesday, May 23, 2018, 0935ET
UPDATED Market Bias for Issue #241
Our current Market Bias with Timer Digest is SHORT SPX as of MAY 22 at 2724.44
Our previous Market Bias was LONG SPX as of Friday MAR 23 at 2588.26
Here are the trade parameters for this week:
SPX Money Management Stop for 100% of our position = 2725
SPX BreakEven Stop (Last Open) for last 20% of our position = 2714
SPX Primary Profit Target for first 80% of our position = 2690
SPX Secondary Profit Target for last 20% of our position = 2675
|
| Action |
Asset |
Expiration |
Strike |
Option |
| BUY |
SPY |
Friday JUN 15 |
271 |
Puts |
| SELL SHORT |
SPY |
Friday JUN 15 |
266 |
Puts |
| You need to execute both legs and hold it as a Put-Spread.
|
Note A:
Once the Primary Profit Target has been reached, traders are advised to close 80% of their position in order to lock in profits. The remaining balance can be carried over with a BreakEven STOP, based on the SPX level at the time of entry, in order to make the trade a zero-risk trade with the final position running to reach the Secondary Profit Target.
Once either Secondary Profit or Money Management (BreakEven STOP after the 80% peel-off) is hit, our Option/ETF trade for that week is over. Go to Cash and wait for the next PMT Issue.
Note B:
When we change our Market Bias with Timer Digest, You need to go FLAT asap. With PMT Pro, that is before the Close that day and with the basic PMT, at the open of the next day. The following trading day, we will issue new SPX targets and a new SPY options trade, as long our new market bias with Timer Digest is NOT flat.
Fari Hamzei
|
|
|
|
|
|
Wednesday, May 23, 2018, 0820ET
Notice of Change of Bias with Timer Digest
Dear Jim,
We have had a tremendous amount rain and thunderstorms in the last 4 days down here in SW FL (btw, we can use the rain water) but I am not sure you got my email last night around 9 pm (2100 ET) as you normally confirm it back to me in early hours of next day.
I just called your office and left you a voice mail. However you book it for me is fine with me. I just noticed we have 441 emails stuck on outbox of our email server since late Sunday (another rainy day here).
I need to get Short SPX. After the Close yesterday, it was clear that SPX put in an outside bar reversal at a channel breakout resistance level while our coveted CI Indicator Crossed DOWN.
Fari Hamzei
|
|
|
|
|
|
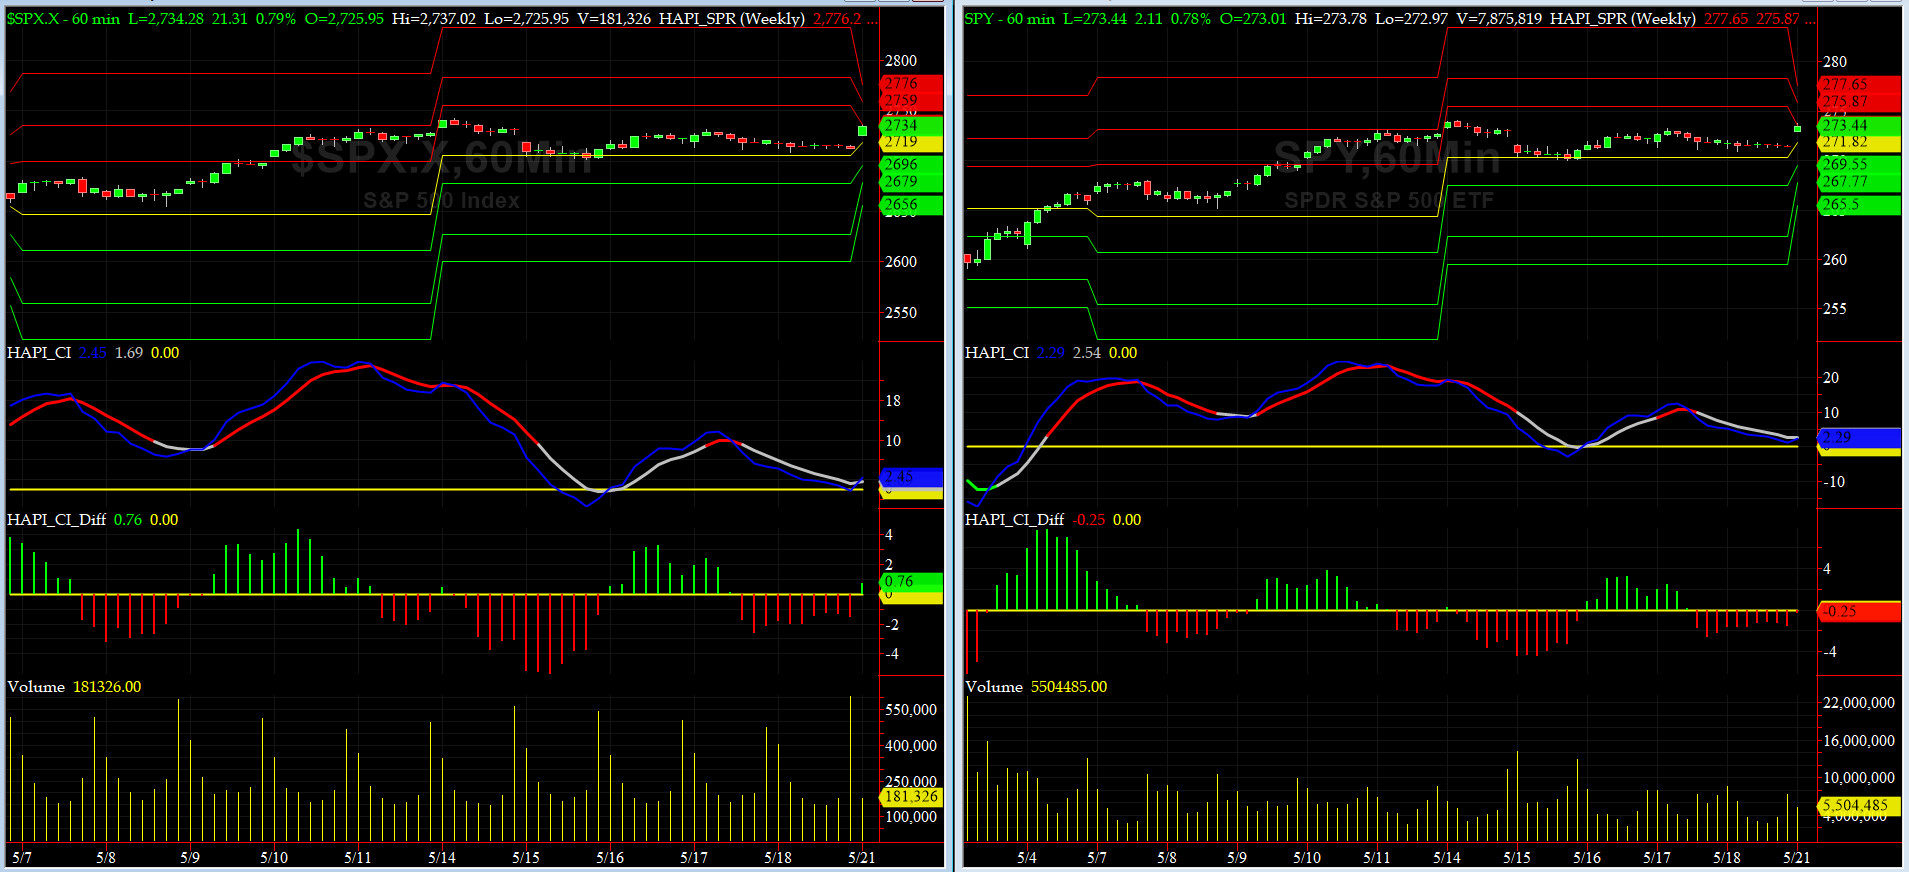
Monday, May 21, 2018, 0955ET
Companion Chart for Market Bias Review, Issue #241
|
|
|
|
|
|
Monday, May 21, 2018, 0950ET
Market Bias for Issue #241
Our current Market Bias with Timer Digest is LONG SPX as of Friday MAR 23 at 2588.26
Our previous Market Bias was SHORT SPX as of MAR 16 at 2752.01
Here are the trade parameters for this week:
SPX Secondary Profit Target for last 20% of our position = 2790
SPX Primary Profit Target for first 80% of our position = 2755
SPX BreakEven Stop (Last Open) for last 20% of our position = 2726
SPX Money Management Stop for 100% of our position = 2715
|
| Action |
Asset |
Expiration |
Strike |
Option |
| BUY |
SPY |
Friday JUN 15 |
274 |
Calls |
| SELL SHORT |
SPY |
Friday JUN 15 |
279 |
Calls |
| You need to execute both legs and hold it as a Call-Spread.
|
Note A:
Once the Primary Profit Target has been reached, traders are advised to close 80% of their position in order to lock in profits. The remaining balance can be carried over with a BreakEven STOP, based on the SPX level at the time of entry, in order to make the trade a zero-risk trade with the final position running to reach the Secondary Profit Target.
Once either Secondary Profit or Money Management (BreakEven STOP after the 80% peel-off) is hit, our Option/ETF trade for that week is over. Go to Cash and wait for the next PMT Issue.
Note B:
When we change our Market Bias with Timer Digest, You need to go FLAT asap. With PMT Pro, that is before the Close that day and with the basic PMT, at the open of the next day. The following trading day, we will issue new SPX targets and a new SPY options trade, as long our new market bias with Timer Digest is NOT flat.
Fari Hamzei
|
|
|
|
|
|
Sunday, May 20, 2018, 1100ET
Market Timing Charts, Analysis & Commentary for Issue #241
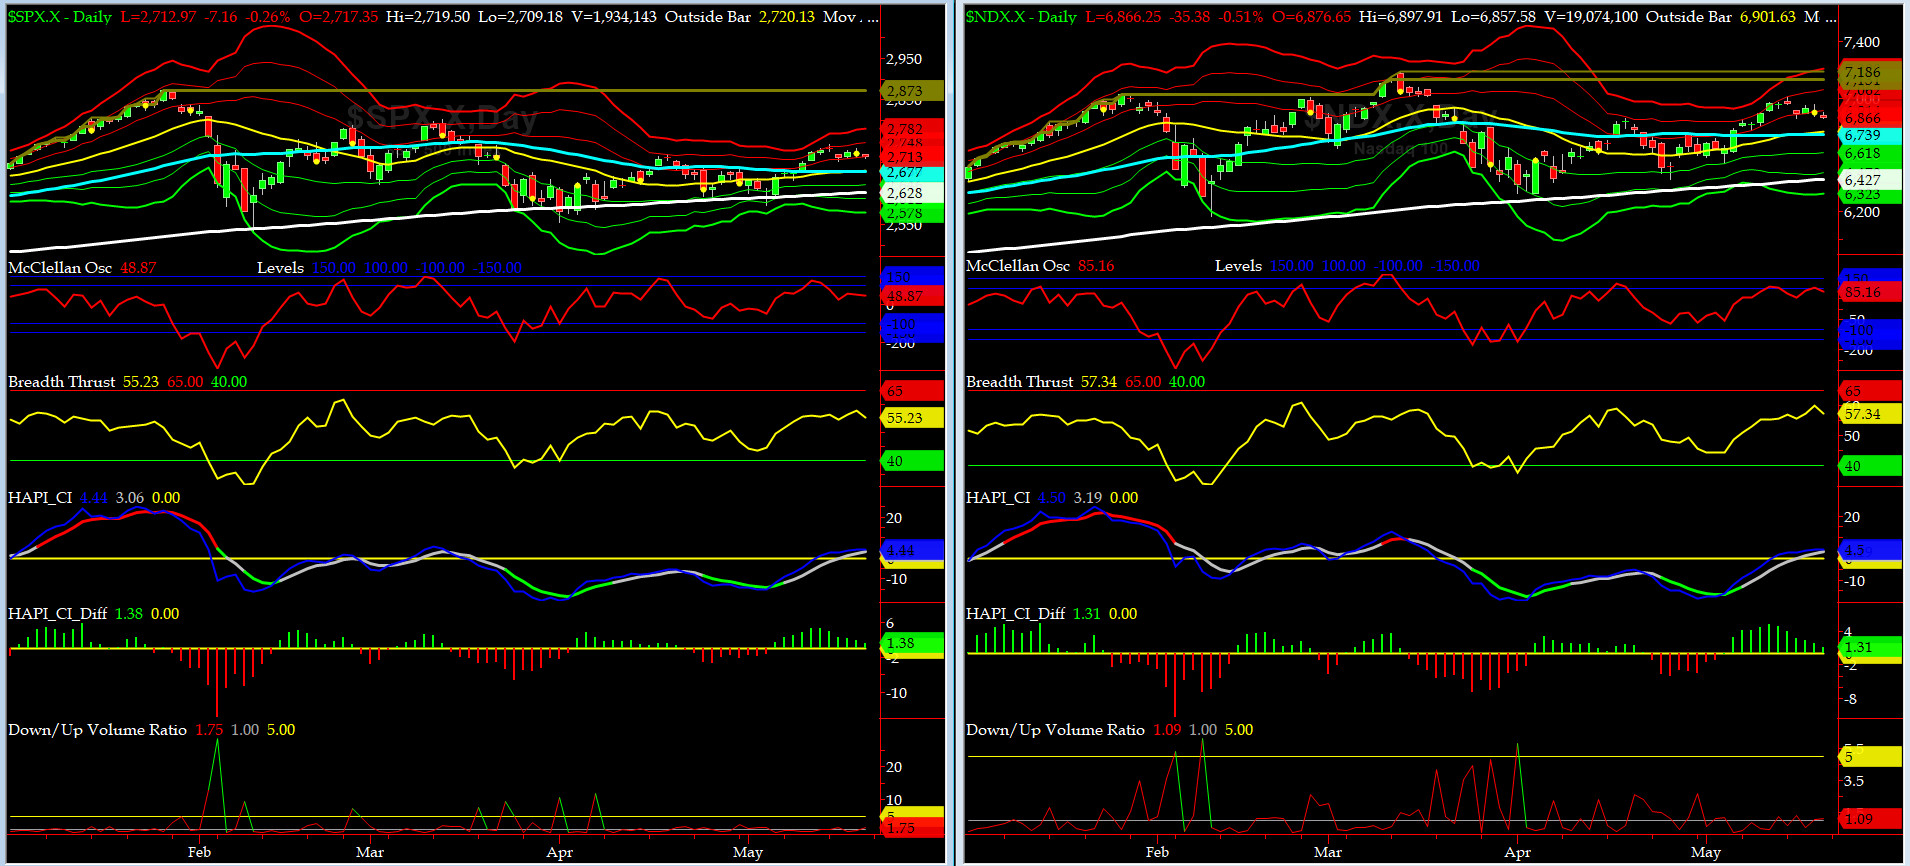
Timer Charts of S&P-500 Cash Index (SPX) + NASDAQ-100 Cash Index (NDX)
Most recent S&P-500 Cash Index (SPX): 2712.97 down -14.75 (down -0.54%) for the week ending on Friday, May 18, 2018, which closed at its +1 sigma.
SPX ALL TIME INTRADAY HIGH = 2872.87 (reached on Friday, Jan 26, 2018)
SPX ALL TIME CLOSING HIGH = 2872.87 (reached on Friday, Jan 26, 2018)
Current DAILY +2 Sigma SPX = 2748 with WEEKLY +2 Sigma = 2856
Current DAILY 0 Sigma (20 day MA) SPX = 2680 with WEEKLY 0 Sigma = 2712
Current DAILY -2 Sigma SPX = 2612 with WEEKLY -2 Sigma = 2553
NYSE McClellan Oscillator = +49 (-150 is start of the O/S area; around -275 to -300 area or lower, we go into the �launch-pad� mode, over +150, we are in O/B area)
NYSE Breadth Thrust = 55.2 (40 is considered as oversold and 65 as overbought)
Speaking of Sausage Ops, we went nowhere fast the whole week (plus on Monday, our broker was very happy with us (but not for us). On Friday, he FDXed us some Godiva & flowers. ROFLOL.
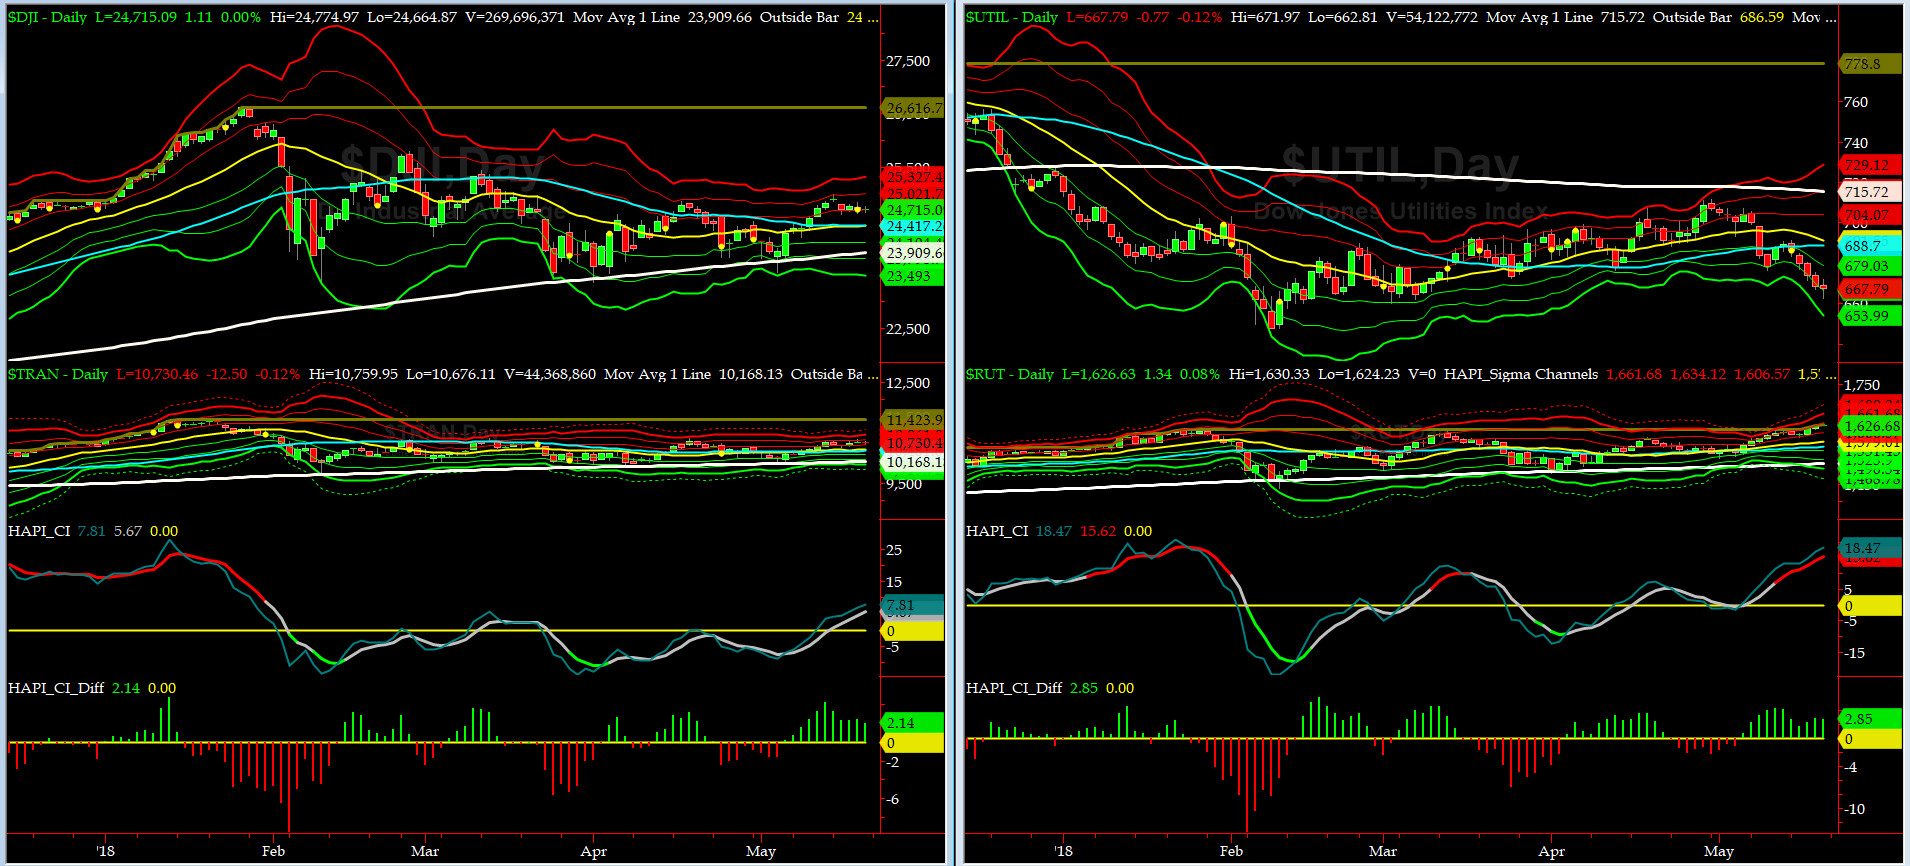
Canaries [in the Coal Mine] Chart for DJ TRAN & RUT Indices
200-Day MA DJ TRAN = 10,168 or 5.5% below DJ TRAN (max observed in last 7 yrs = 20.2%, min = -20.3%)
200-Day MA RUT = 1512 or 7.5% below RUT (max observed in last 7 yrs = 21.3%, min = -22.6%)
DJ Transportation Index (proxy for economic conditions 6 to 9 months hence) went nowhere fast. On Thursday, DJT (not Grumpino) punched thru the 10,770 level but not on the closing basis.
Russell 2000 Small Caps Index (proxy for Risk ON/OFF) had another great week, and as we wrote here last Sunday, this week, RUT logged three new ATHs. RISK is UBER ON.
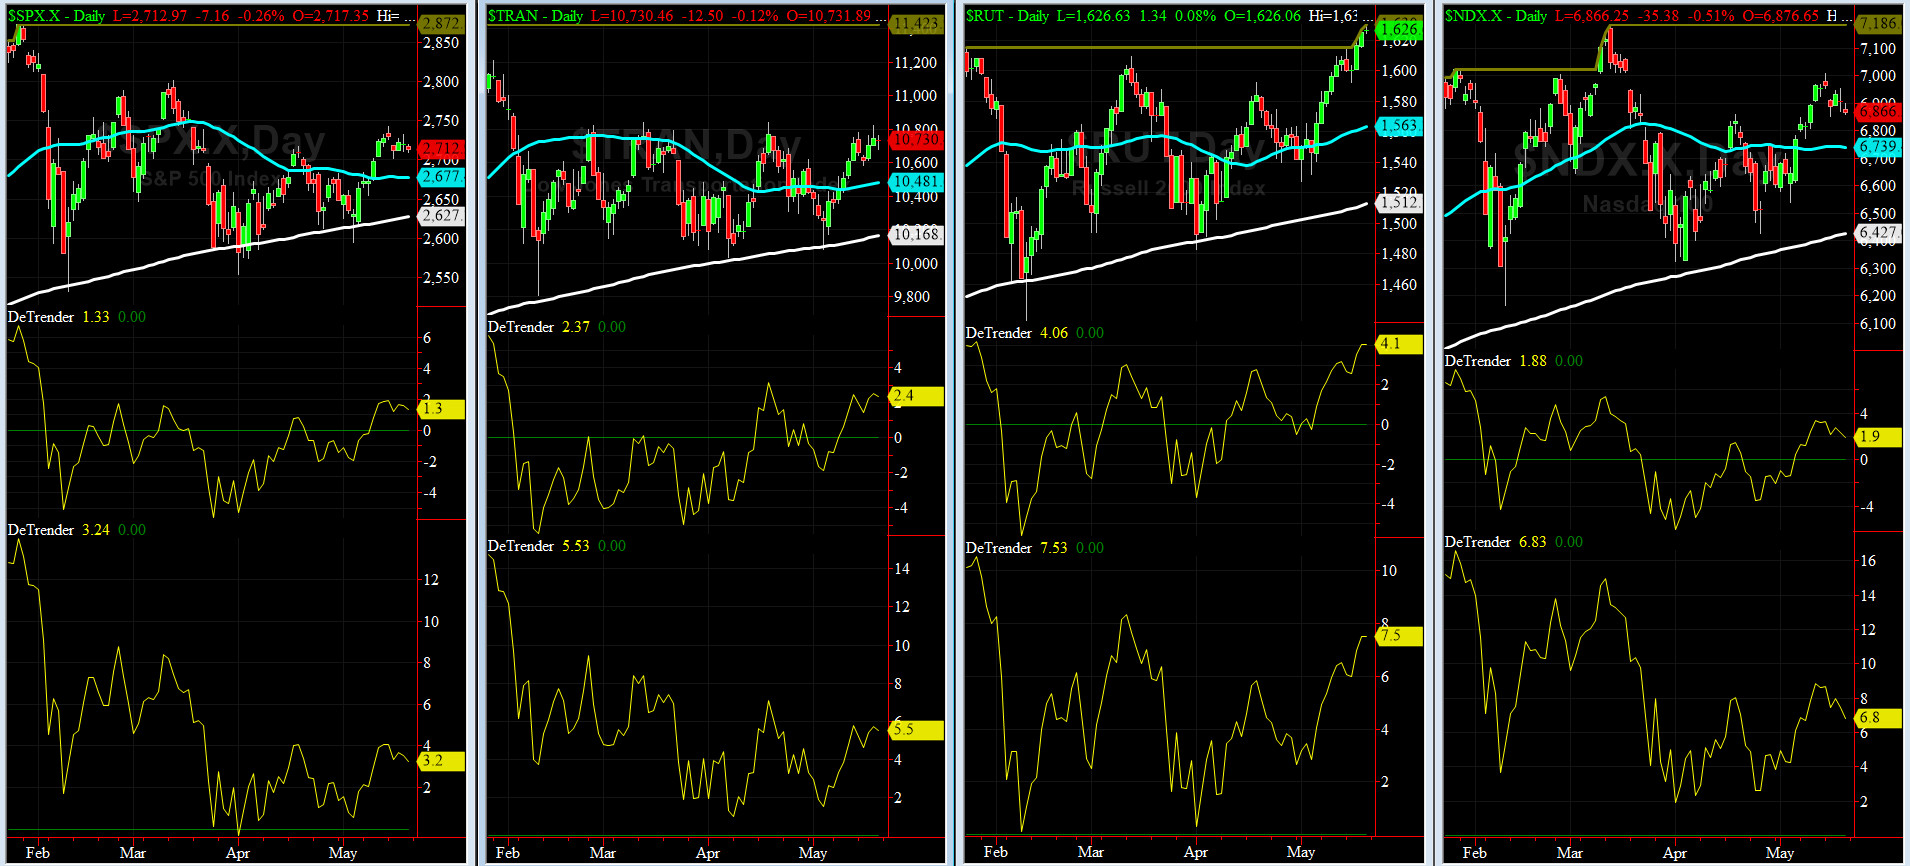
DeTrenders Charts for SPX, NDX, TRAN & RUT Indices
50-Day MA SPX = 2677 or 1.3% below SPX (max observed in last 7 yrs = +8.6%, min = -9.3%)
200-Day MA SPX = 2627 or 3.2% below SPX (max observed in last 7 yrs = 15.2%, min = -14%)
All EIGHT of our EIGHT DeTrenders remain in POSITIVE territory. The DeTrenders for DJ Tran & RUT will continue to be harbingers of future price behavior in broad indices.
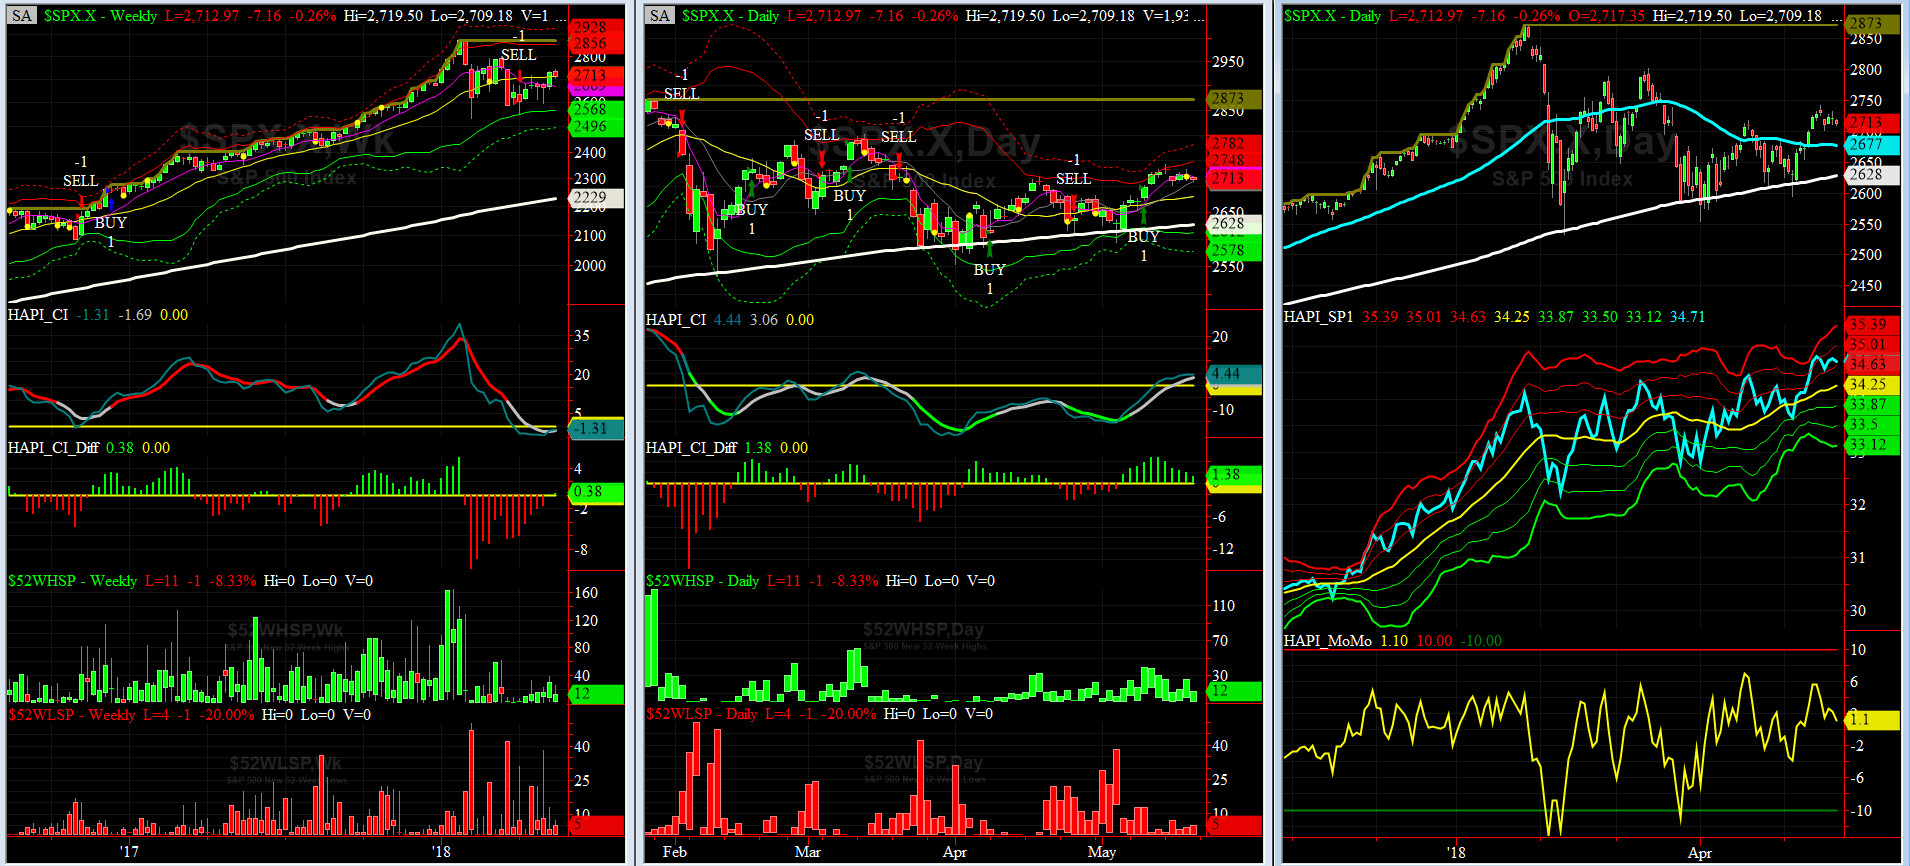
HA_SP1_Momo Chart
WEEKLY Timing Model = on a SELL Signal since Friday 4/06/118 CLOSE at 2604
DAILY Timing Model = on a BUY Signal since Wednesday 5/9/18 CLOSE at 2697
Max SPX 52wk-highs reading last week = 26 (over 120-140, the local maxima is in)
Max SPX 52wk-Lows reading last week = 7 (over 40-60, the local minima is in)
HA_SP1 again closed near its +1 sigma channels
HA_Momo = +1.1 (reversals most likely occur above +10 or below -10)
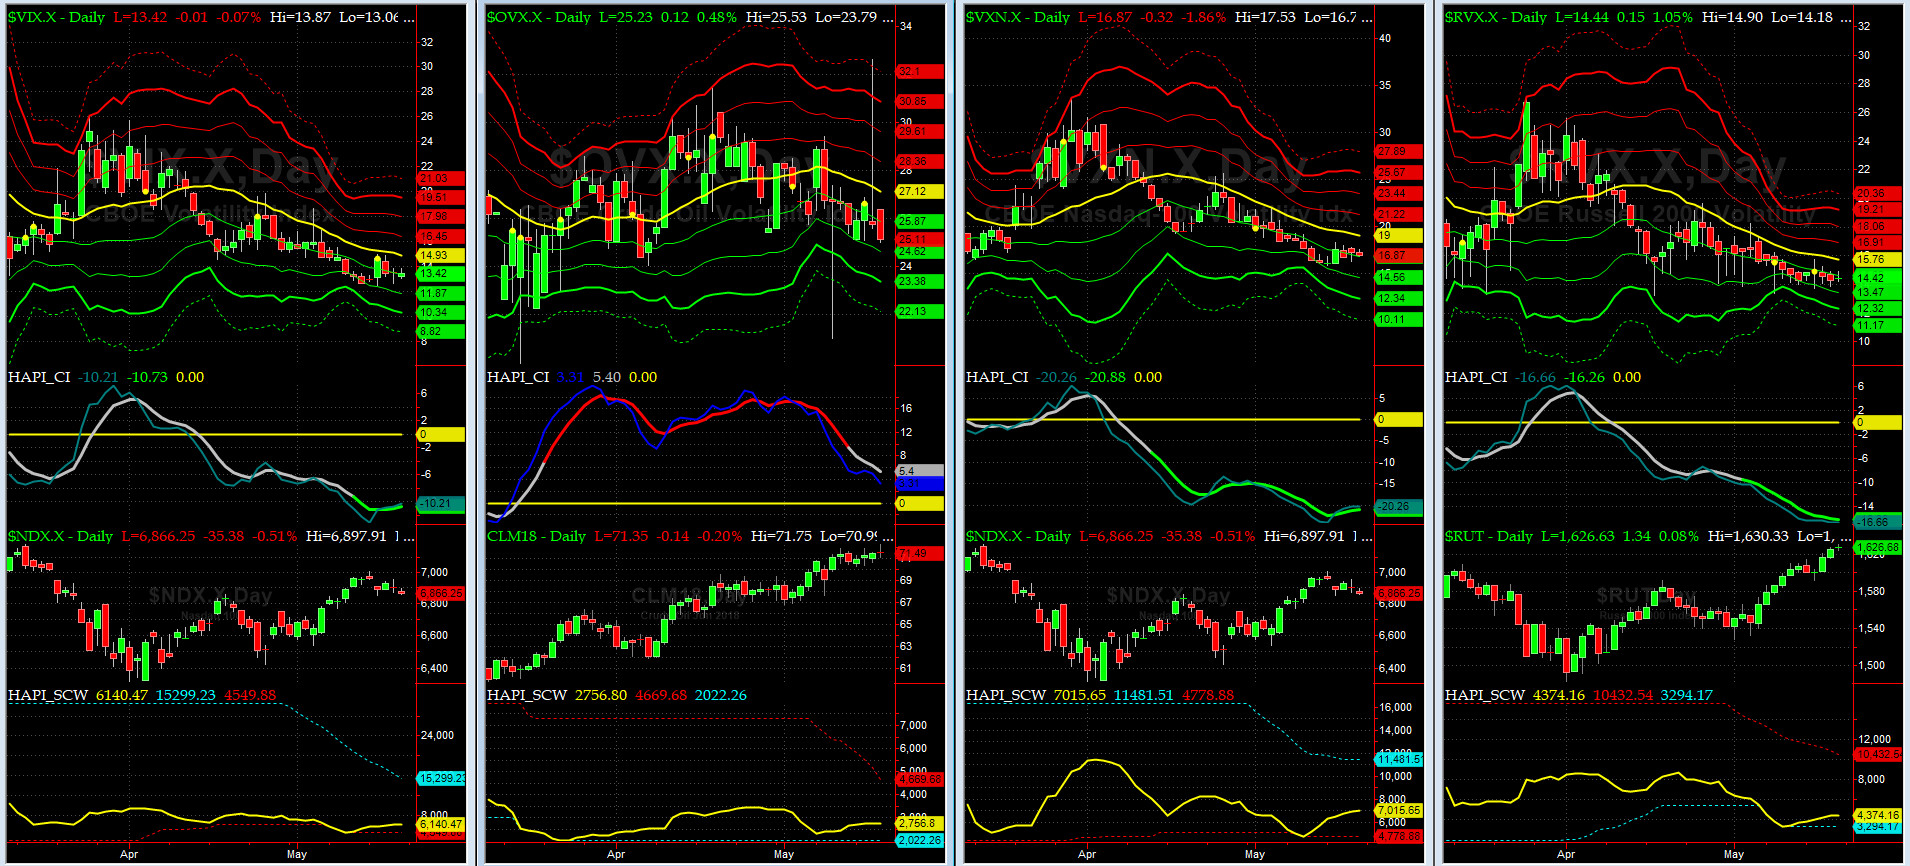
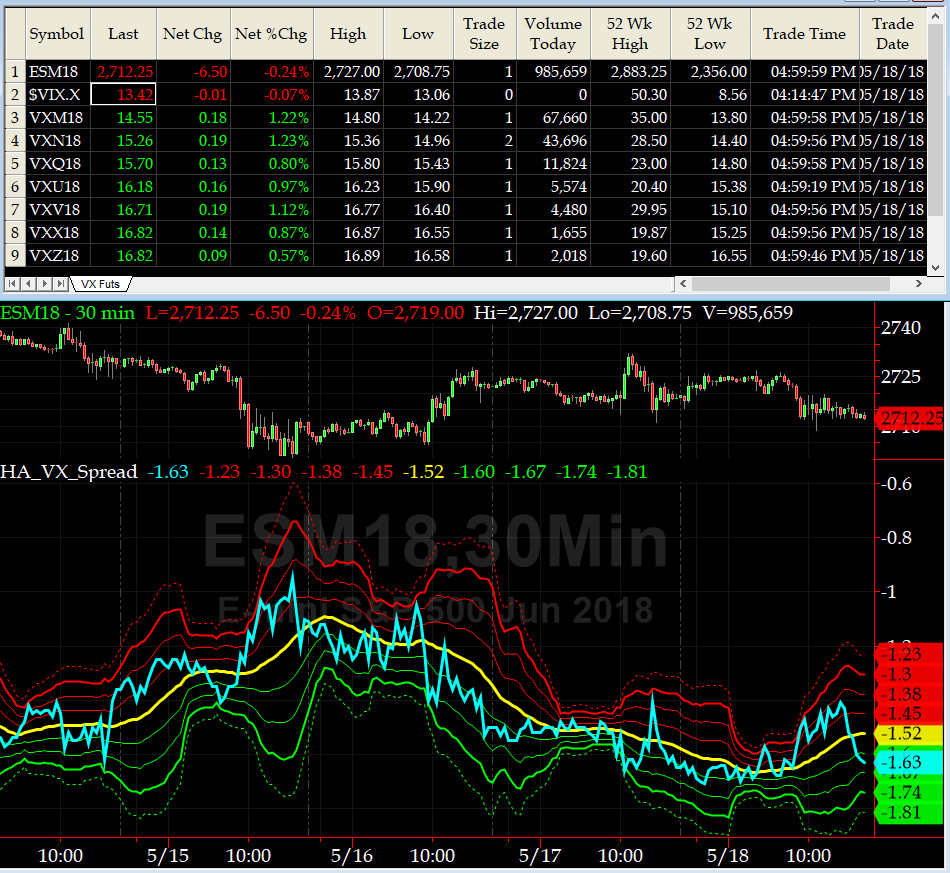
Vol of the Vols Chart
VIX currently stands at 13.42, just about its -1 sigma (remember it's the VIX volatility pattern aka "its sigma channels" that matters, and not the level of VIX itself (this is per Dr. Robert Whaley, a great mentor and inventor of original VIX, now called VXO). VIX usually peaks around a test of its +4 sigma).
Even the VIX trade got a tad sausagie........
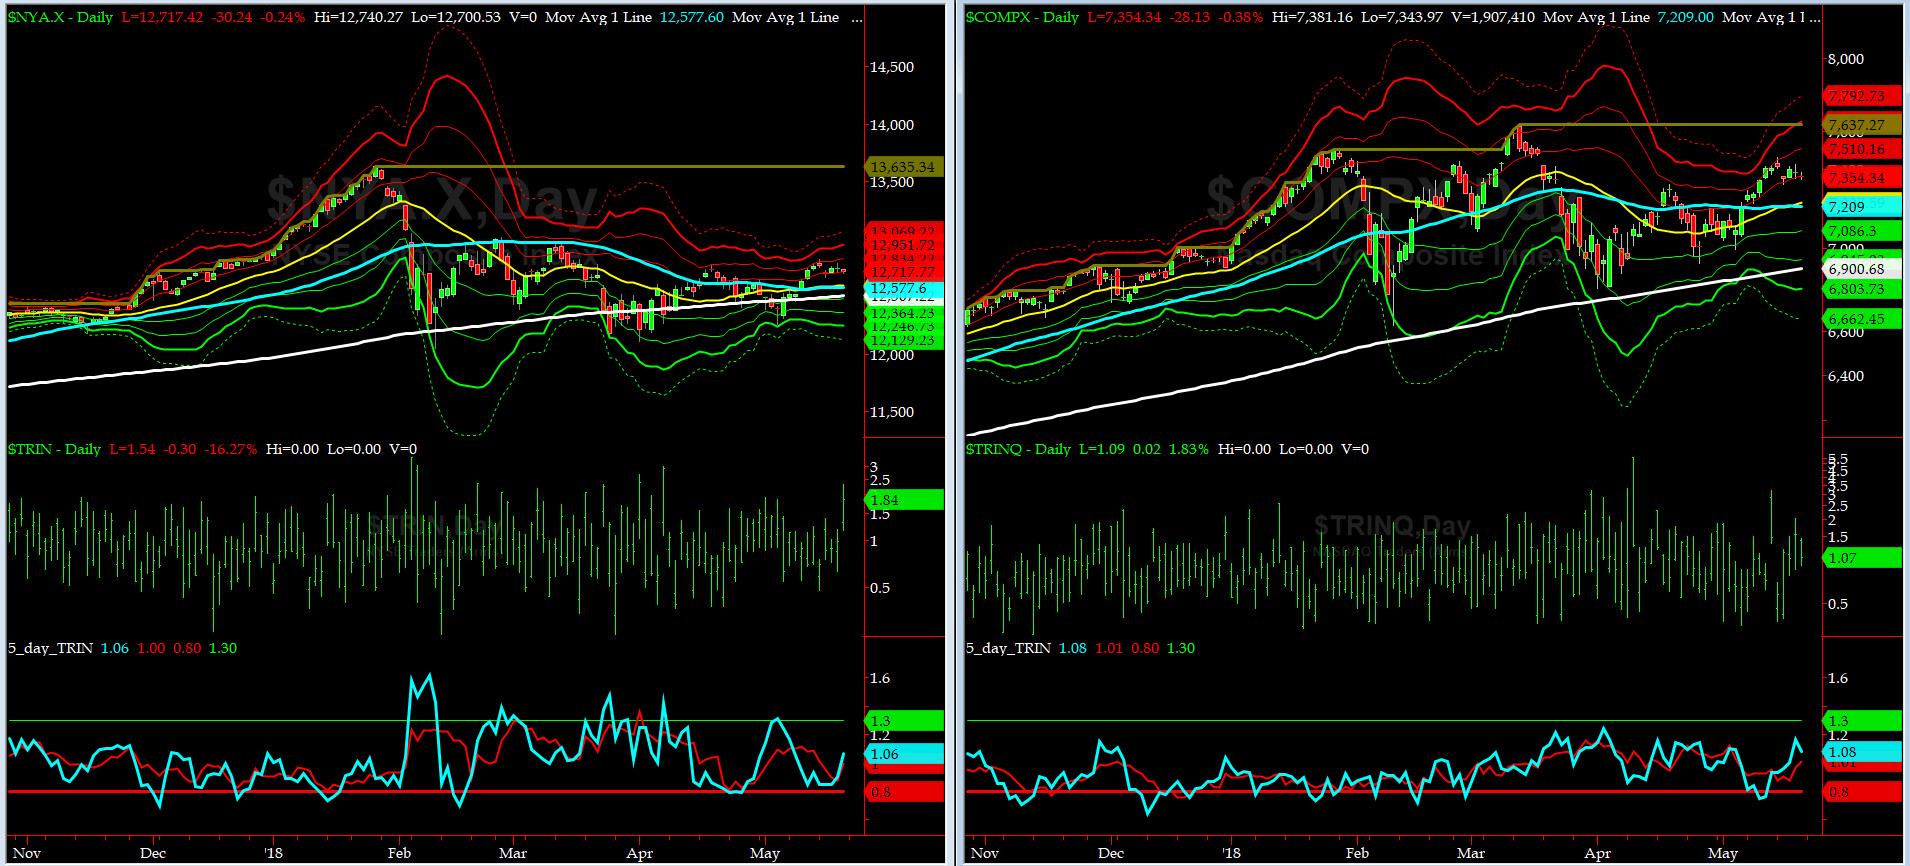
5-day TRIN & TRINQ Charts
Both NYSE & NASDAQ 5-day TRINs are in the NEUTRAL zone.
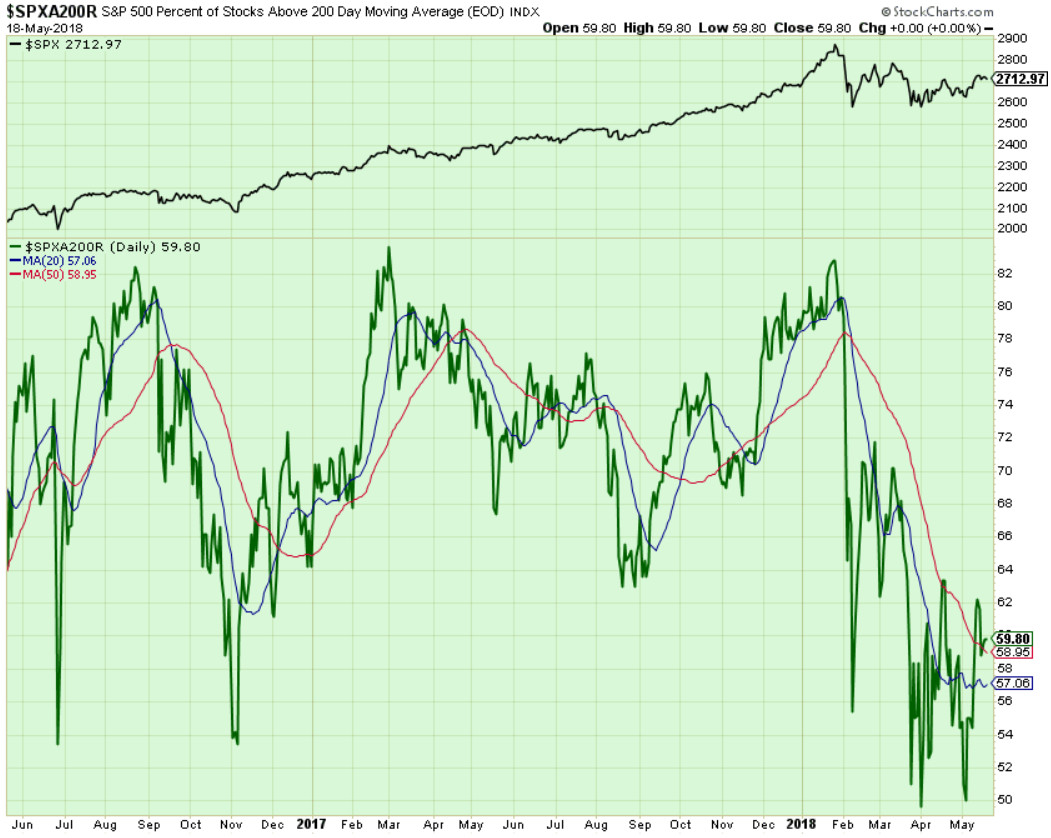
Components of SPX above their respective 200day MA Chart
This scoring indicator ended up at 60% level after a sausagie week. Again, we are not out of the woods till we get above at least 65s.
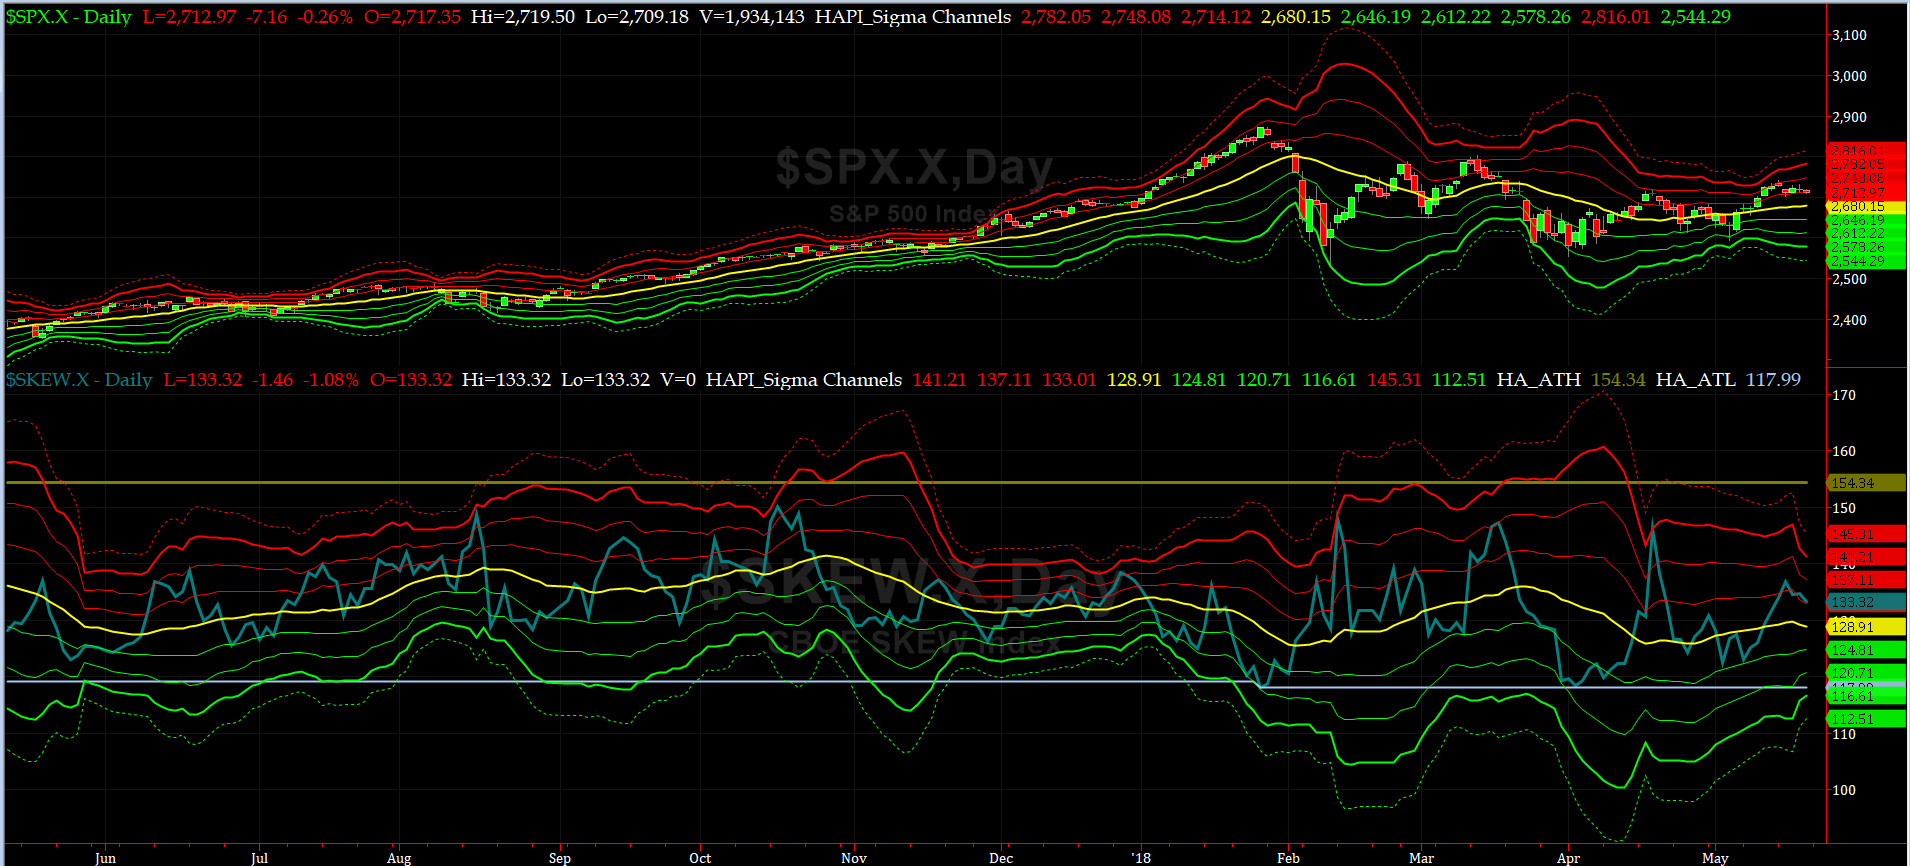
SPX SKEW (Tail Risk) Chart
On Monday, SPX SKEW (Tail Risk) closed near 133, or near its +1 sigma (normal = 120-125, range 100-150).
Is all quiet on the Eastern & Mid-Western Fronts? Smart Money says no longer says YES. More tea? @Capt_Tiko emphatically says YES.
How to interpret the value of SPX SKEW? (from CBOE white paper on SKEW)

3-month VIX Futures Spread(VX) Chart
This popular timing indicator, now long June, and short September VIX Futures closed at near -1.63. This is very NEUTRAL.
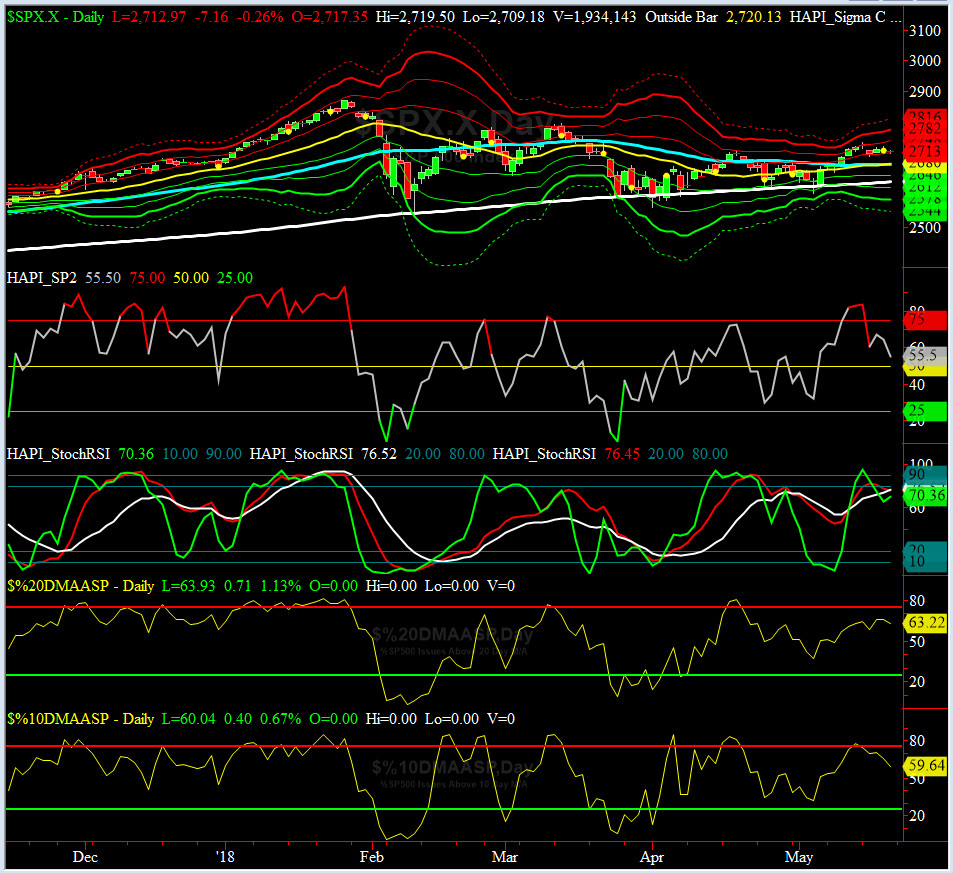
HA_SP2 Chart
HA_SP2 = 55.5 (Buy signal <= 25, Sell Signal >= 75)
As mentioned last week, this coveted prop indicator was very overbought and eased off a bit this week.
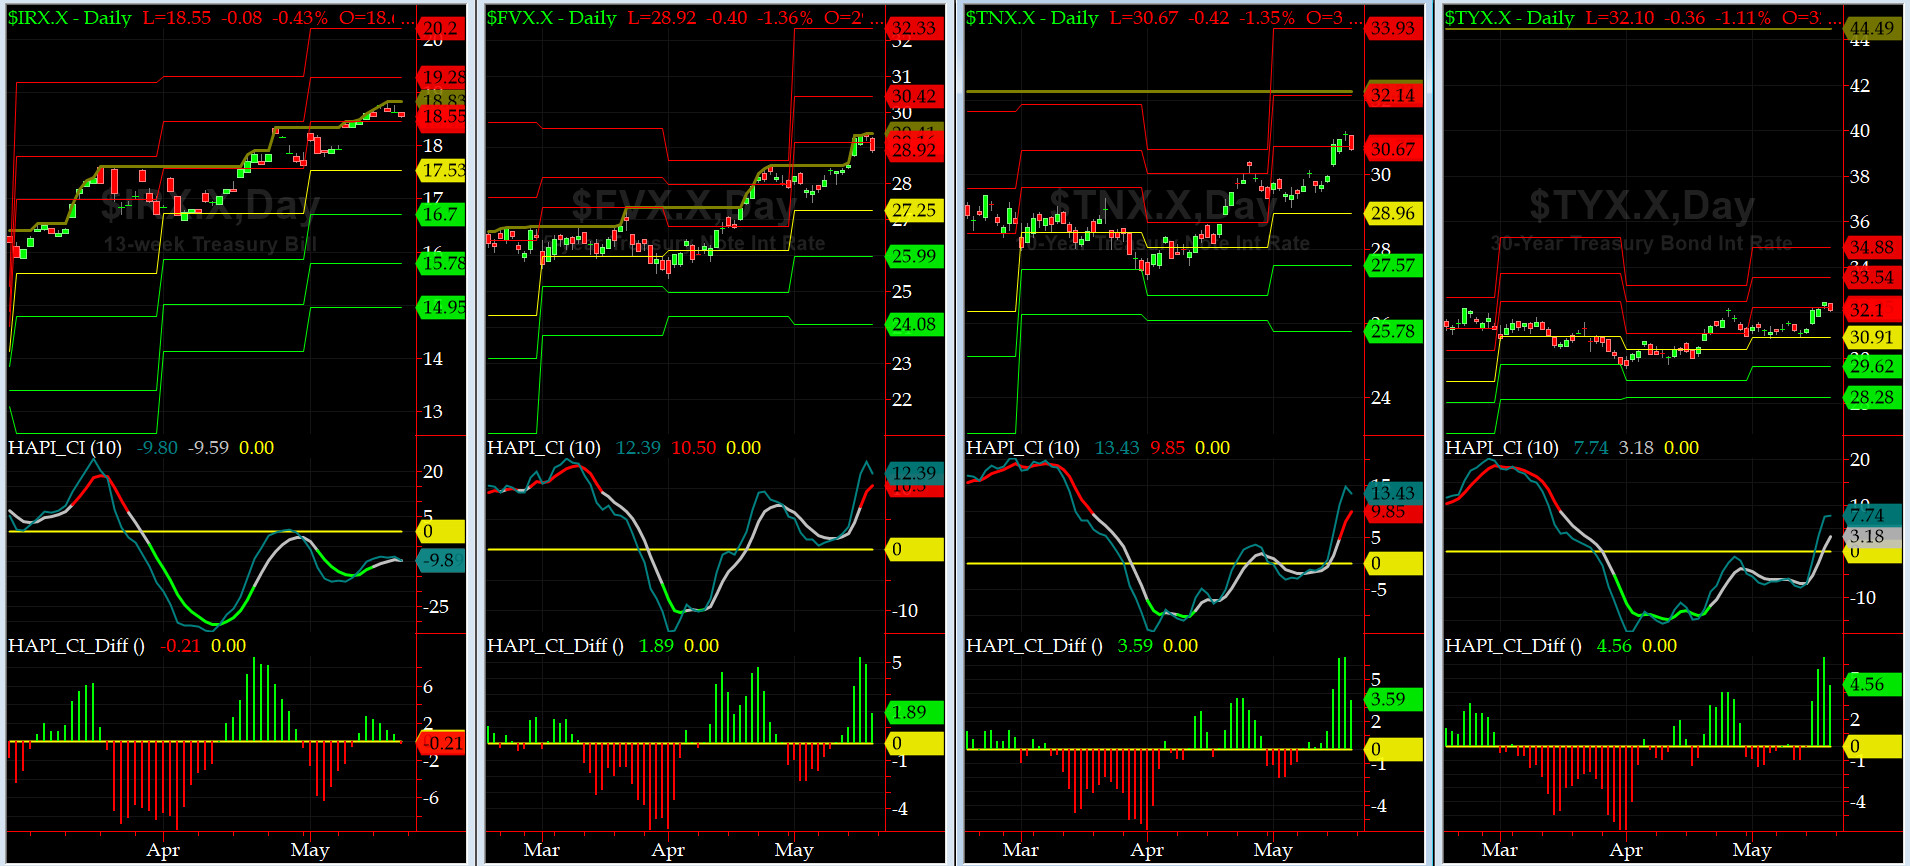
US Treasury T-Notes & T-Bonds Yields Chart
Our beloved Maury & the Mrs were seen cart wheeling on Rodeo Drive in BH. Maury can now lend out at higher rate and buy his fav tech stocks much cheaper. That would make his monthly contributions to Mrs Maury's Shoe Room, as stipulated in their 2nd prenup, a lot more palpable. BH Marriage Counselors/Analysts call that "Win-Win." ROFLOL.
Fari Hamzei
|
|
|
|
|
|
Customer Care:
|
|
|
|
|
|
|
 |
 |
|
 |
|
 |
 |
 |
HA YouTube Channel ::: HA Blog ::: Testimonials ::: Tutorials & FAQs ::: Privacy Policy
|
Trading Derivatives (Options & Futures) contains substantial risk and is not for every investor. An investor could potentially lose all or more than his/her initial investment.
Only risk capital should be used for trading and only those with sufficient risk capital should consider trading derivatives. Past performance is not
necessarily indicative of future results. Testimonials appearing on this website may not be representative of other clients or customers
and are not a guarantee of future performance or success.
|
| (c) 1998-2025, Hamzei Analytics, LLC.® All Rights Reserved. |
|
|