|
Sunday, May 27, 2018, 1630ET
Market Timing Charts, Analysis & Commentary for Issue #242
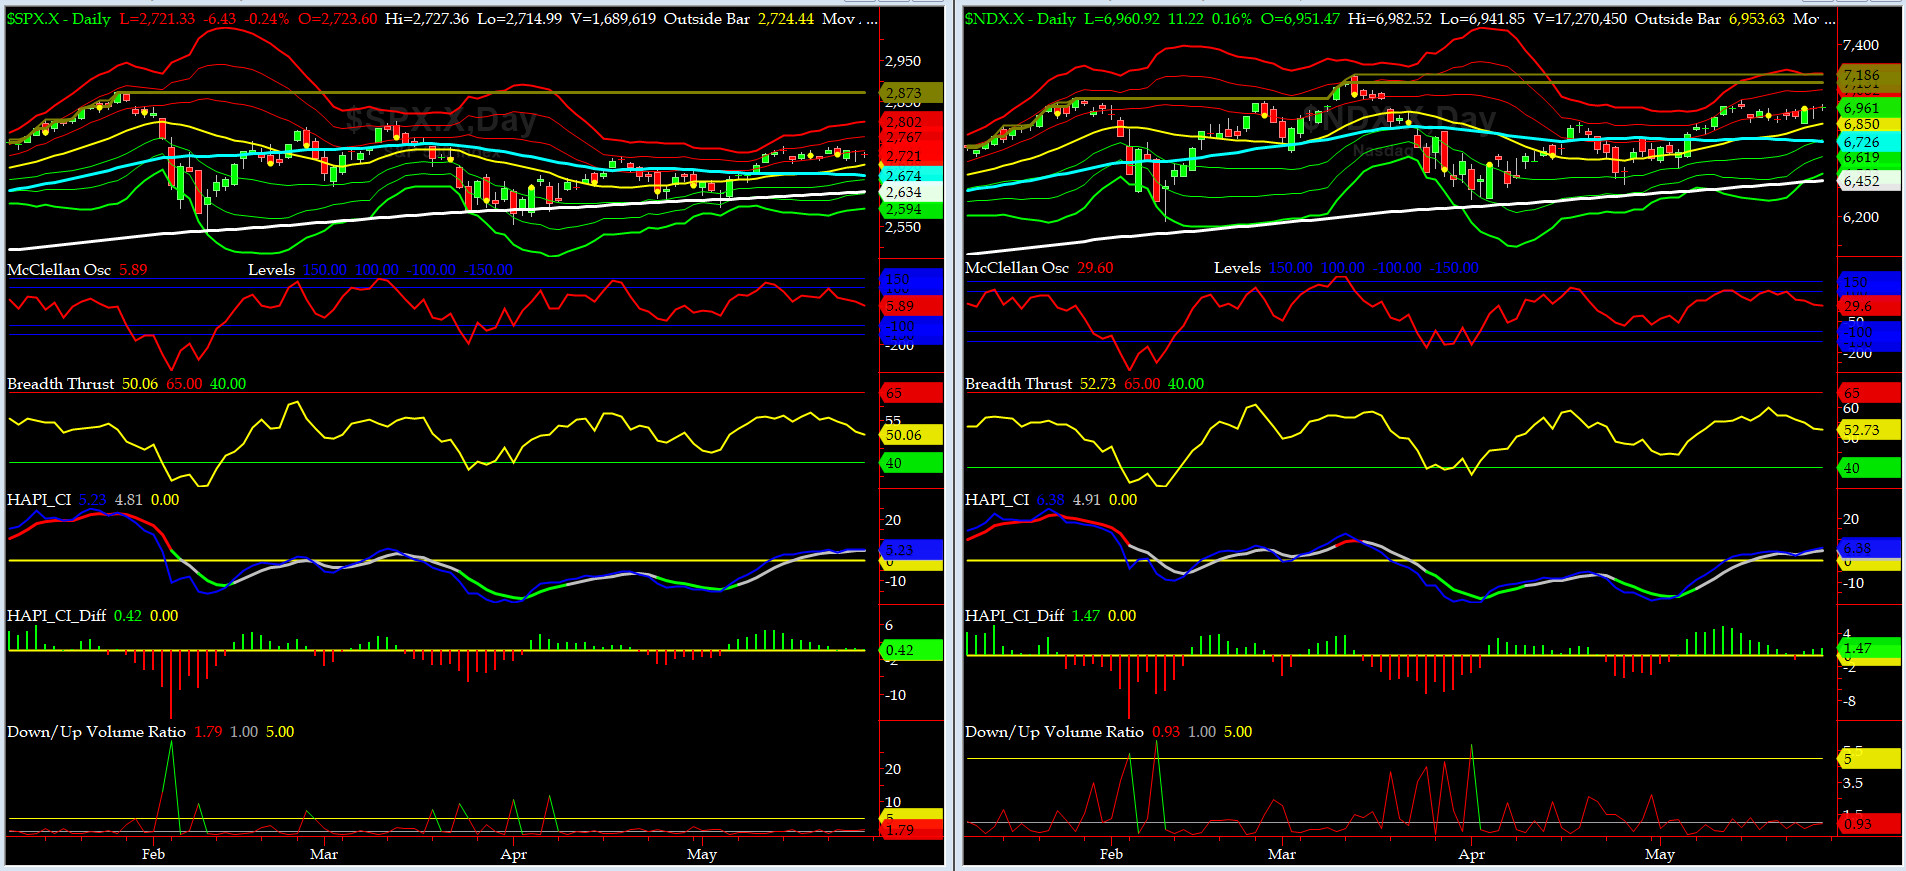
Timer Charts of S&P-500 Cash Index (SPX) + NASDAQ-100 Cash Index (NDX)
Most recent S&P-500 Cash Index (SPX): 2721.33 +8.36 (up +0.31%) for the week ending on Friday, May 25, 2018, which closed at its +1/2 sigma.
SPX ALL TIME INTRADAY HIGH = 2872.87 (reached on Friday, Jan 26, 2018)
SPX ALL TIME CLOSING HIGH = 2872.87 (reached on Friday, Jan 26, 2018)
Current DAILY +2 Sigma SPX = 2767 with WEEKLY +2 Sigma = 2854
Current DAILY 0 Sigma (20 day MA) SPX = 2698 with WEEKLY 0 Sigma = 2711
Current DAILY -2 Sigma SPX = 2629 with WEEKLY -2 Sigma = 2568
NYSE McClellan Oscillator = +6 (-150 is start of the O/S area; around -275 to -300 area or lower, we go into the �launch-pad� mode, over +150, we are in O/B area)
NYSE Breadth Thrust = 50.1 (40 is considered as oversold and 65 as overbought)
Again speaking of Sausage Ops, this past week was a non-event on closing basis, but we must note that there was considerable intraday range (vol). And we got more Godiva from our broker.
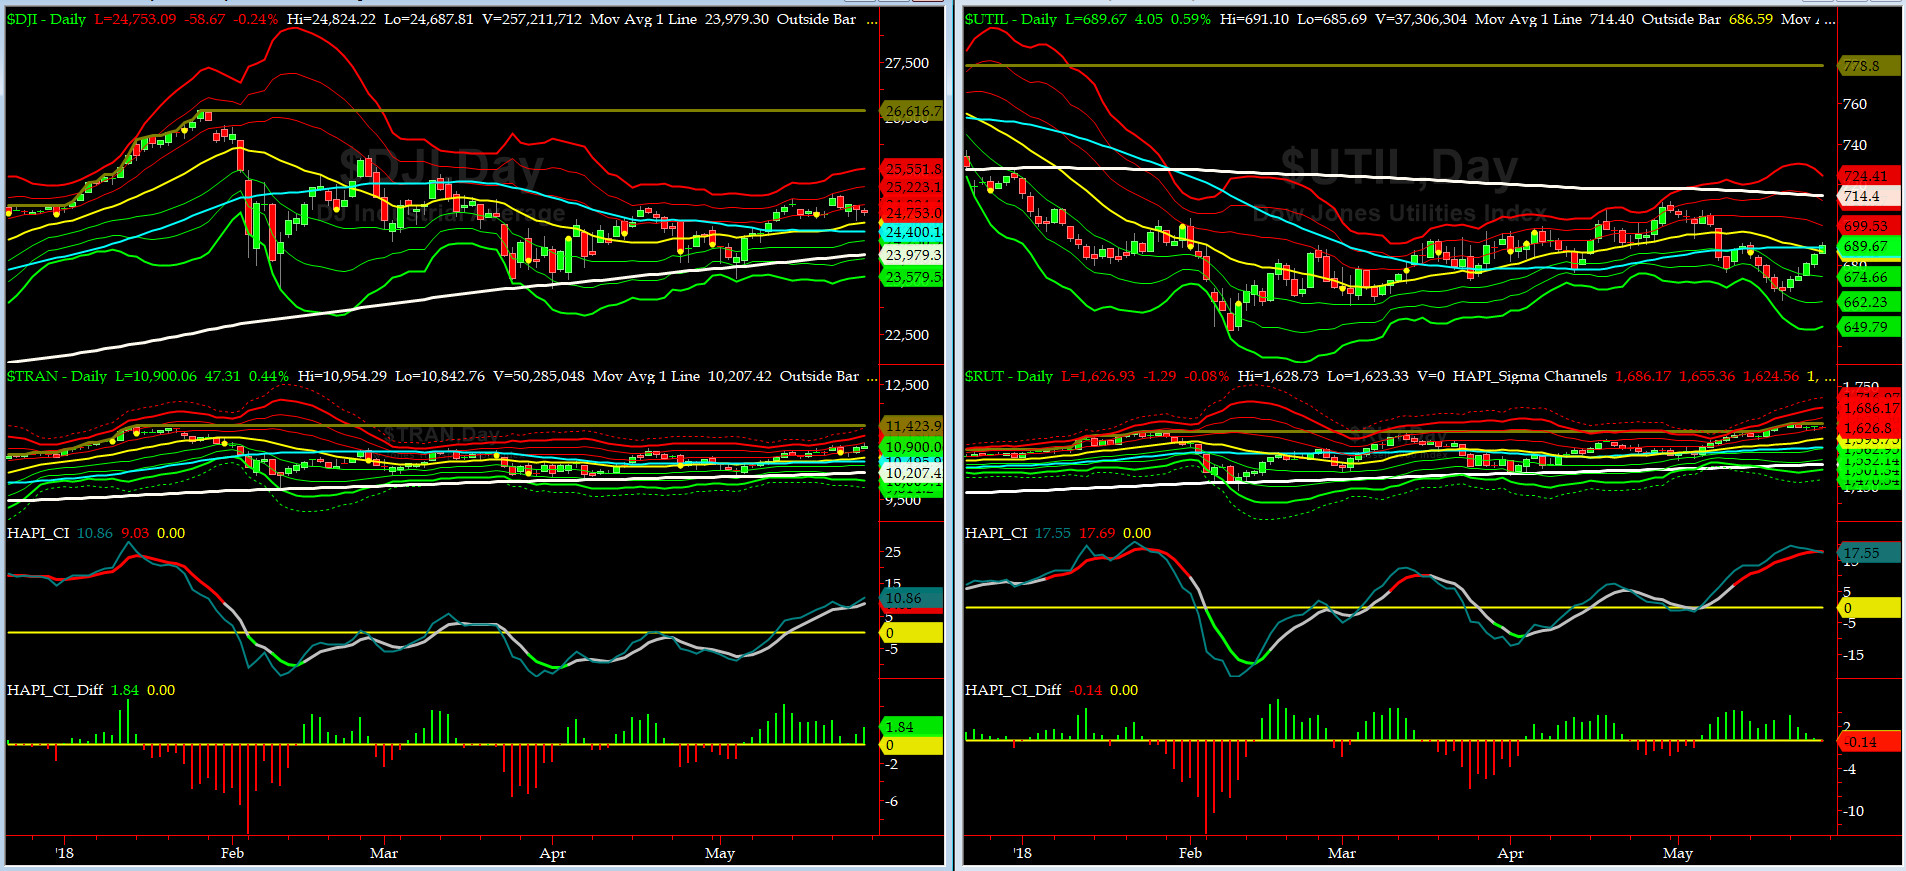
Canaries [in the Coal Mine] Chart for DJ TRAN & RUT Indices
200-Day MA DJ TRAN = 10,207or 6.8% below DJ TRAN (max observed in last 7 yrs = 20.2%, min = -20.3%)
200-Day MA RUT = 1517 or 7.2% below RUT (max observed in last 7 yrs = 21.3%, min = -22.6%)
DJ Transportation Index (proxy for economic conditions 6 to 9 months hence) basically went nowhere fast after attempting a number of channel breakout which was faded.
Russell 2000 Small Caps Index (proxy for Risk ON/OFF) had its third UP week in a row, and as we wrote here last 2 Sundays, this past week, RUT logged two new ATHs before retreating mildly. RISK is UBER ON.
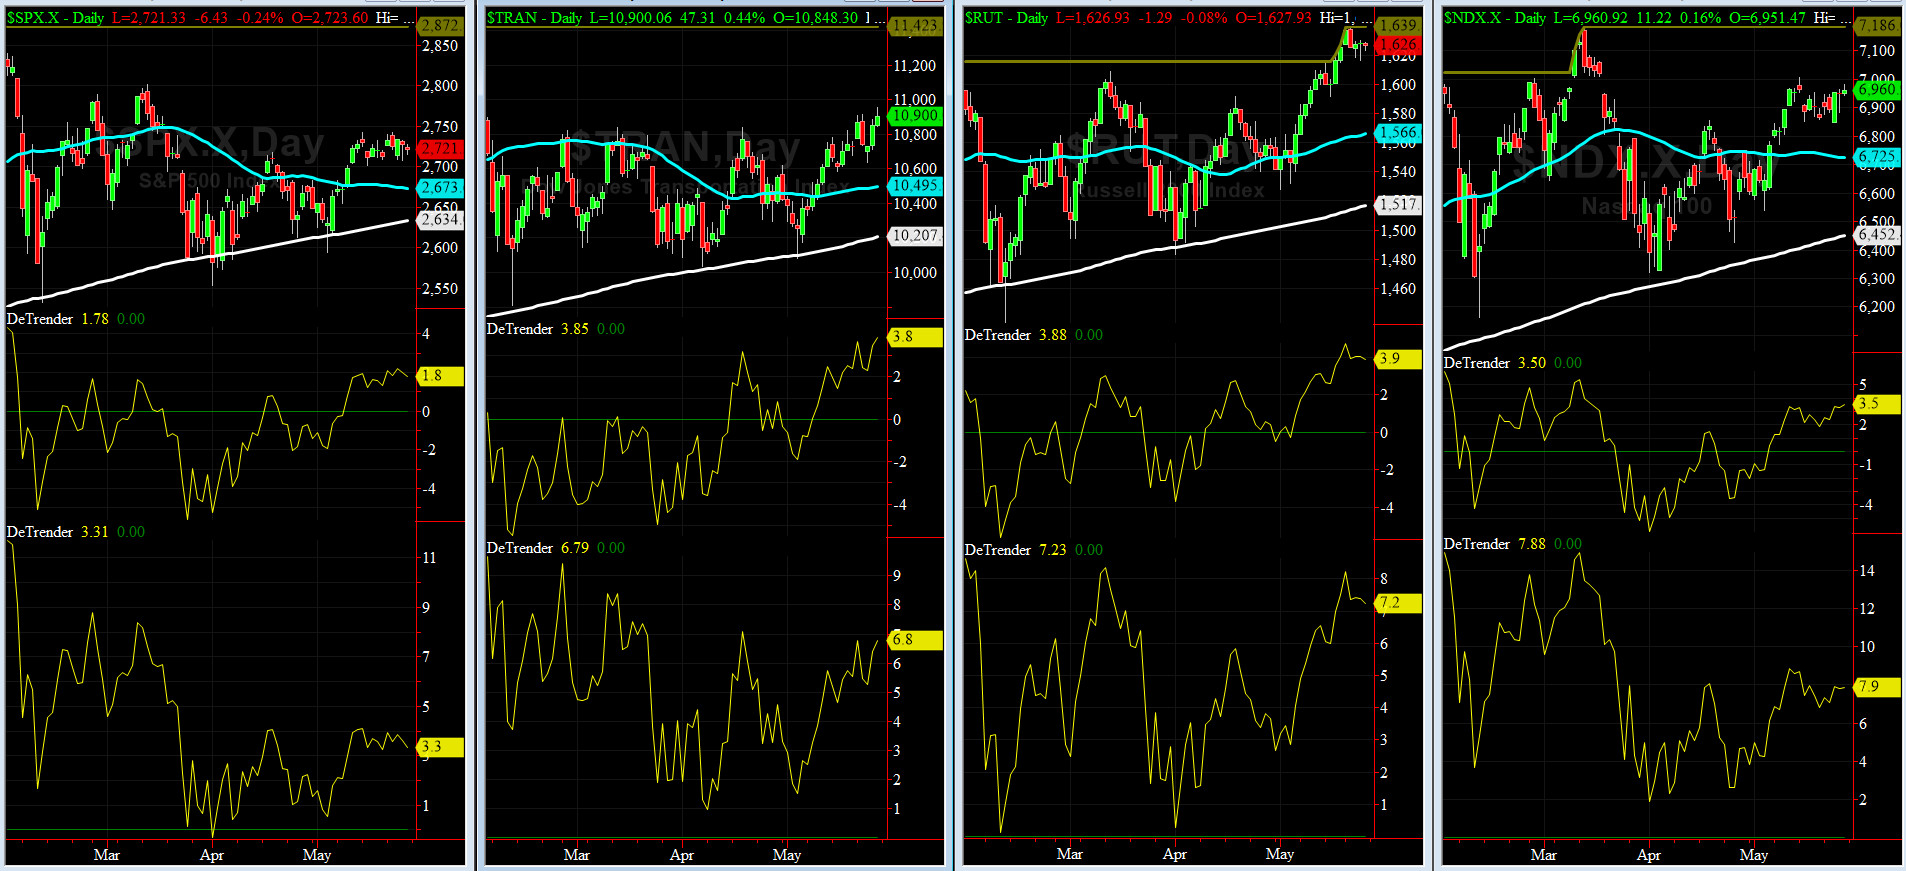
DeTrenders Charts for SPX, NDX, TRAN & RUT Indices
50-Day MA SPX = 2673 or 1.8% below SPX (max observed in last 7 yrs = +8.6%, min = -9.3%)
200-Day MA SPX = 2634 or 3.3% below SPX (max observed in last 7 yrs = 15.2%, min = -14%)
All EIGHT of our EIGHT DeTrenders remain in POSITIVE territory. The DeTrenders for DJ Tran & RUT will continue to be harbingers of future price behavior in broad indices.
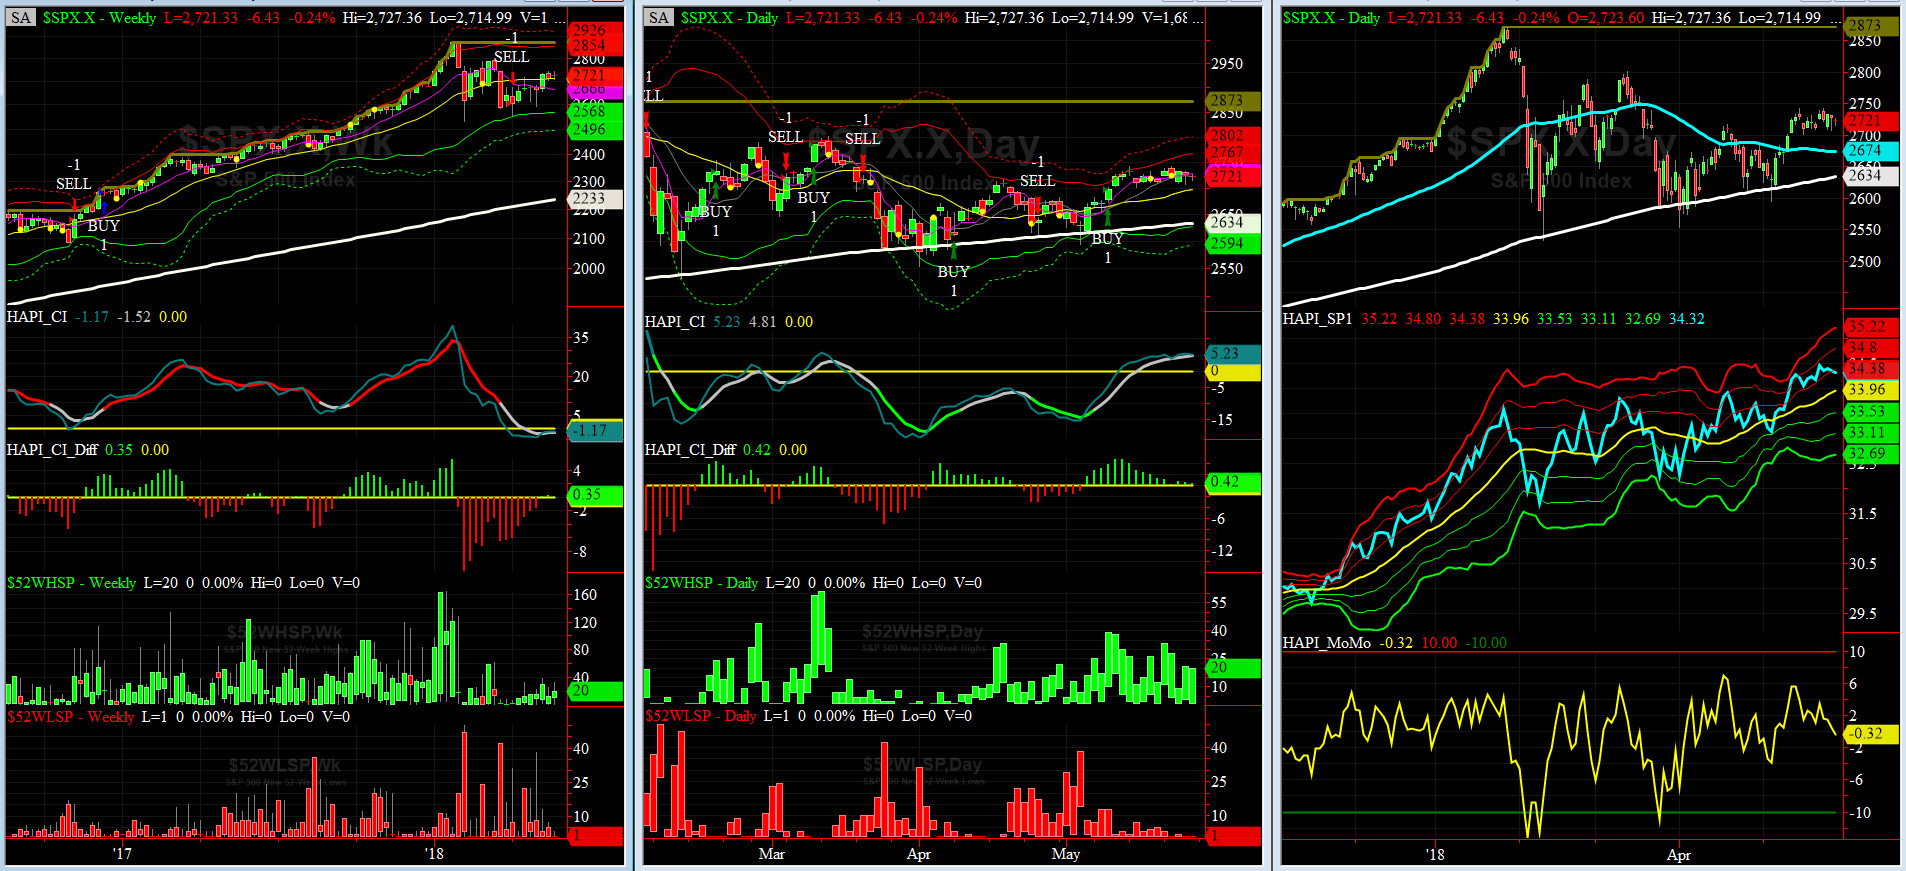
HA_SP1_Momo Chart
WEEKLY Timing Model = on a SELL Signal since Friday 4/06/118 CLOSE at 2604
DAILY Timing Model = on a BUY Signal since Wednesday 5/9/18 CLOSE at 2697
Max SPX 52wk-highs reading last week = 33 (over 120-140, the local maxima is in)
Max SPX 52wk-Lows reading last week = 3 (over 40-60, the local minima is in)
HA_SP1 closed just below its +1 sigma channels
HA_Momo = -0.3 (reversals most likely occur above +10 or below -10)
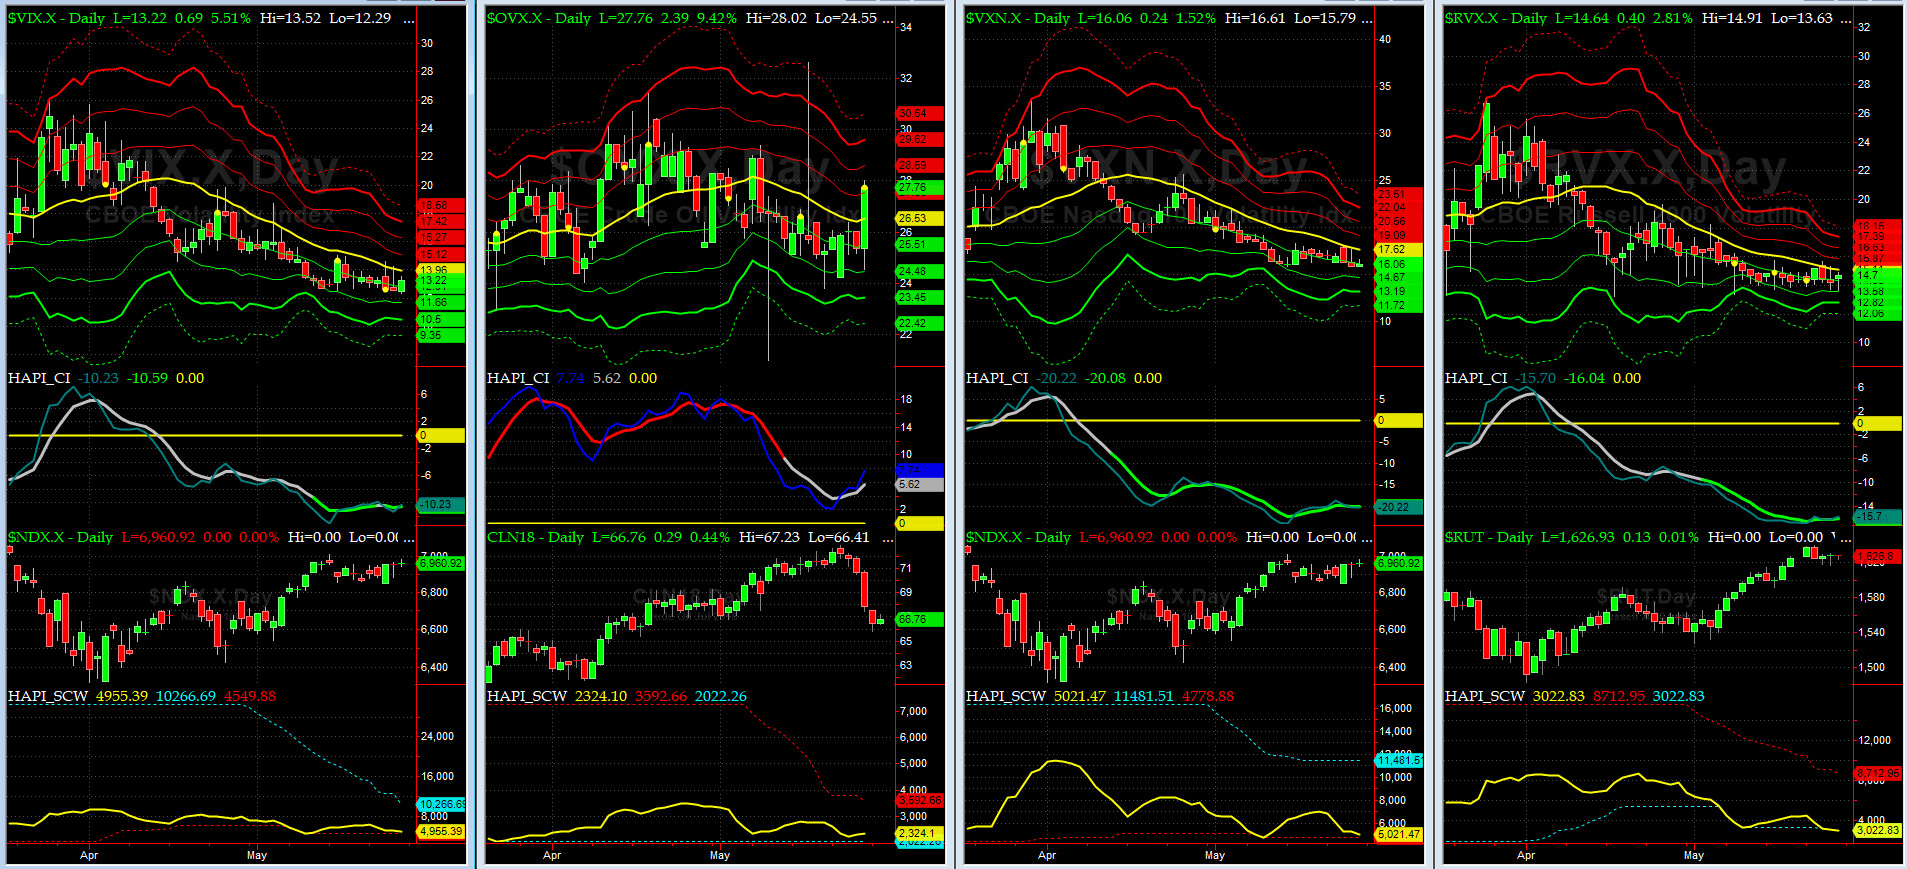
Vol of the Vols Chart
VIX currently stands at 13.22, just about its -0.5 sigma (remember it's the VIX volatility pattern aka "its sigma channels" that matters, and not the level of VIX itself (this is per Dr. Robert Whaley, a great mentor and inventor of original VIX, now called VXO). VIX usually peaks around a test of its +4 sigma).
The only vol trade this past week belonged to Crude Oil, rest were docile.
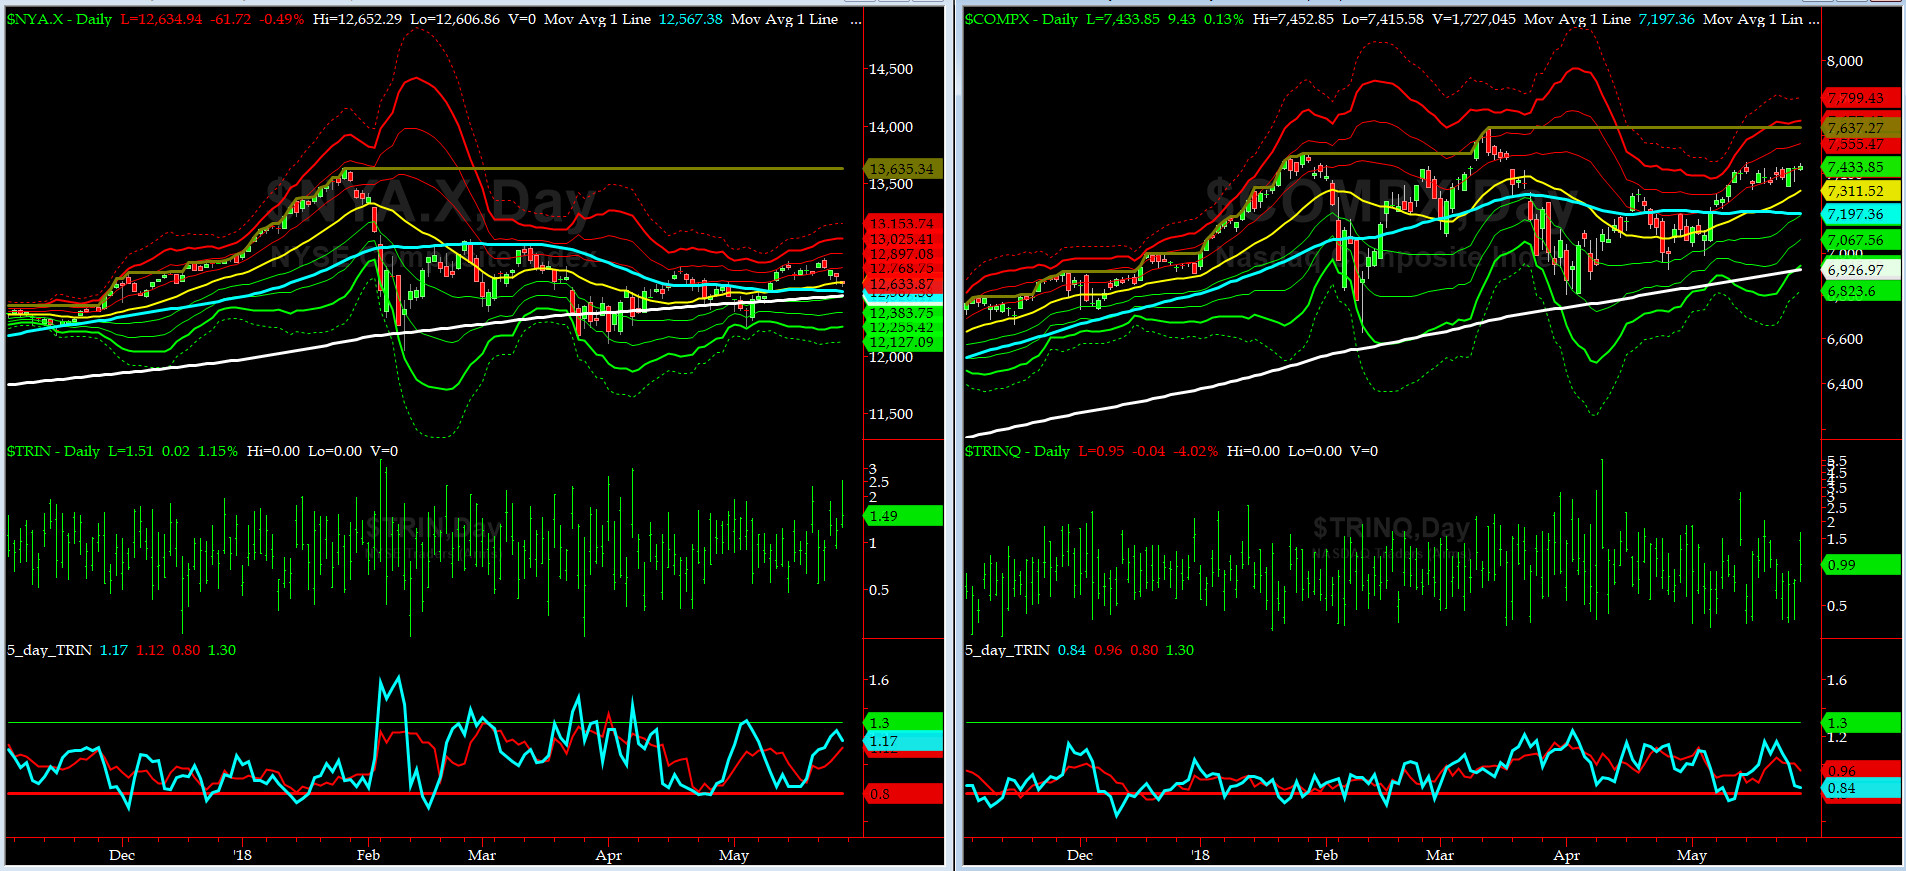
5-day TRIN & TRINQ Charts
While NYSE 5-day TRIN in near BUY zone, its NASDAQ brethren, 5-day TRINQ is near the SELL zone. Looking at NDX vs SPX chartpatterns clears this apparant confusion.
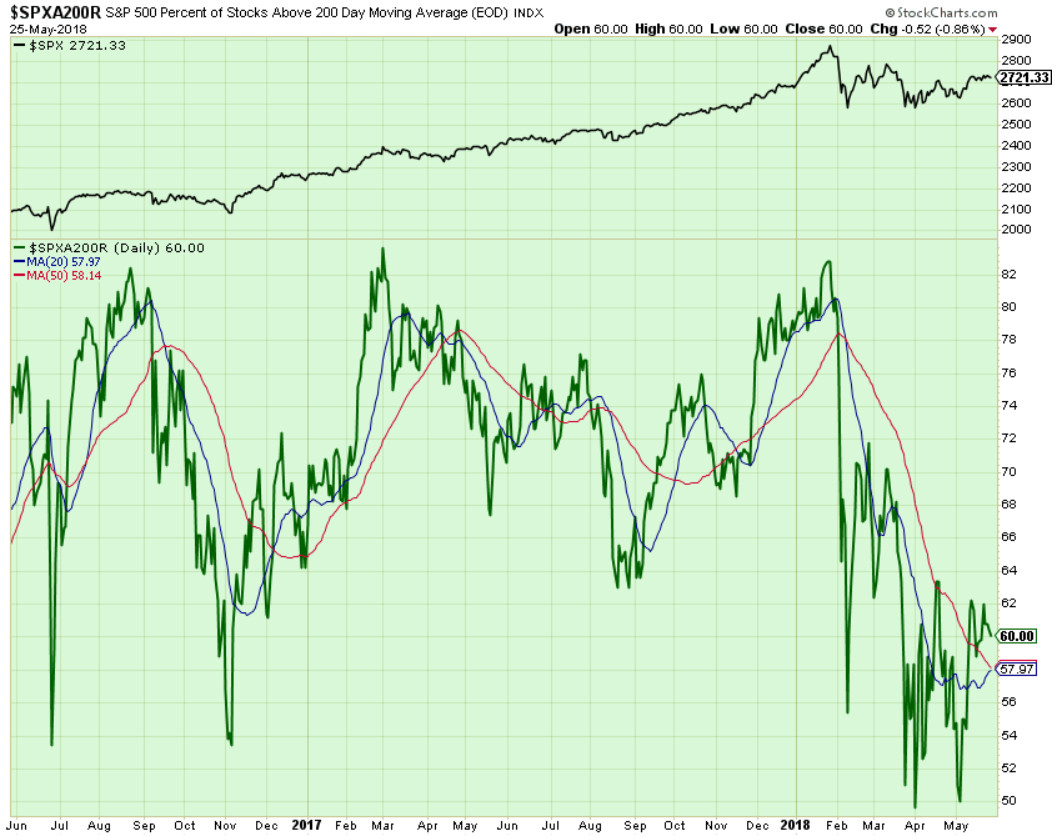
Components of SPX above their respective 200day MA Chart
Again, this scoring indicator ended up at 60% level after another sausagie week. We should now look for a break above 64s or below 56s.
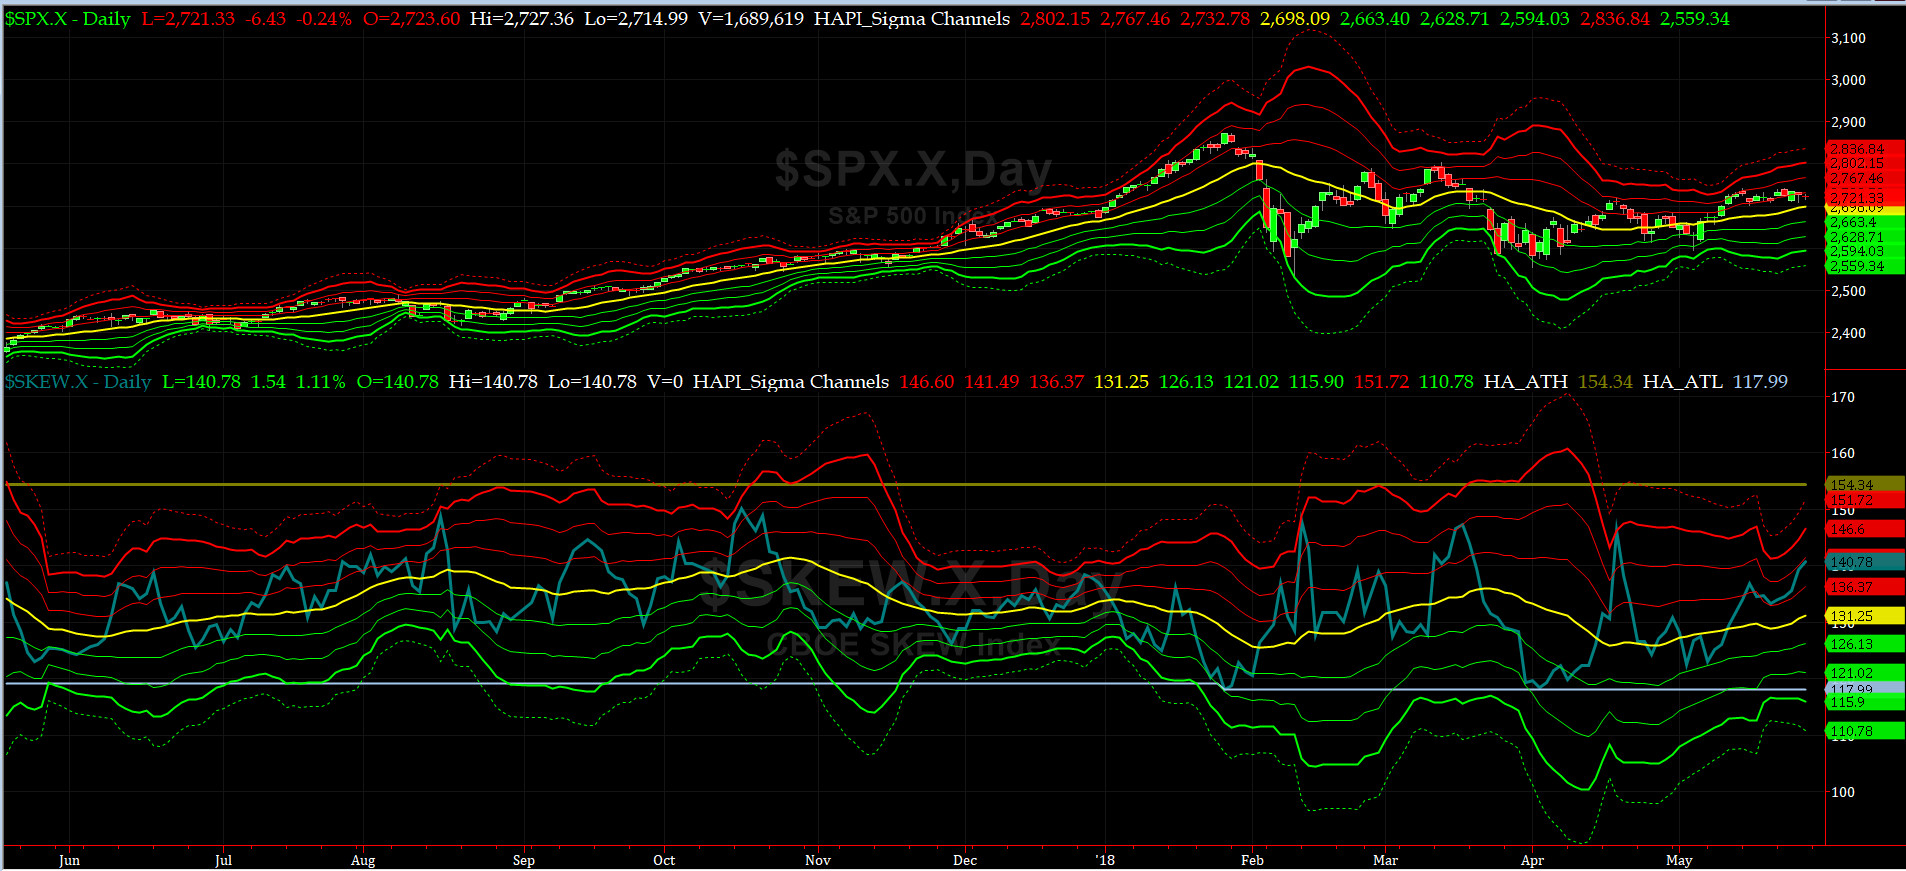
SPX SKEW (Tail Risk) Chart
On Friday, SPX SKEW (Tail Risk) closed near 141, or near its +2 sigma (normal = 120-125, range 100-150).
Is all quiet on the Eastern & Mid-Western Fronts? Smart Money says NOT ANY MORE & our venerable crude trader, @Capt_Tiko agrees.
How to interpret the value of SPX SKEW? (from CBOE white paper on SKEW)

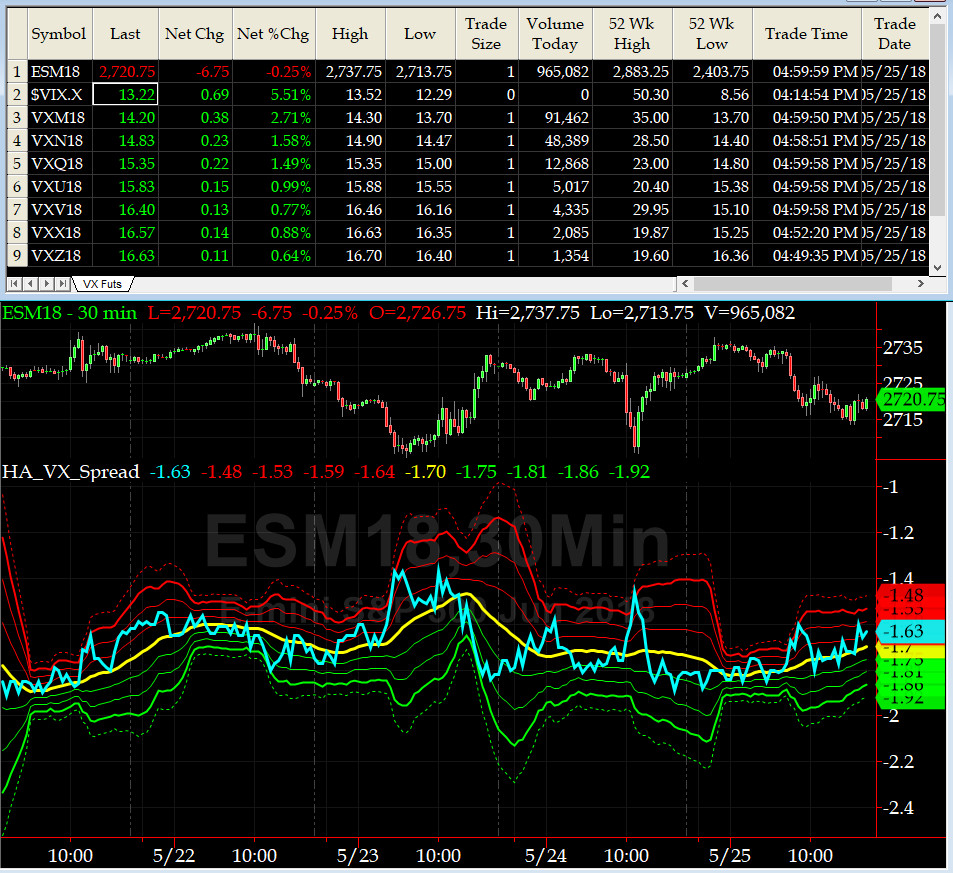
3-month VIX Futures Spread(VX) Chart
Again, this popular timing indicator, (long June, & short Sept VIX Futures) is at -1.63. The signal here remains NEUTRAL.
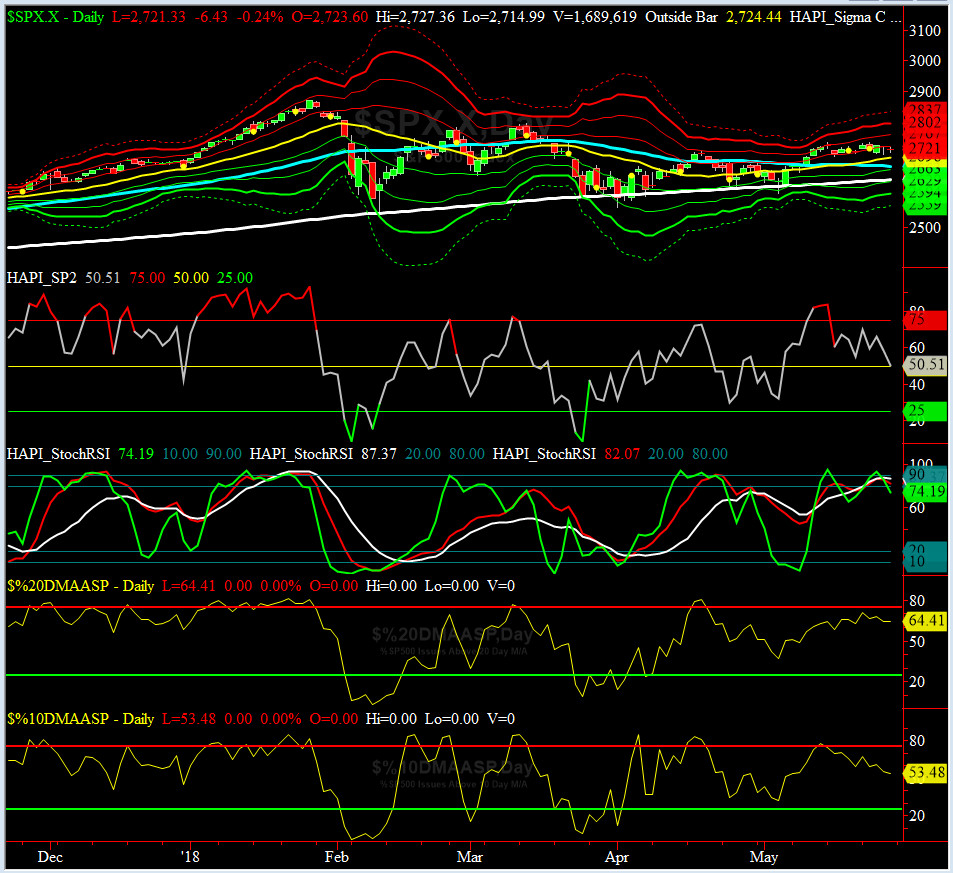
HA_SP2 Chart
HA_SP2 = 50.5 (Buy signal <= 25, Sell Signal >= 75)
This coveted prop indicator has been range bound. A break below 45 is very good for the short-term bears (like @Capt_Tiko).
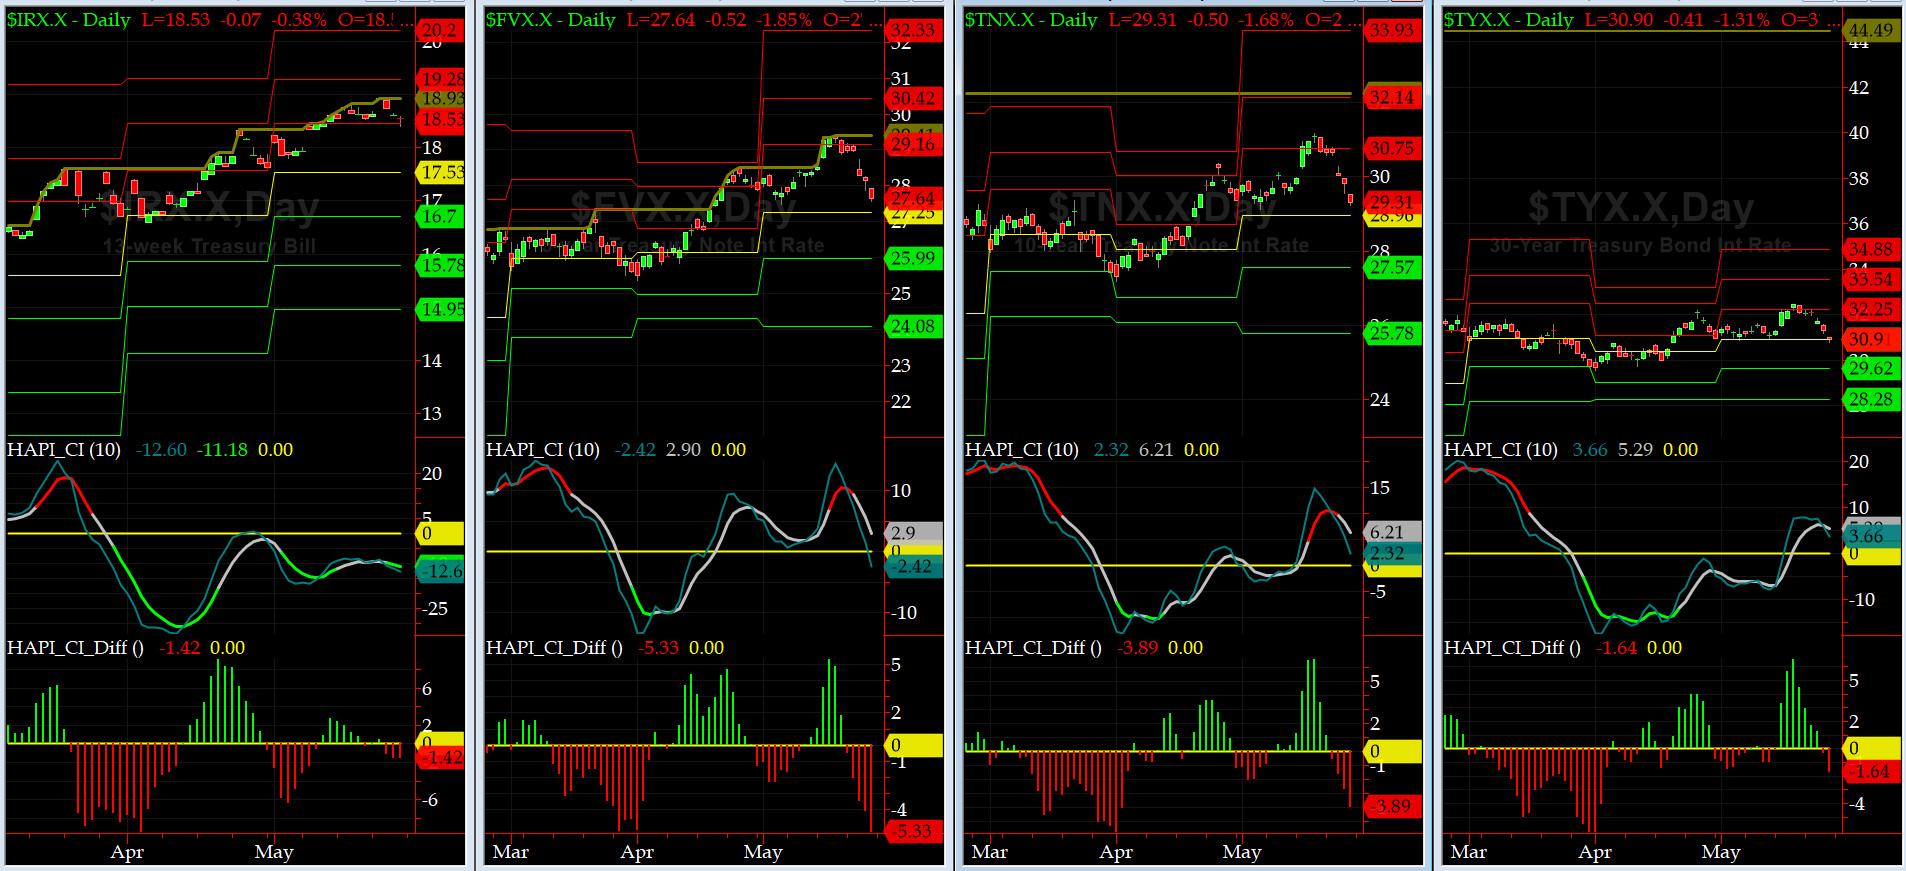
US Treasury T-Notes & T-Bonds Yields Chart
Bonds rallied in a flight-to-quality (do you blame them? just look at chaos in the WH) and the Maurys are not happy. No more shopping on Rodeo Dr.
Fari Hamzei
|


 Proactive Market Timing


