|
Monday, June 4, 2018, 0045ET
Market Timing Charts, Analysis & Commentary for Issue #243
Timer Charts of S&P-500 Cash Index (SPX) + NASDAQ-100 Cash Index (NDX)
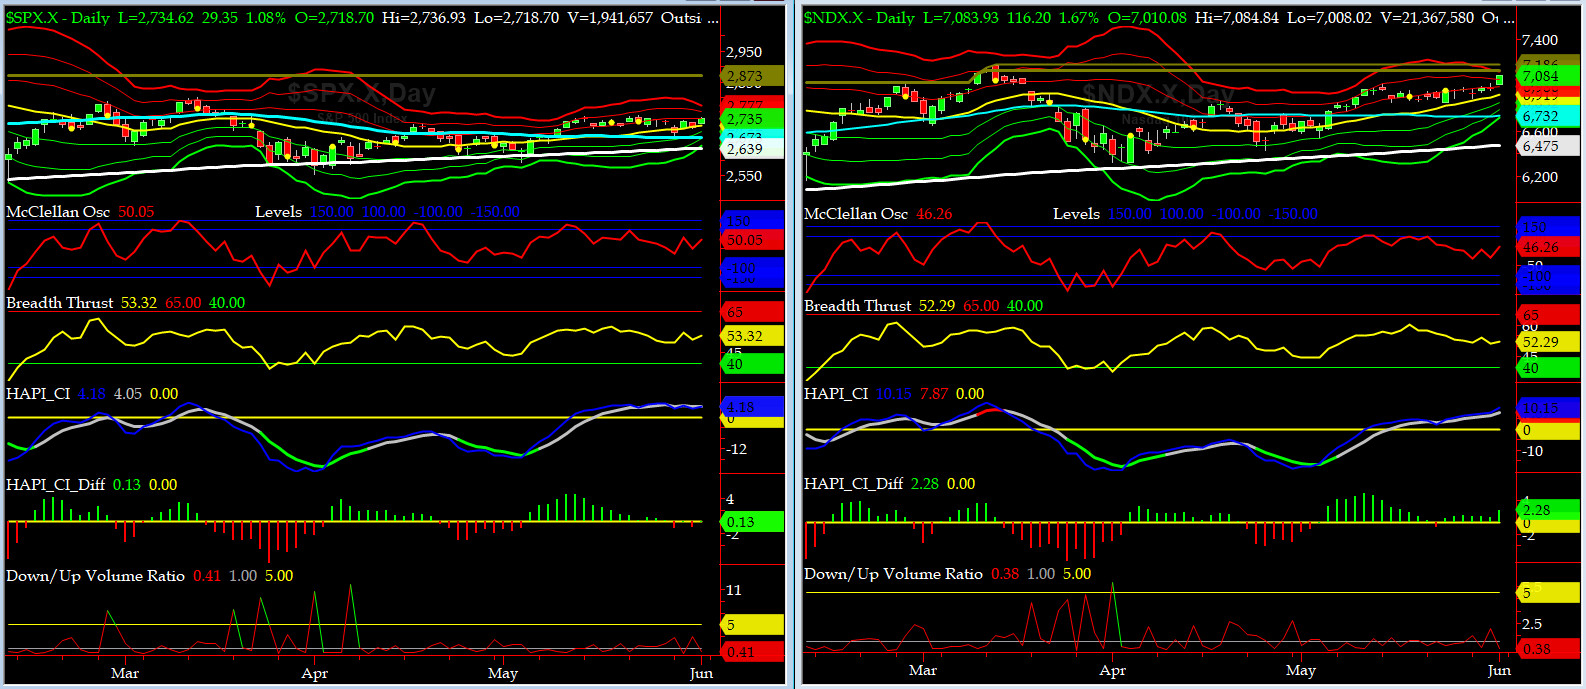
Most recent S&P-500 Cash Index (SPX): 2734 up +13 (up +0.5%) for the week ending on Friday, June 1, 2018, which closed at its +1 sigma.
DJIA ALL TIME INTRADAY HIGH = 26617 (reached on Friday, January 26, 2018)
TRAN ALL TIME INTRADAY HIGH = 11424 (reached on Tuesday, January 16, 2018)
SPX ALL TIME INTRADAY HIGH = 2873 (reached on Friday, Jan 26, 2018)
NDX ALL TIME INTRADAY HIGH = 7186 (reached on Tuesday, March 13, 2018)
RUT ALL TIME INTRADAY HIGH = 1651 (reached on Wednesday, May 30, 2018)
Current DAILY +2 Sigma SPX = 2755 with WEEKLY +2 Sigma = 2848
Current DAILY 0 Sigma (20 day MA) SPX = 2712 with WEEKLY 0 Sigma = 2708
Current DAILY -2 Sigma SPX = 2669 with WEEKLY -2 Sigma = 2569
NYSE McClellan Oscillator = +6 (-150 is start of the O/S area; around -275 to -300 area or lower, we go into the �launch-pad� mode, over +150, we are in O/B area)
NYSE Breadth Thrust = 50.1 (40 is considered as oversold and 65 as overbought)
Again speaking of Sausage Ops, this past week was a non-event on closing basis, but we must note that there was considerable intraday range (vol). And we got more Godiva from our broker.
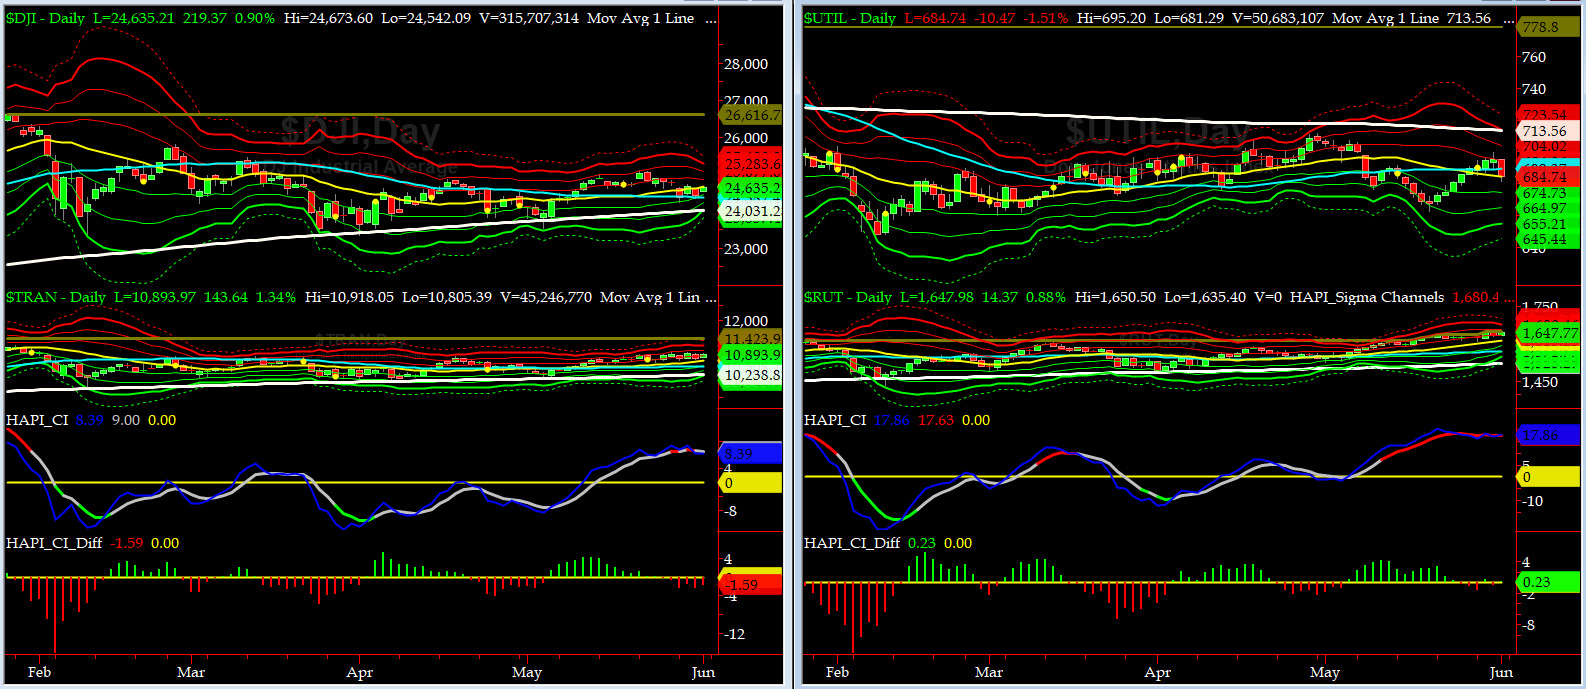
Canaries [in the Coal Mine] Chart for DJ TRAN & RUT Indices
200-Day MA DJ TRAN = 10,238 or 6.4% below DJ TRAN (max observed in last 7 yrs = 20.2%, min = -20.3%)
200-Day MA RUT = 1522 or 8.2% below RUT (max observed in last 7 yrs = 21.3%, min = -22.6%)
DJ Transportation Index (proxy for economic conditions 6 to 9 months hence) basically again went nowhere fast.
Russell 2000 Small Caps Index (proxy for Risk ON/OFF) had another up week and logged a new ATH on Wednesday. RISK is definitely ON.
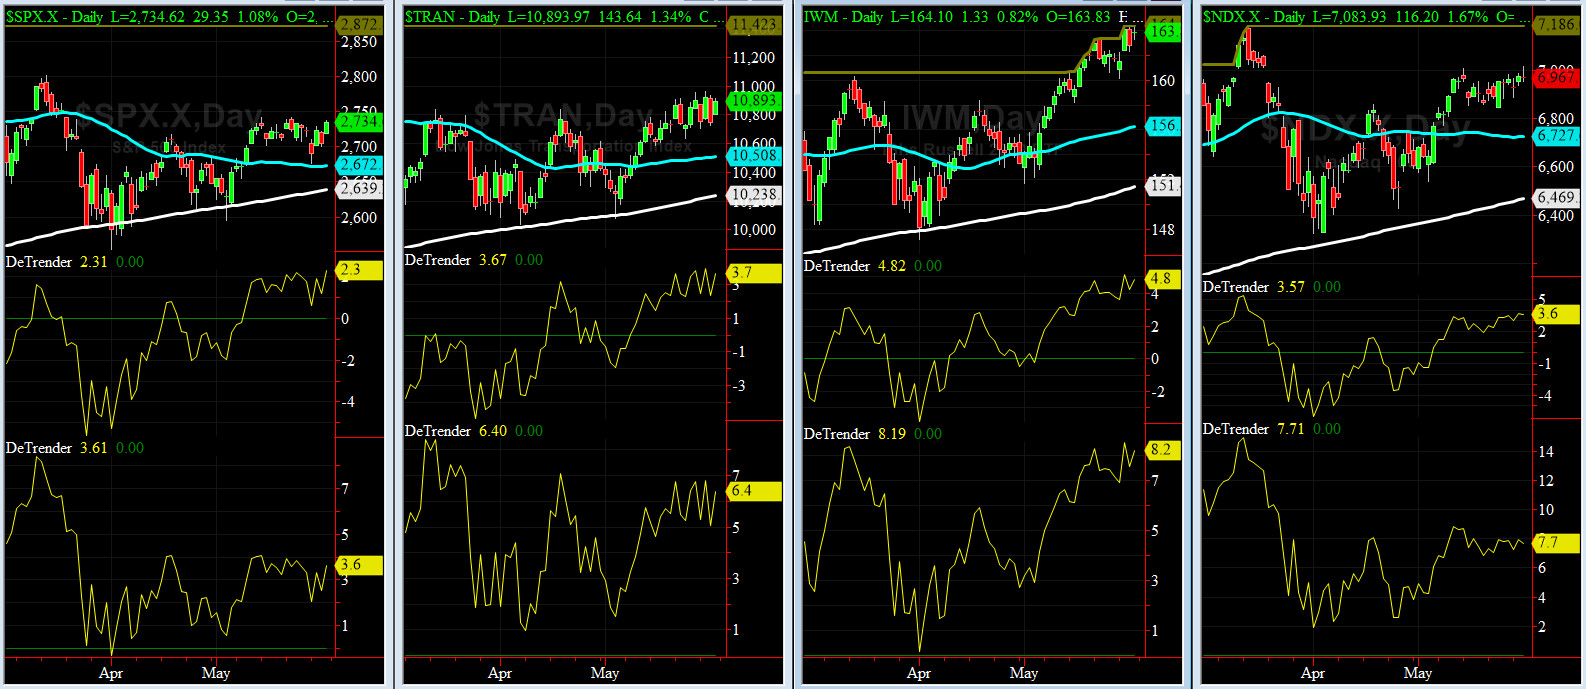
DeTrenders Charts for SPX, NDX, TRAN & RUT Indices
50-Day MA SPX = 2672 or 2.3% below SPX (max observed in last 7 yrs = +8.6%, min = -9.3%)
200-Day MA SPX = 2639 or 3.6% below SPX (max observed in last 7 yrs = 15.2%, min = -14%)
All EIGHT of our EIGHT DeTrenders remain in POSITIVE territory. The DeTrenders for DJ Tran & RUT will continue to be harbingers of future price behavior in broad indices.
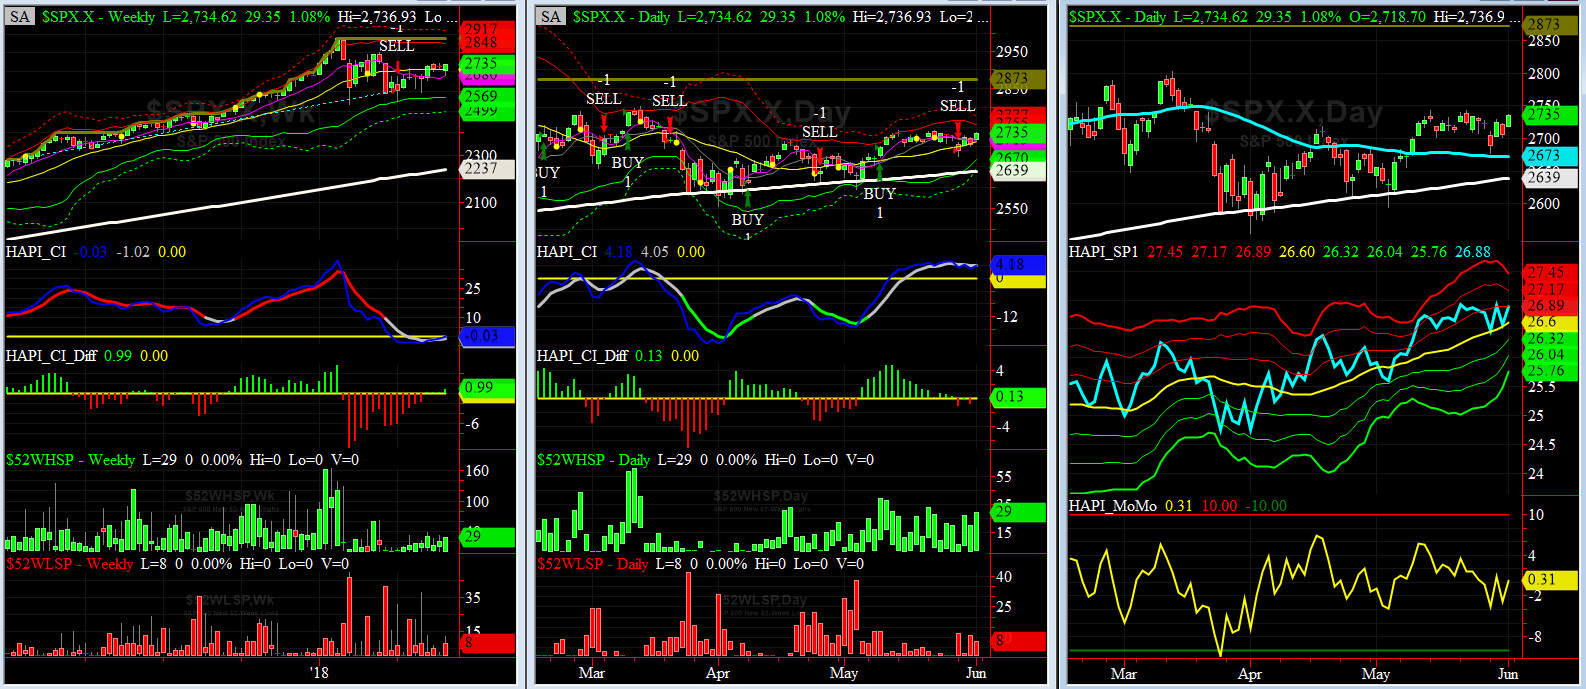
HA_SP1_Momo Chart
WEEKLY Timing Model = on a SELL Signal since Friday 4/06/118 CLOSE at 2604
DAILY Timing Model = on a SELL Signal since Wednesday 5/29/18 CLOSE at 2689
Max SPX 52wk-highs reading last week = 29 (over 120-140, the local maxima is in)
Max SPX 52wk-Lows reading last week = 12 (over 40-60, the local minima is in)
HA_SP1 closed at its +1 sigma channels
HA_Momo = +0.3 (reversals most likely occur above +10 or below -10)
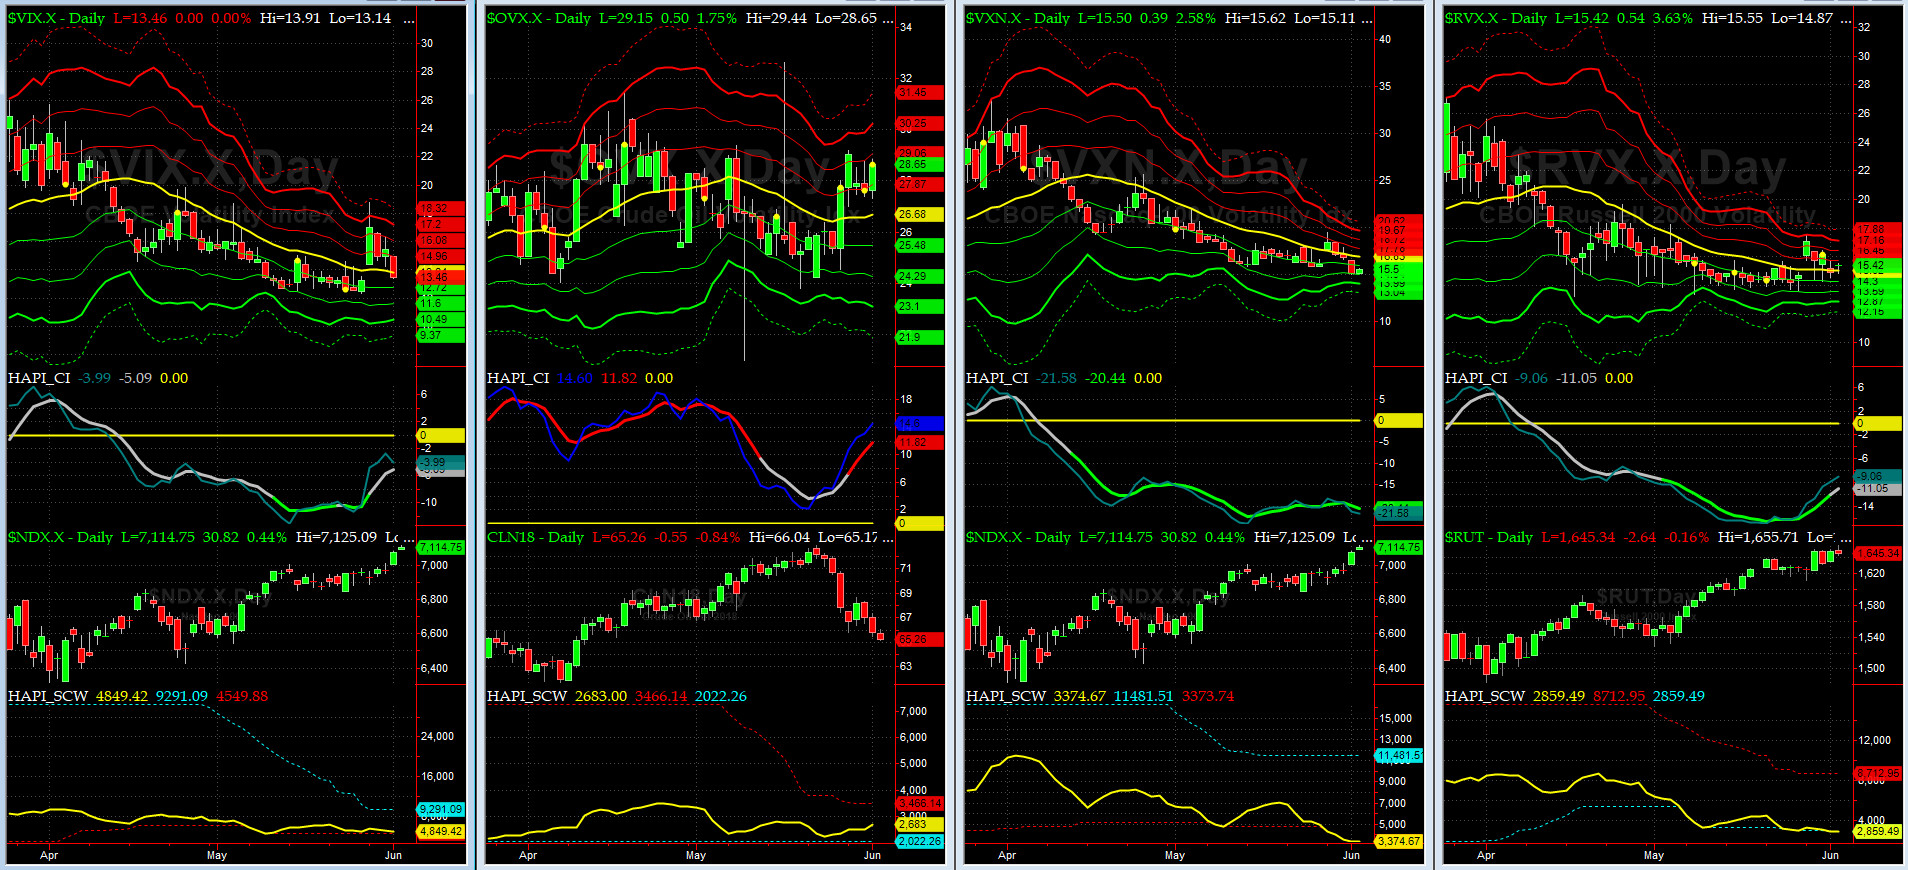
Vol of the Vols Chart
VIX currently stands at 13.46, just about its zero sigma (remember it's the VIX volatility pattern aka "its sigma channels" that matters, and not the level of VIX itself (this is per Dr. Robert Whaley, a great mentor and inventor of original VIX, now called VXO). VIX usually peaks around a test of its +4 sigma).
VIX spiked to a tad under 19 but settled in mid 13s. "Buy the Dips Crowd" is in for now.
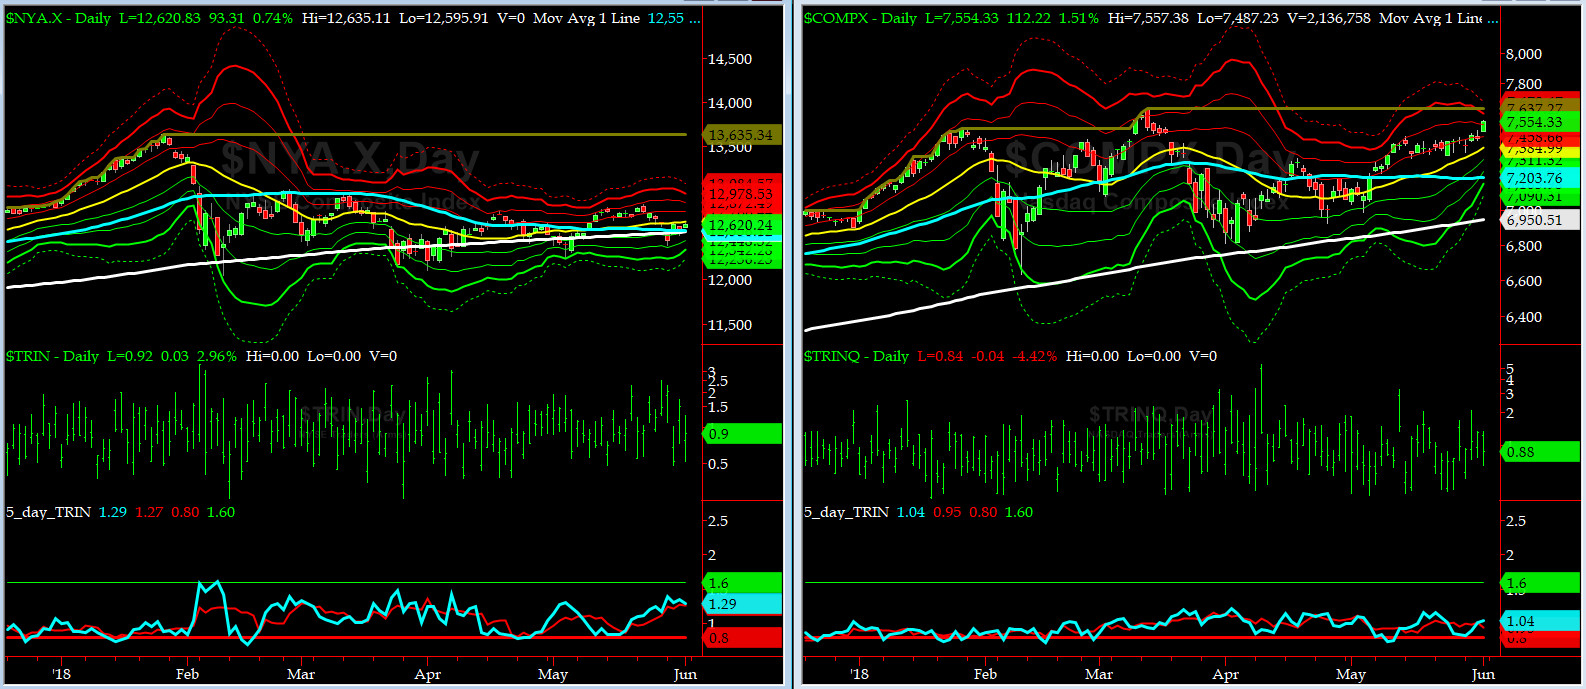
5-day TRIN & TRINQ Charts
While NYSE 5-day TRIN is in the BUY zone, its NASDAQ brethren, 5-day TRINQ is again in the NEUTRAL zone.
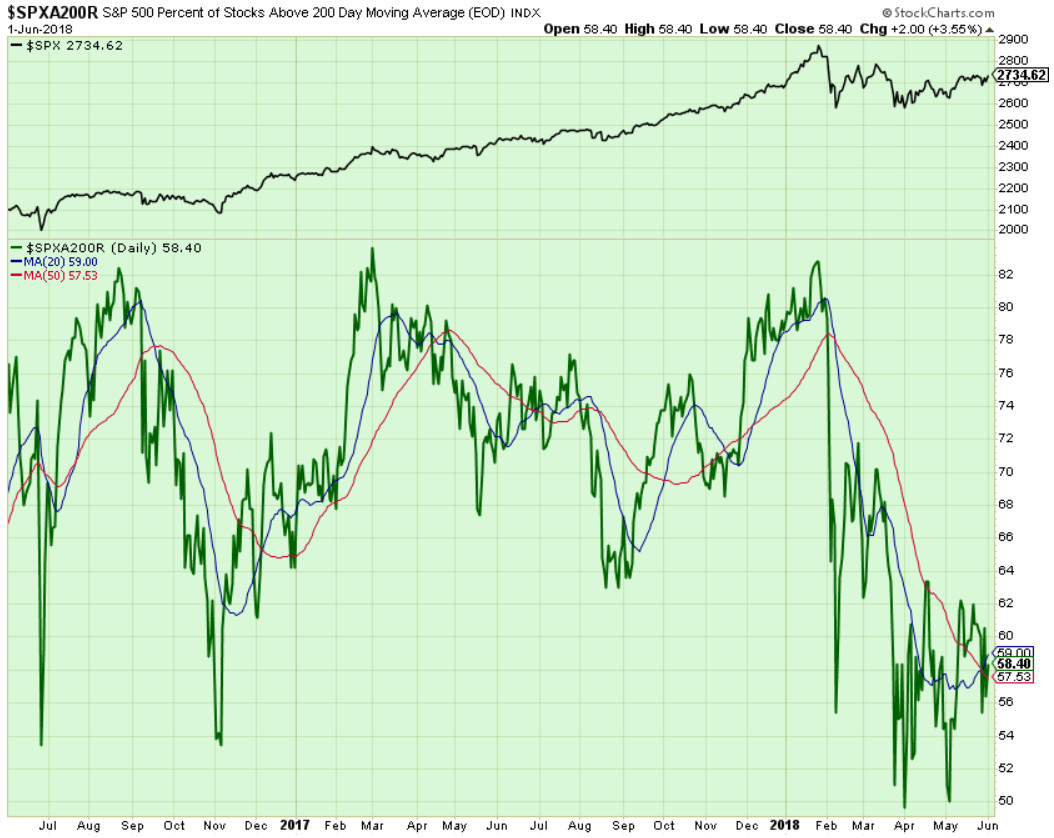
Components of SPX above their respective 200day MA Chart
Again, this scoring indicator ended up a 58% level after another going nowhere fast.
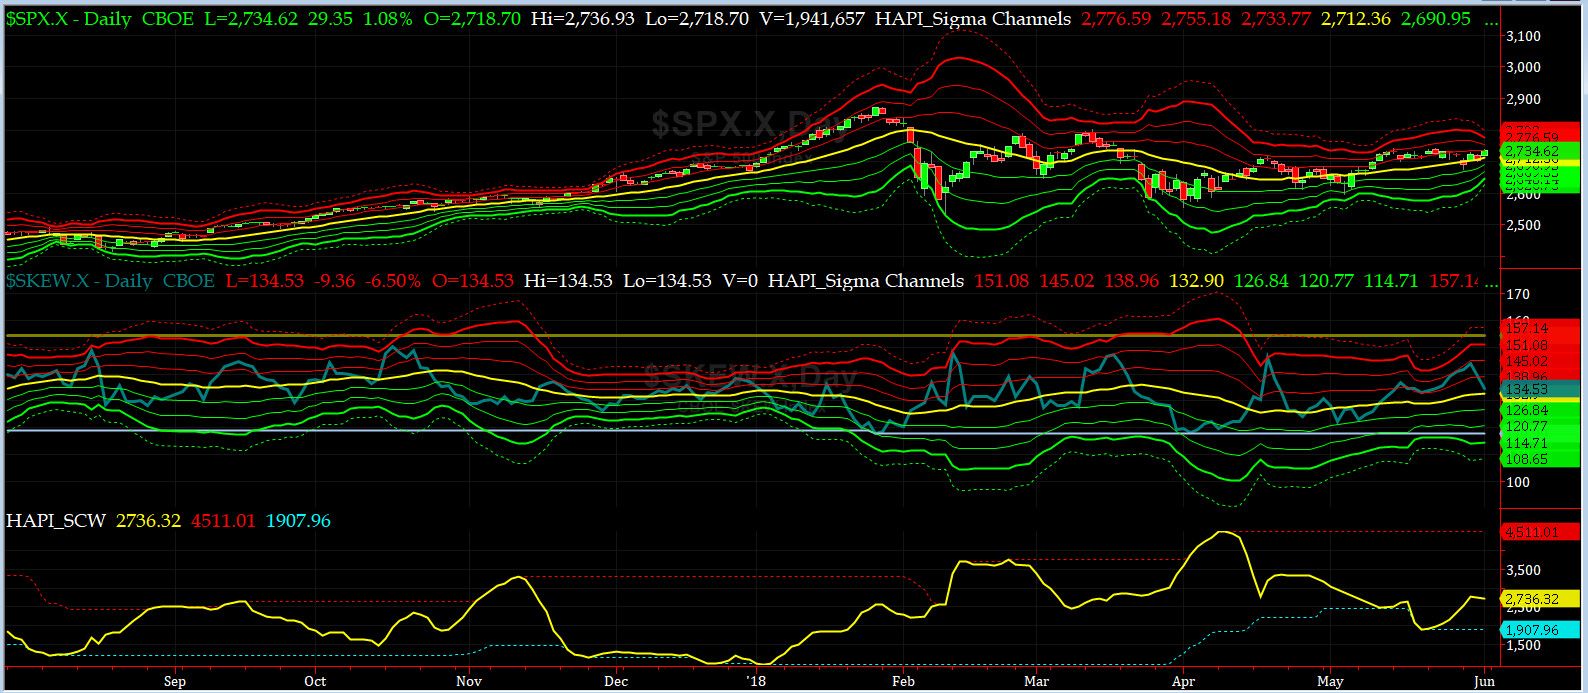
SPX SKEW (Tail Risk) Chart
On Friday, SPX SKEW (Tail Risk) closed near 134.5, or near its +2 sigma (normal = 120-125, range 100-150).
Is all quiet on the Eastern & Mid-Western Fronts? YES for now.
How to interpret the value of SPX SKEW? (from CBOE white paper on SKEW)

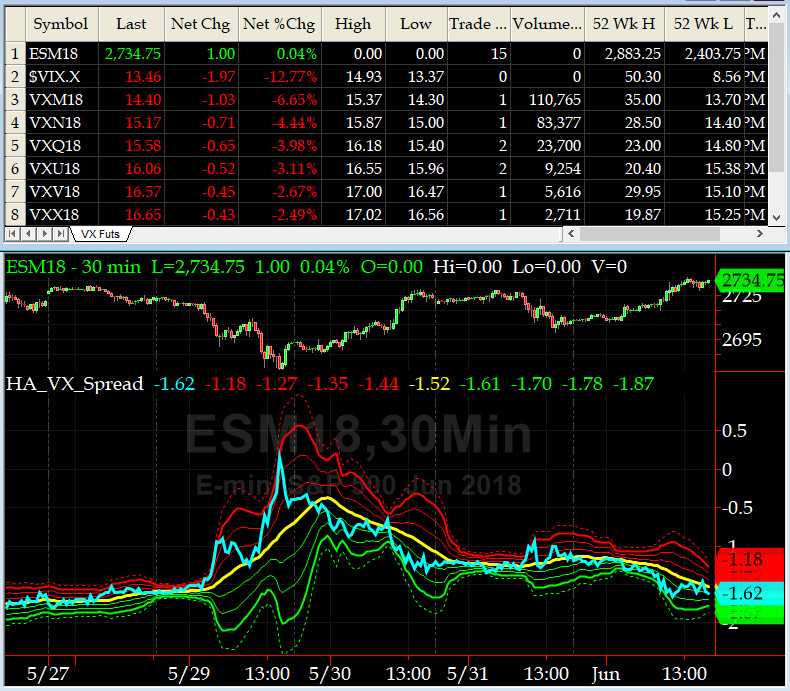
3-month VIX Futures Spread(VX) Chart
Again, this popular timing indicator, (long June, & short Sept VIX Futures) is at -1.56. The signal here remains NEUTRAL.

HA_SP2 Chart
HA_SP2 = 60+ (Buy signal <= 25, Sell Signal >= 75)
This coveted prop indicator is now heading up and shooting to test 75 level.
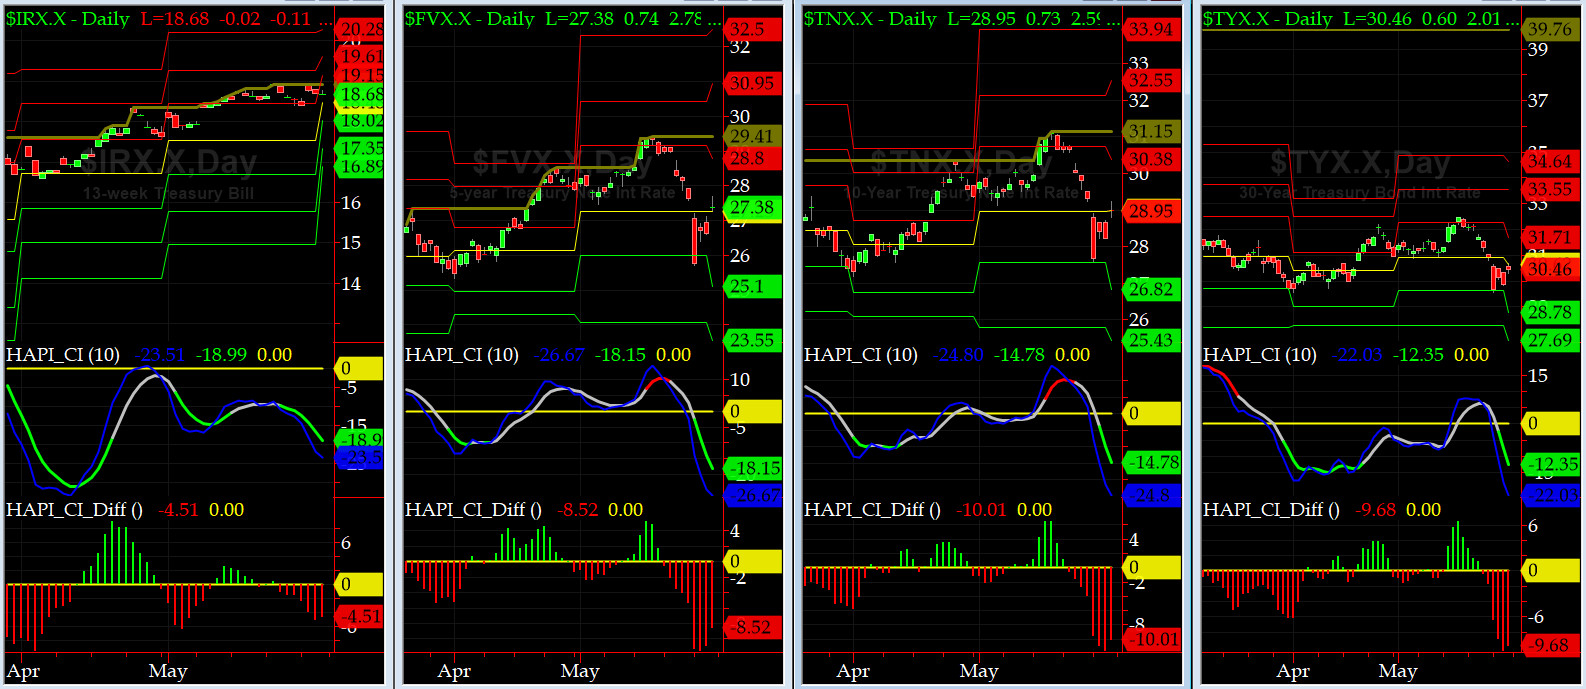
US Treasury T-Notes & T-Bonds Yields Chart
Early in the week, Bonds rallied, again, big time, in a flight-to-quality move that made the Maurys a bit unhappy. No more shopping on Rodeo Dr for a while.
Fari Hamzei
|


 Proactive Market Timing


