|
Sunday, June 10, 2018, 1845ET
Market Timing Charts, Analysis & Commentary for Issue #244
Timer Charts of S&P-500 Cash Index (SPX) + NASDAQ-100 Cash Index (NDX)
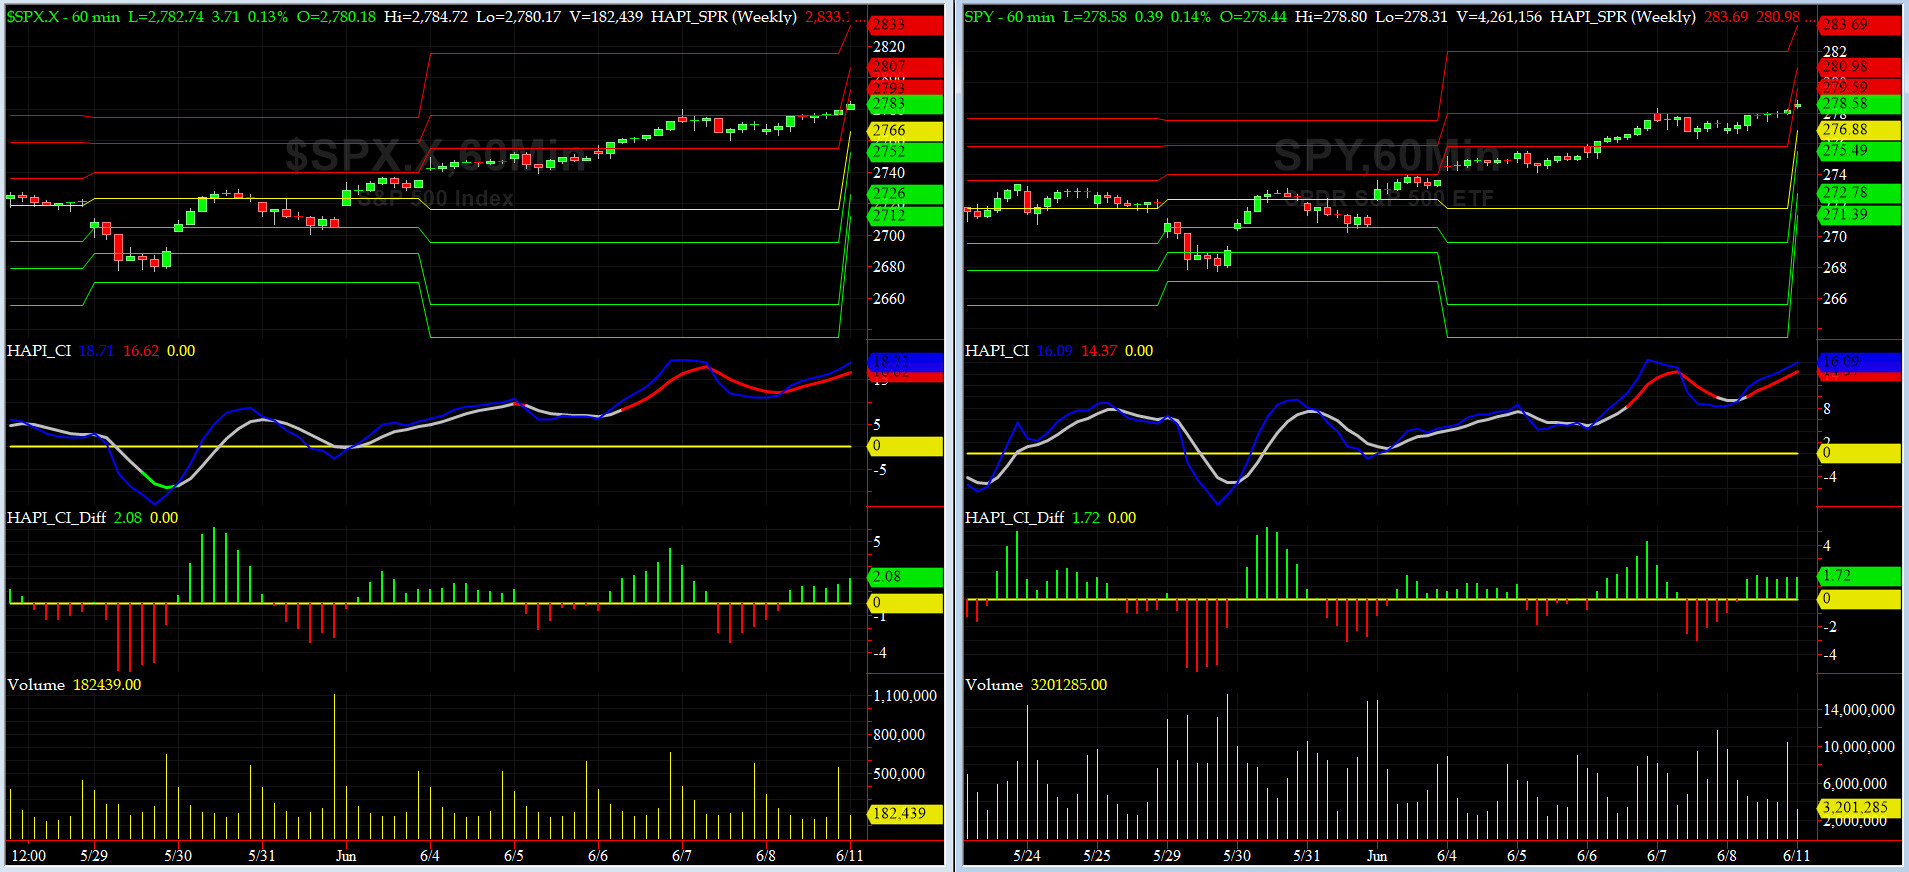
Most recent S&P-500 Cash Index (SPX): 2779 up +45 (up +1.65%) for the week ending on Friday, June 8, 2018, which closed a tad above its +2 sigma.
DJIA ALL TIME INTRADAY HIGH = 26617 (reached on Friday, January 26, 2018)
TRAN ALL TIME INTRADAY HIGH = 11424 (reached on Tuesday, January 16, 2018)
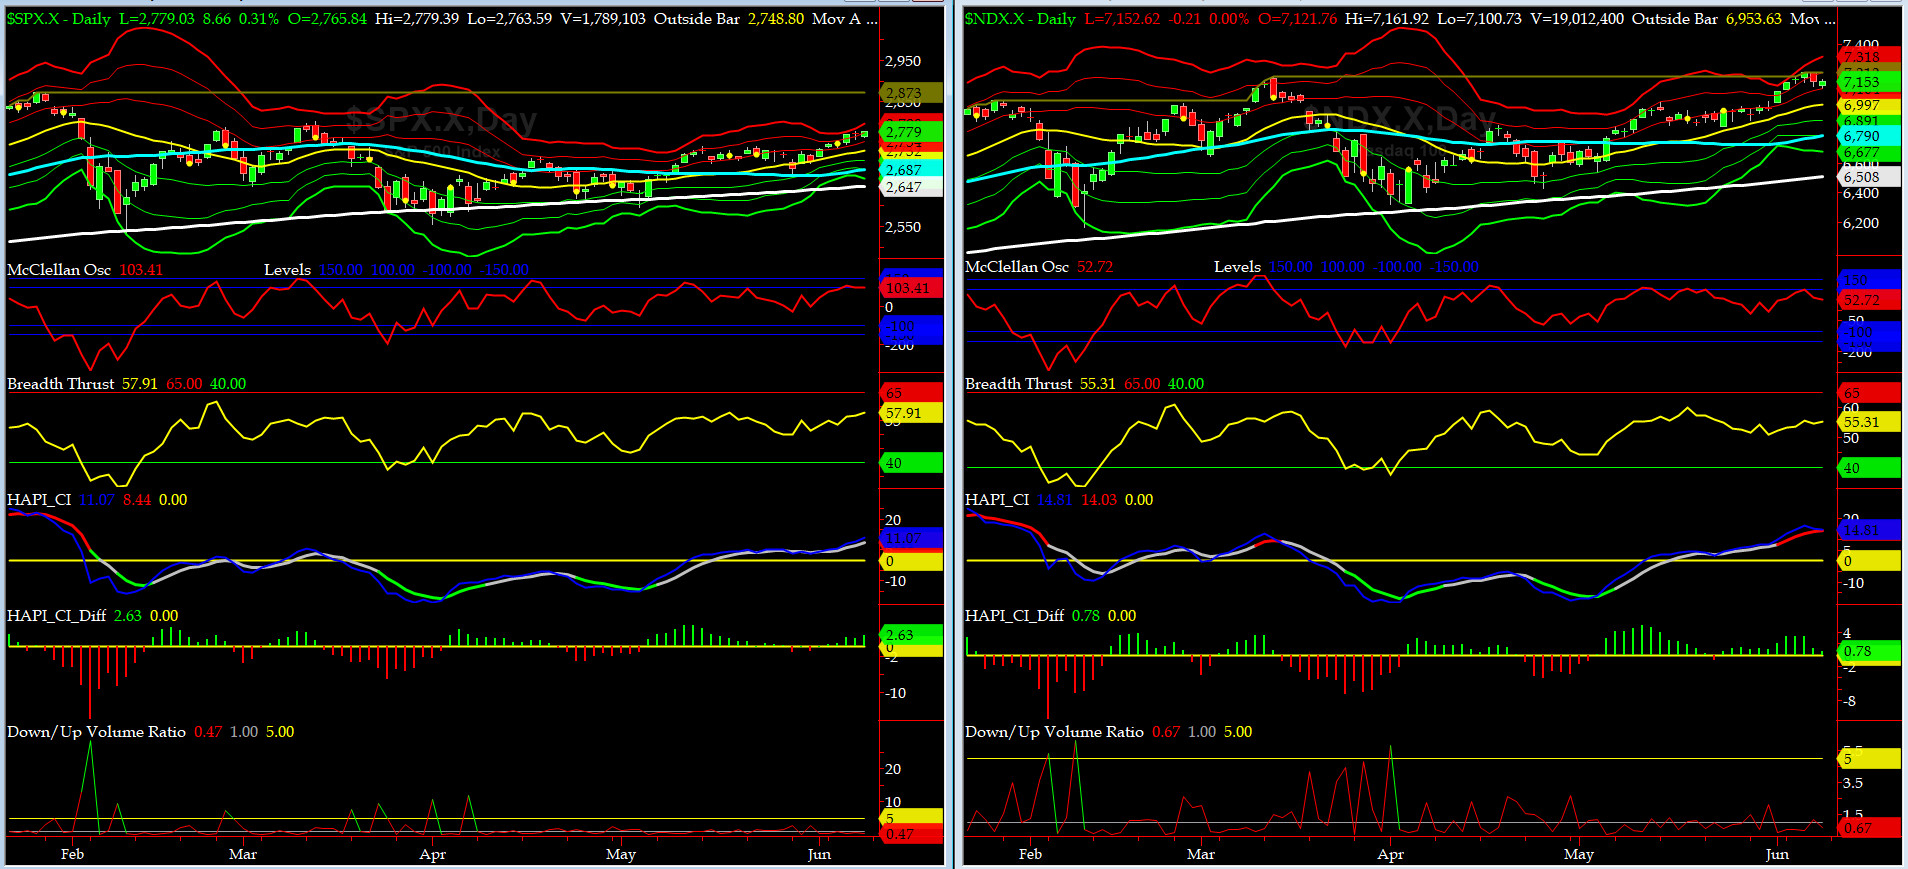
SPX ALL TIME INTRADAY HIGH = 2873 (reached on Friday, January 26, 2018)
NDX ALL TIME INTRADAY HIGH = 7212 (reached on Wednesday, June 6, 2018)
RUT ALL TIME INTRADAY HIGH = 1680 (reached on Thursday, June 7, 2018)
Current DAILY +2 Sigma SPX = 2776 with WEEKLY +2 Sigma = 2842
Current DAILY 0 Sigma (20 day MA) SPX = 2732 with WEEKLY 0 Sigma = 2707
Current DAILY -2 Sigma SPX = 2688 with WEEKLY -2 Sigma = 2571
NYSE McClellan Oscillator = +103 (-150 is start of the O/S area; around -275 to -300 area or lower, we go into the �launch-pad� mode, over +150, we are in O/B area)
NYSE Breadth Thrust = 57.9 (40 is considered as oversold and 65 as overbought)
This past week we witnessed a very nice run-up in DJIA, SPX, NDX & RUT Indices. Shorts got their clocked cleaned, one more time. Cheers. @Capt_Tiko likes that.
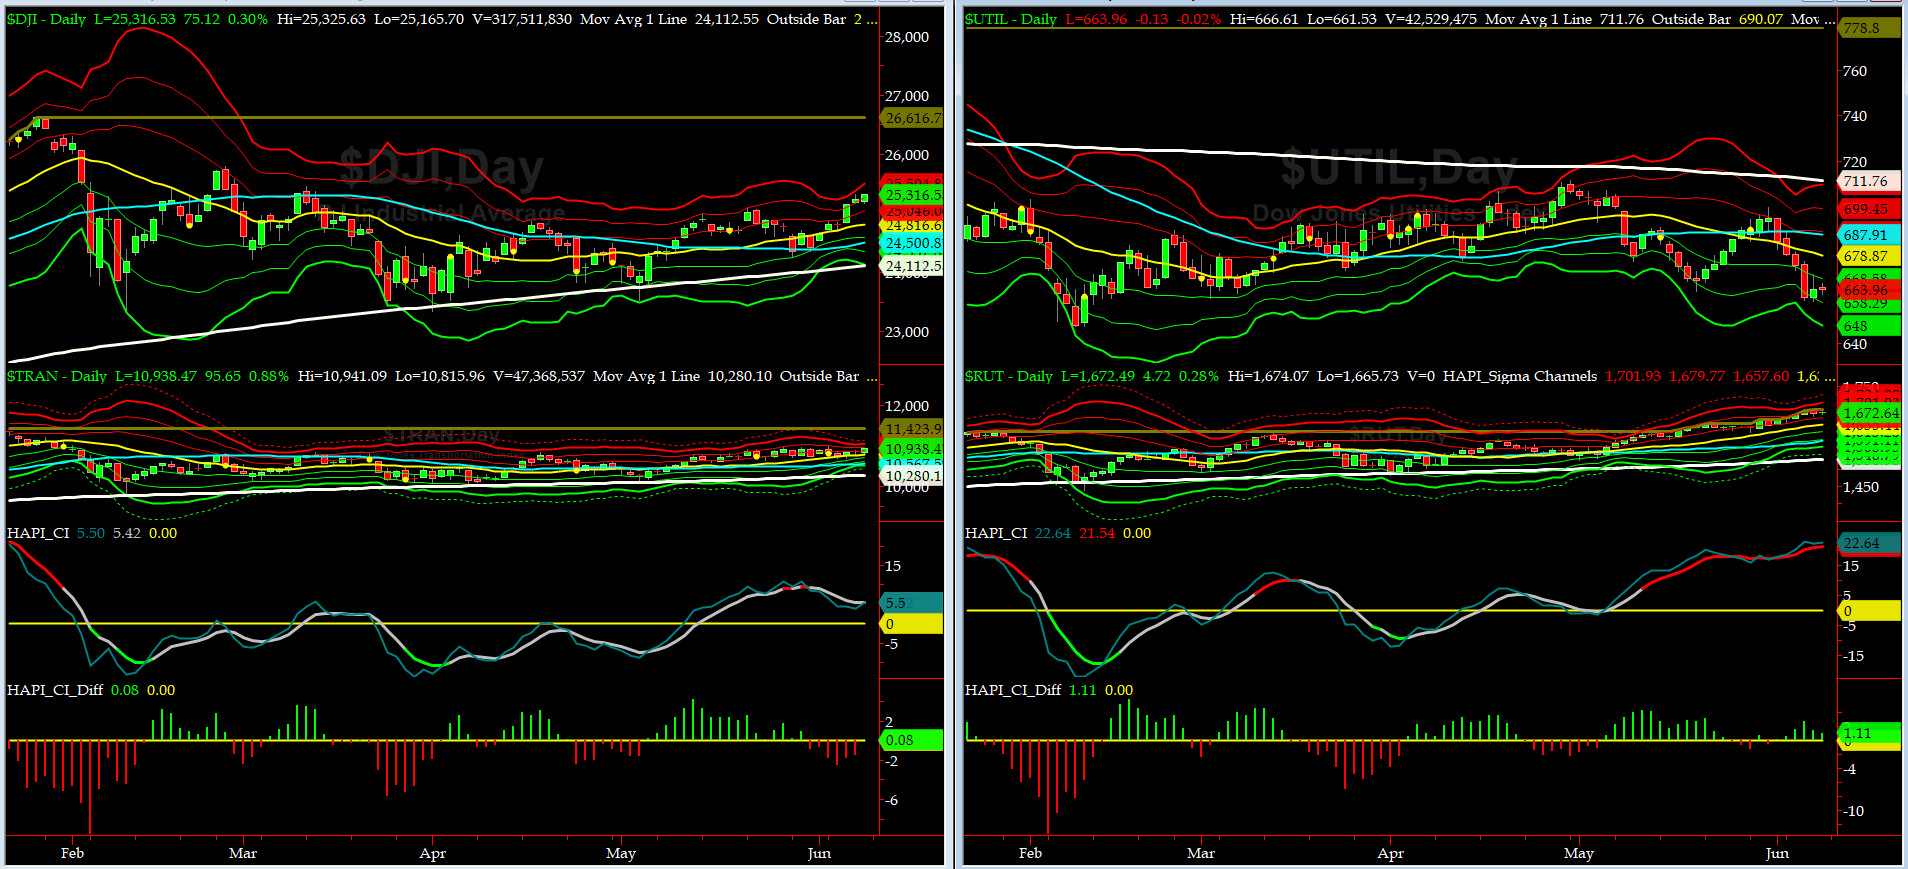
Canaries [in the Coal Mine] Chart for DJ TRAN & RUT Indices
200-Day MA DJ TRAN = 10,280 or 6.4% below DJ TRAN (max observed in last 7 yrs = 20.2%, min = -20.3%)
200-Day MA RUT = 1530 or 9.3% below RUT (max observed in last 7 yrs = 21.3%, min = -22.6%)
DJ Transportation Index (proxy for economic conditions 6 to 9 months hence) is getting ready to start a classic breakout. Keep DJ TRAN on your watch list this coming week.
Russell 2000 Small Caps Index (proxy for Risk ON/OFF) had another great week to the upside & logged a new ATH on Thursday. RISK is definitely ON.
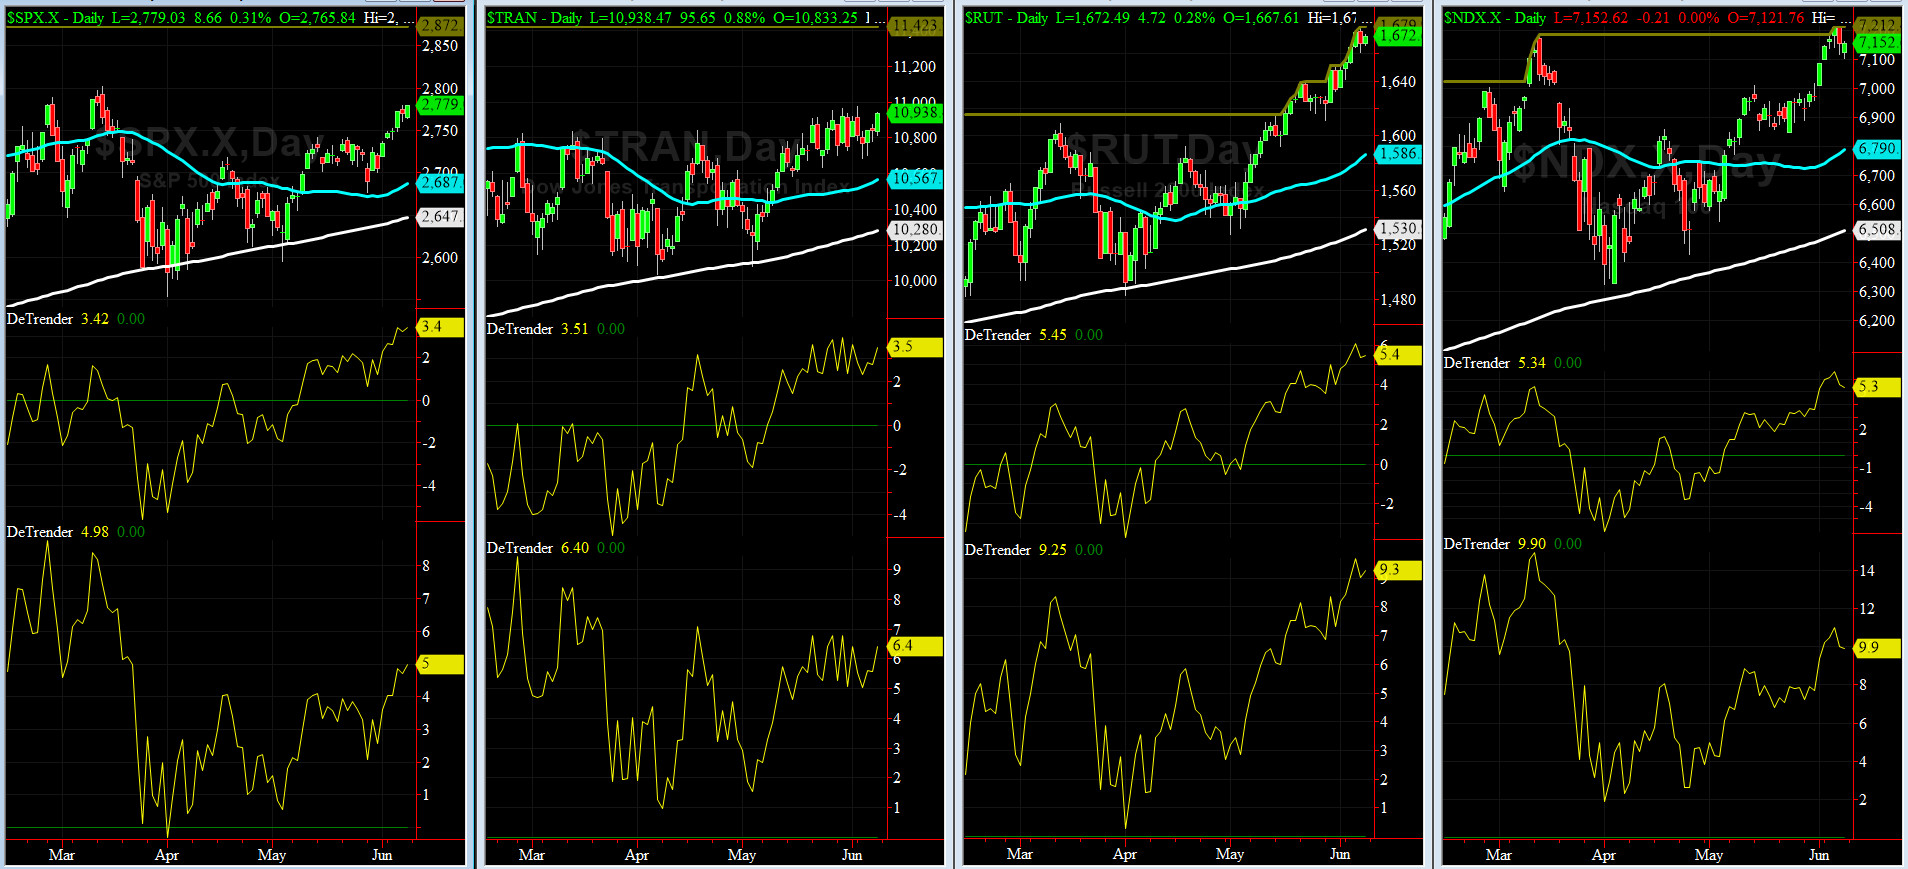
DeTrenders Charts for SPX, NDX, TRAN & RUT Indices
50-Day MA SPX = 2687 or 3.4% below SPX (max observed in last 7 yrs = +8.6%, min = -9.3%)
200-Day MA SPX = 2647 or 5% below SPX (max observed in last 7 yrs = 15.2%, min = -14%)
All EIGHT of our EIGHT DeTrenders remain in POSITIVE territory. The DeTrenders for DJ Tran & RUT will continue to be harbingers of future price behavior in broad indices.
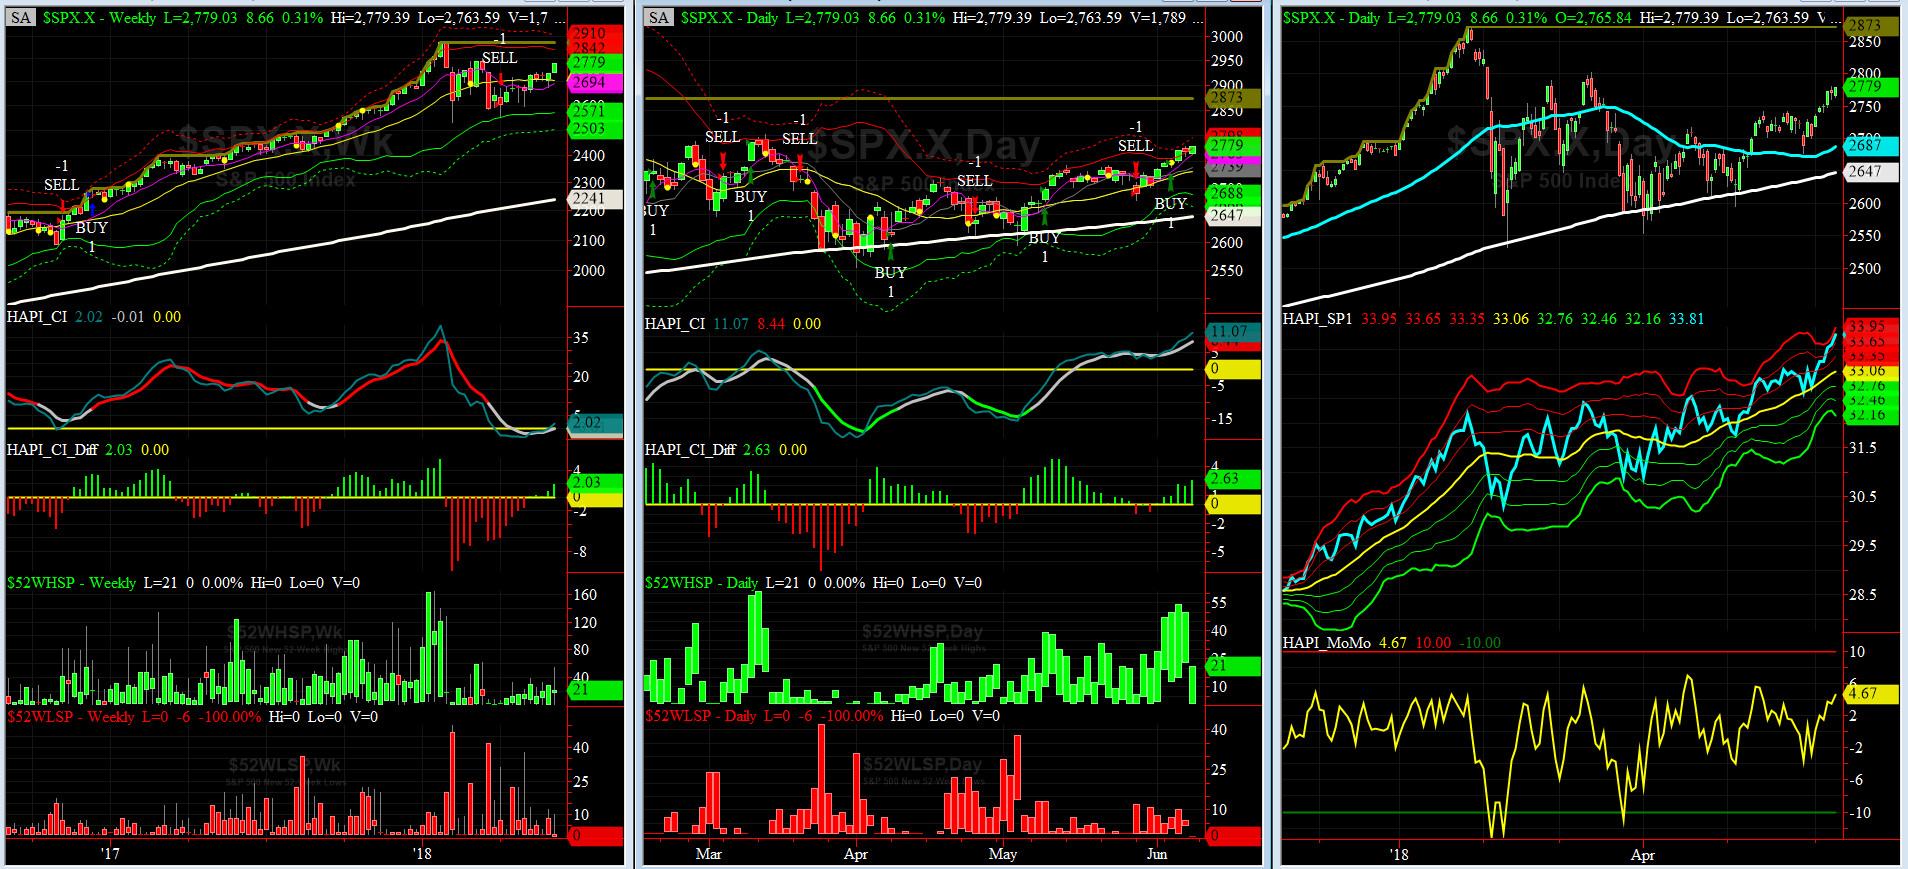
HA_SP1_Momo Chart
WEEKLY Timing Model = on a SELL Signal since Friday, April 6, 2018 CLOSE at 2604
DAILY Timing Model = on a BUY Signal since Wednesday, June 6, 2018 CLOSE at 2749
Max SPX 52wk-highs reading last week = 54 (over 120-140, the local maxima is in)
Max SPX 52wk-Lows reading last week = 10 (over 40-60, the local minima is in)
HA_SP1 closed almost at its +3 sigma channels
HA_Momo = +4.67 (reversals most likely occur above +10 or below -10)
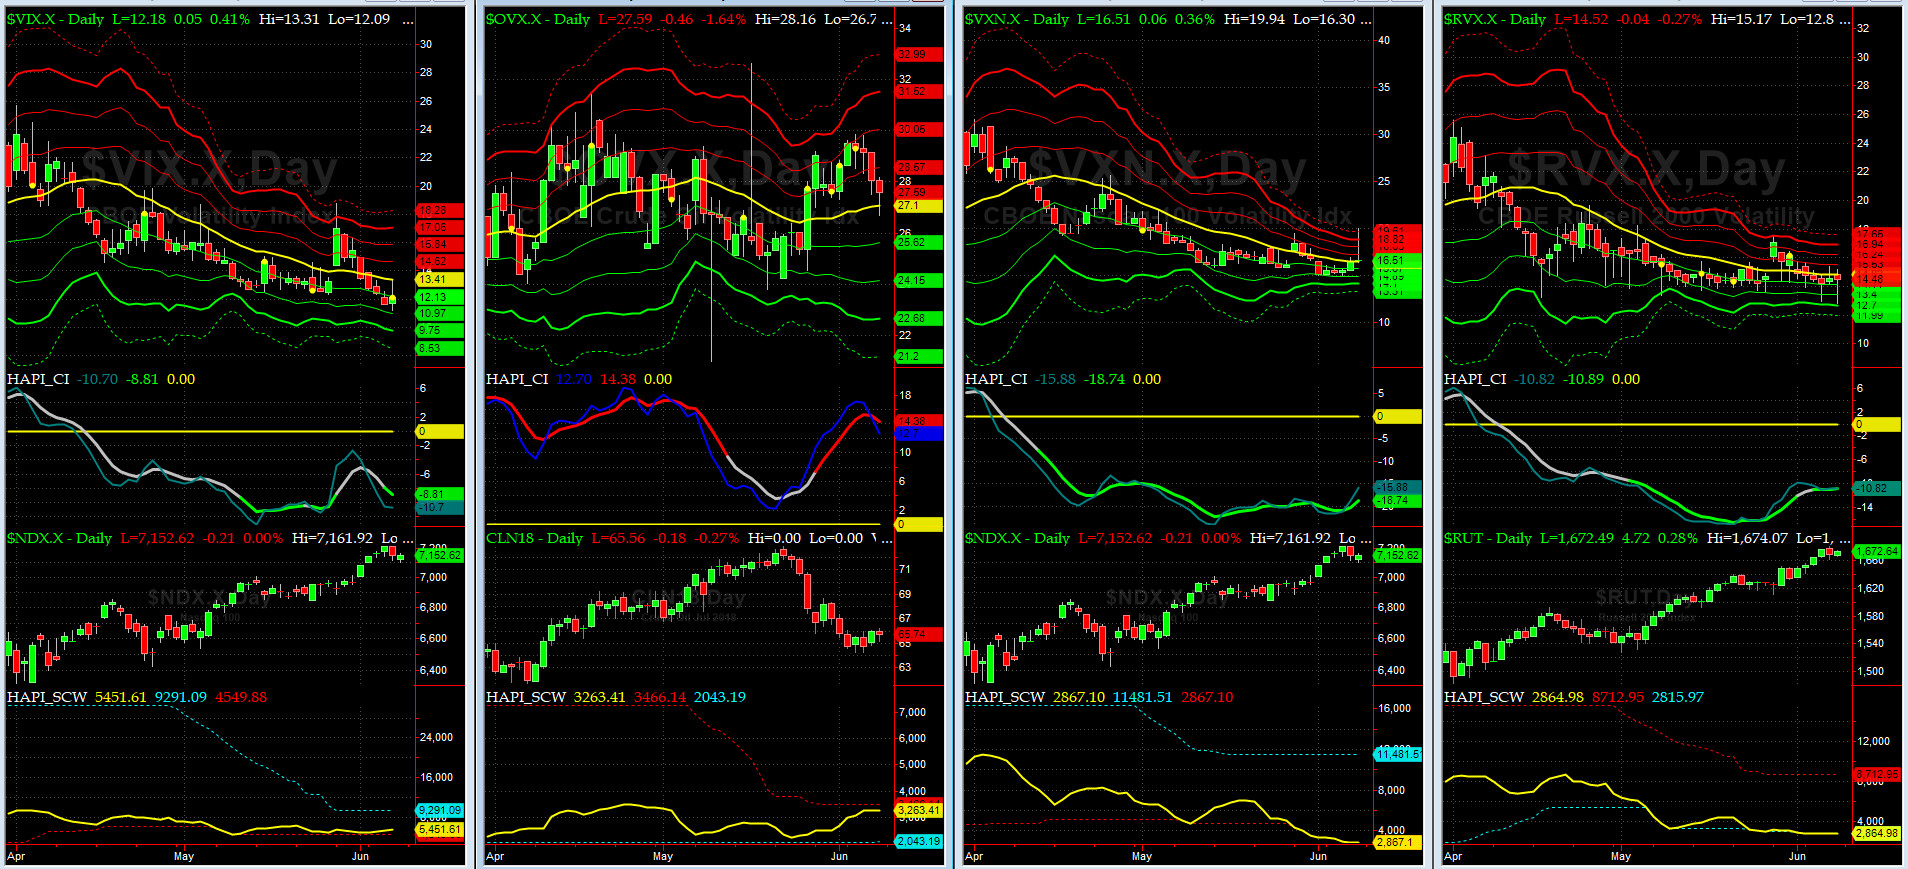
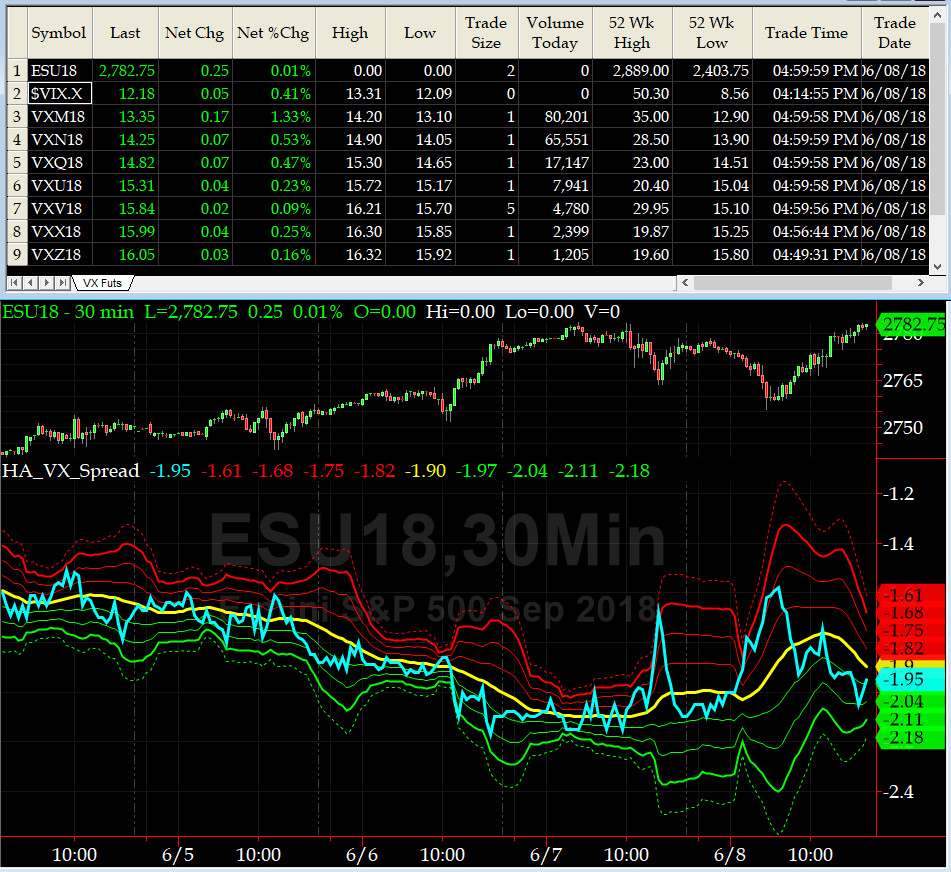
Vol of the Vols Chart
VIX currently stands at 12.18, just about its -1 sigma (remember it's the VIX volatility pattern aka "its sigma channels" that matters, and not the level of VIX itself (this is per Dr. Robert Whaley, a great mentor and inventor of original VIX, now called VXO). VIX usually peaks around a test of its +4 sigma).
VIX attempted to spike twice this past week only to give up most of its up moves. We also saw a good drop in Crude Vol.
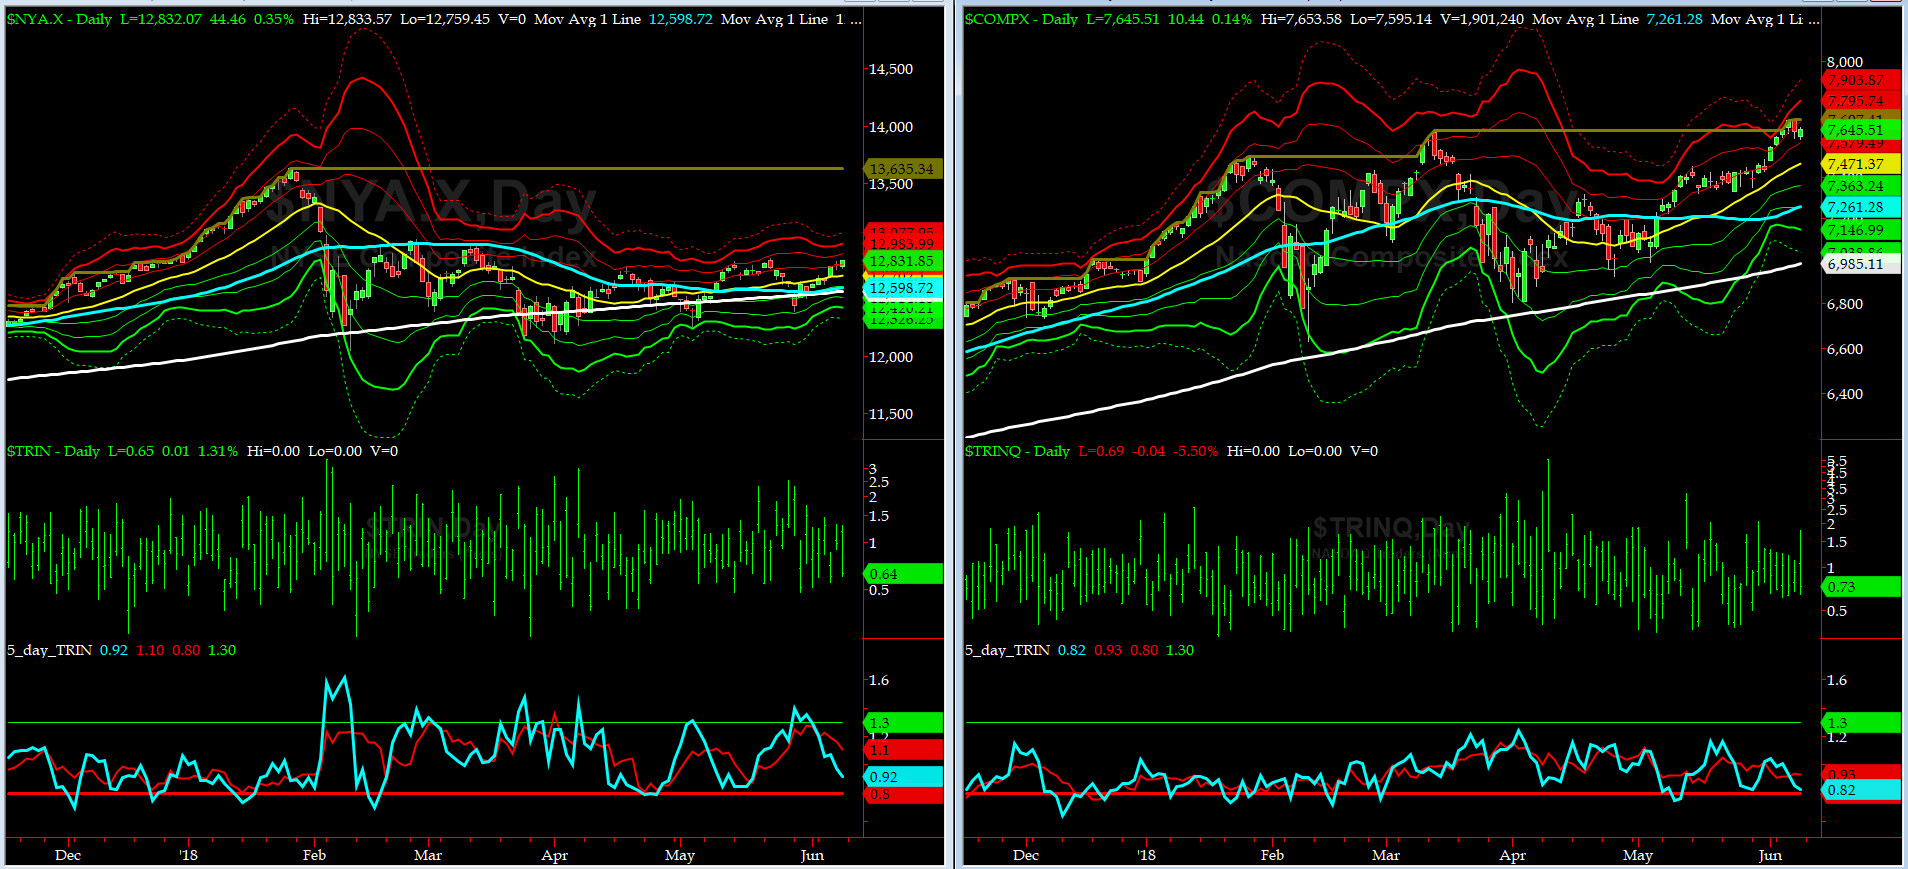
5-day TRIN & TRINQ Charts
While NYSE 5-day TRIN is in the NEUTRAL zone and heading for a SELL signal, its NASDAQ brethren, 5-day TRINQ, is nearing a SELL zone.

Components of SPX above their respective 200day MA Chart
This scoring indicator ended up a tad below 65% level, its next target will be in 68% to 72% area. This is another index we need to monitor each day this coming week.
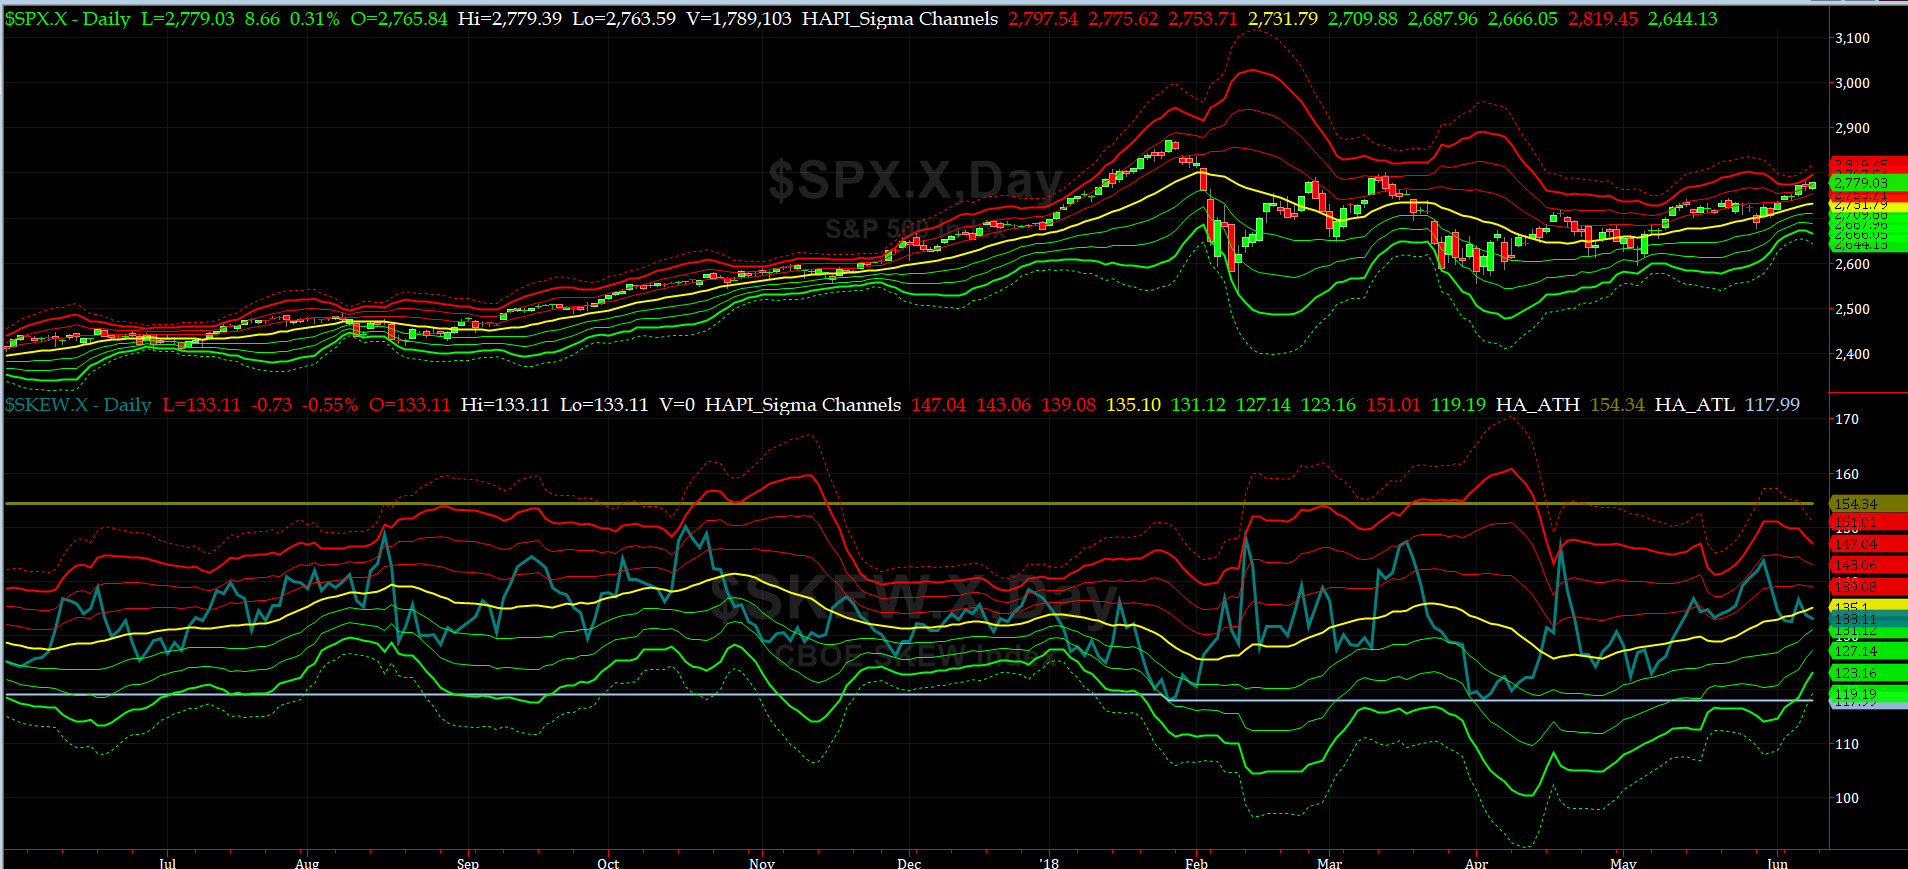
SPX SKEW (Tail Risk) Chart
On Friday, SPX SKEW (Tail Risk) closed near 133.1, a tad below its zero sigma (normal = 120-125, range 100-150).
Is all quiet on the Eastern & Mid-Western Fronts? Again, YES for now.
How to interpret the value of SPX SKEW? (from CBOE white paper on SKEW)

3-month VIX Futures Spread(VX) Chart
This popular timing indicator, (long June, & short Sept VIX Futures) is at -1.96. The signal here remains NEUTRAL.

HA_SP2 Chart
HA_SP2 = 77 (Buy signal <= 25, Sell Signal >= 75)
This coveted prop indicator is now in OVERBOUGHT zone.
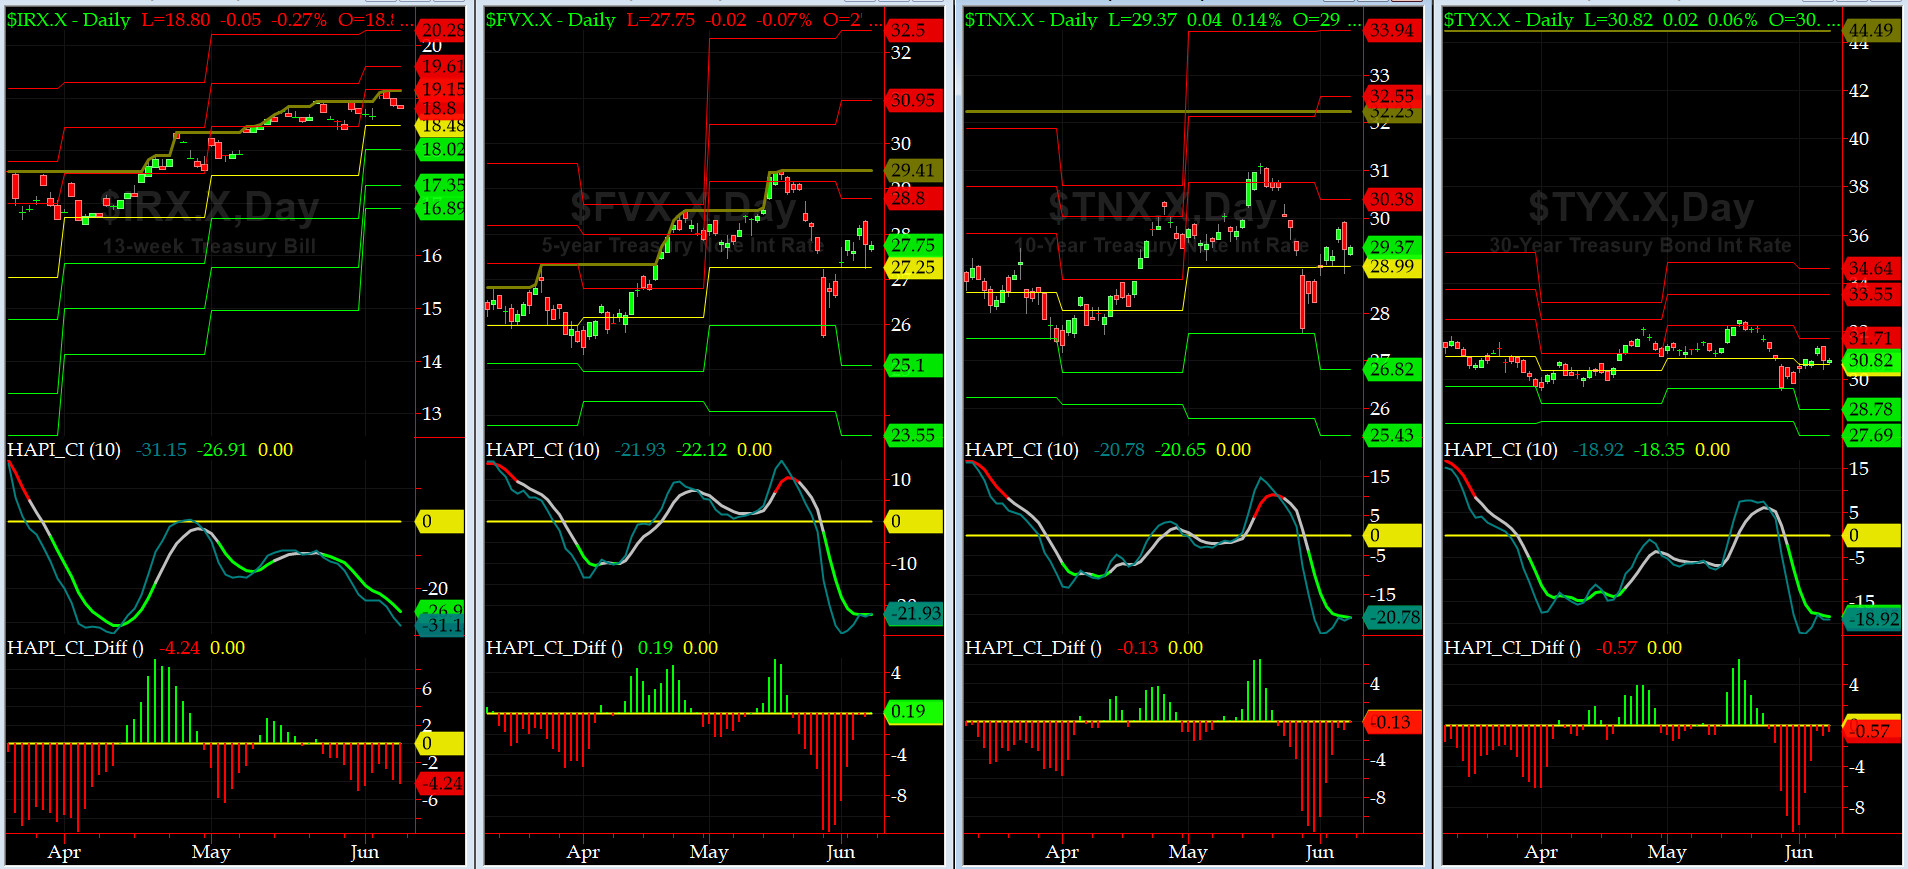
US Treasury T-Notes & T-Bonds Yields Chart
This past week, the Notes & Bonds went nowhere fast. The Maurys are not shopping for now. The Vig is under pressure. LOL.
Fari Hamzei
|


 Proactive Market Timing