
|
 |
 |
 |
 |
 |
 |
 |
 |
 Proactive Market Timing Proactive Market Timing
|
|
|
Most Recent PMT vs SPX Performance Chart

|
|
|
|
Wednesday, July 11, 2018, 1035ET
UPDATED Companion Chart for Market Bias Review, Issue #248
|
|
|
|
|
|
Wednesday, July 10, 2018, 1035ET
UPDATED Market Bias for Issue #248
Our current Market Bias with Timer Digest is SHORT SPX as of JUL 10 at 2793.84
Our previous Market Bias was LONG SPX as of JUN 28 at 2716.31
Here are the trade parameters for this week:
SPX Money Management Stop for 100% of our position = 2800
SPX BreakEven Stop (Last Open) for last 20% of our position = 2780
SPX Primary Profit Target for first 80% of our position = 2750
SPX Secondary Profit Target for last 20% of our position = 2730
|
| Action |
Asset |
Expiration |
Strike |
Option |
| BUY |
SPY |
Friday JUL 27 |
278 |
Puts |
| SELL SHORT |
SPY |
Friday JUL 27 |
273 |
Puts |
| You need to execute both legs and hold it as a Put-Spread.
|
Note A:
Once the Primary Profit Target has been reached, traders are advised to close 80% of their position in order to lock in profits. The remaining balance can be carried over with a BreakEven STOP, based on the SPX level at the time of entry, in order to make the trade a zero-risk trade with the final position running to reach the Secondary Profit Target.
Once either Secondary Profit or Money Management (BreakEven STOP after the 80% peel-off) is hit, our Option/ETF trade for that week is over. Go to Cash and wait for the next PMT Issue.
Note B:
When we change our Market Bias with Timer Digest, You need to go FLAT asap. With PMT Pro, that is before the Close that day and with the basic PMT, at the open of the next day. The following trading day, we will issue new SPX targets and a new SPY options trade, as long our new market bias with Timer Digest is NOT flat.
Fari Hamzei
|
|
|
|
|
|
Tuesday, July 10, 2018, 1815ET
Notice of Change of Bias with Timer Digest
Dear Jim,
A number of our short-term prop indicators ran up to their respective overbought zones right after Europe closed today.
We are going SHORT SPX after a 77.5 handle gain�
Cheers��..
Fari Hamzei
|
|
|
|
|
|
Monday, July 9, 2018, 0945ET
Companion Chart for Market Bias Review, Issue #248
|
|
|
|
|
|
Monday, July 9, 2018, 0945ET
Market Bias for Issue #248
Our current Market Bias with Timer Digest is LONG SPX as of JUN 28 at 2716.31
Our previous Market Bias was SHORT SPX as of JUN 18 at 2773.75
Here are the trade parameters for this week:
SPX Secondary Profit Target for last 20% of our position = 2815
SPX Primary Profit Target for first 80% of our position = 2795
SPX BreakEven Stop (Last Open) for last 20% of our position = 2768
SPX Money Management Stop for 100% of our position = 2725
|
| Action |
Asset |
Expiration |
Strike |
Option |
| BUY |
SPY |
Friday JUL 27 |
277 |
Calls |
| SELL SHORT |
SPY |
Friday JUL 27 |
281 |
Calls |
| You need to execute both legs and hold it as a Call-Spread.
|
Note A:
Once the Primary Profit Target has been reached, traders are advised to close 80% of their position in order to lock in profits. The remaining balance can be carried over with a BreakEven STOP, based on the SPX level at the time of entry, in order to make the trade a zero-risk trade with the final position running to reach the Secondary Profit Target.
Once either Secondary Profit or Money Management (BreakEven STOP after the 80% peel-off) is hit, our Option/ETF trade for that week is over. Go to Cash and wait for the next PMT Issue.
Note B:
When we change our Market Bias with Timer Digest, You need to go FLAT asap. With PMT Pro, that is before the Close that day and with the basic PMT, at the open of the next day. The following trading day, we will issue new SPX targets and a new SPY options trade, as long our new market bias with Timer Digest is NOT flat.
Fari Hamzei
|
|
|
|
|
|
Sunday, July 8th, 2018, 2100ET
Market Timing Charts, Analysis & Commentary for Issue #248

Timer Charts of S&P-500 Cash Index (SPX) + NASDAQ-100 Cash Index (NDX)
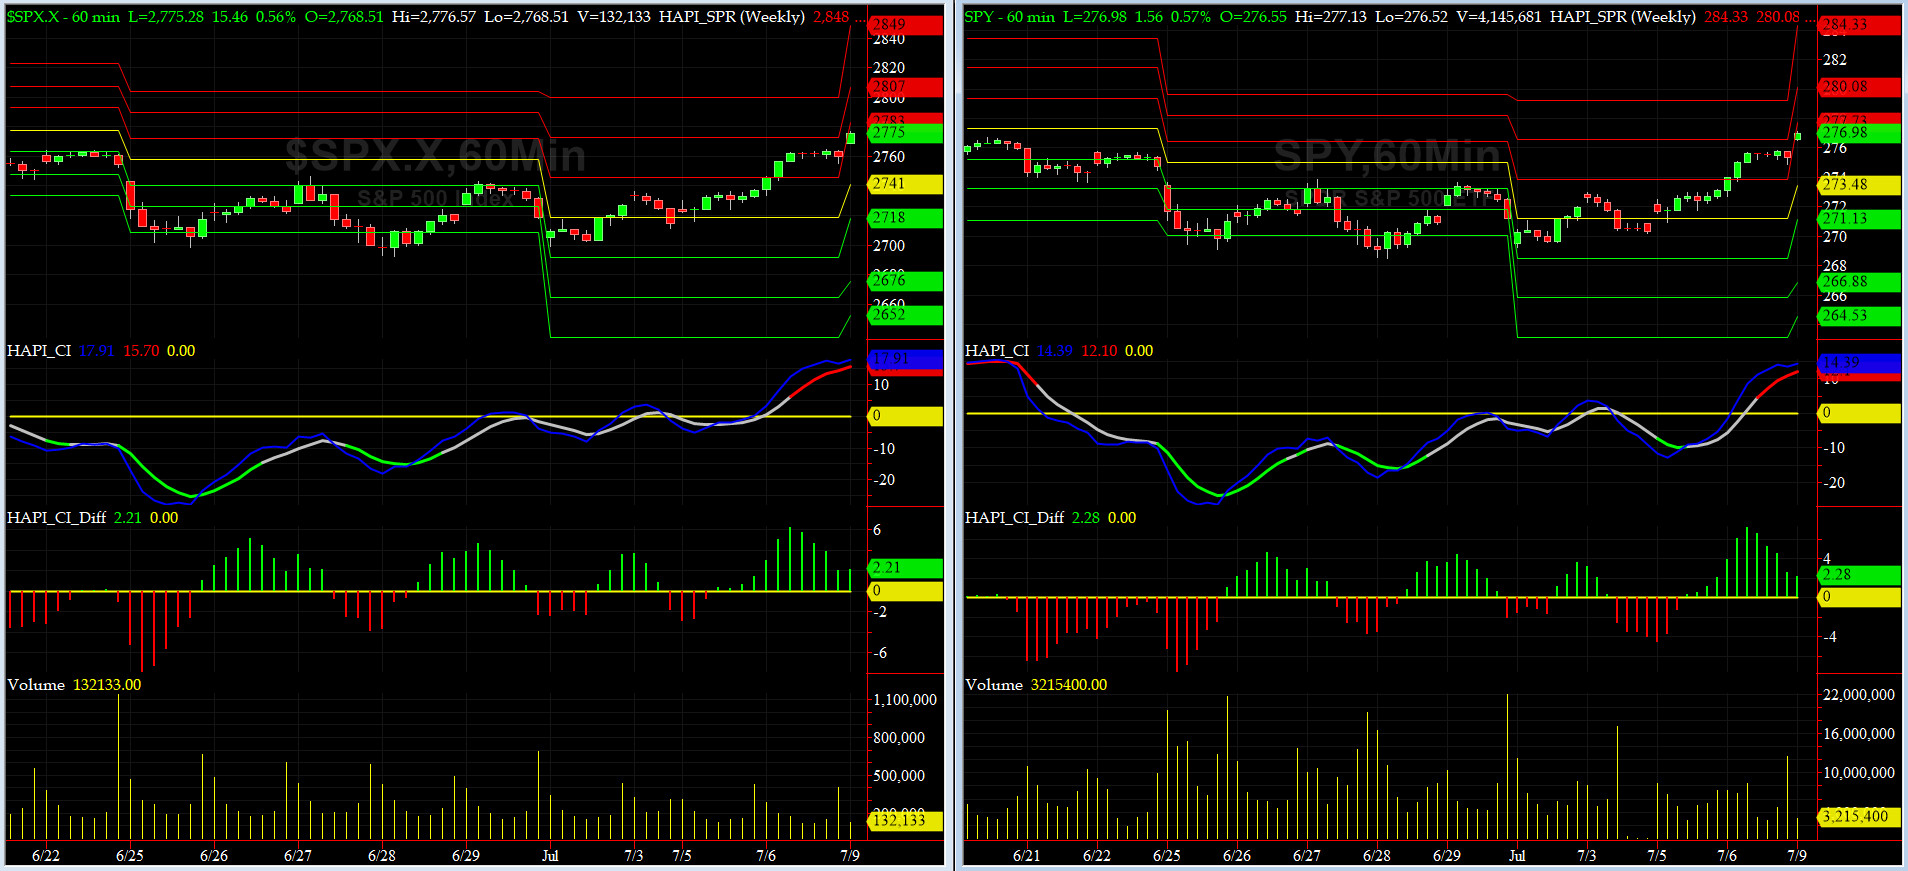
Most recent S&P-500 Cash Index (SPX): 2760 up +42 (up +1.55%) for the week ending on Friday, July 6, 2018, which closed about its +0.5 sigma.
DJIA ALL TIME INTRADAY HIGH = 26617 (reached on Friday, January 26, 2018)
TRAN ALL TIME INTRADAY HIGH = 11424 (reached on Tuesday, January 16, 2018)
SPX ALL TIME INTRADAY HIGH = 2873 (reached on Friday, January 26, 2018)
NDX ALL TIME INTRADAY HIGH = 7310 (reached on Wednesday, June 20, 2018)
RUT ALL TIME INTRADAY HIGH = 1708 (reached on Wednesday, June 20, 2018)
Current DAILY +2 Sigma SPX = 2806 with WEEKLY +2 Sigma = 2821
Current DAILY 0 Sigma (20 day MA) SPX = 2750 with WEEKLY 0 Sigma = 2708
Current DAILY -2 Sigma SPX = 2695 with WEEKLY -2 Sigma = 2595
NYSE McClellan Oscillator = +114 (-150 is start of the O/S area; around -275 to -300 area or lower, we go into the �launch-pad� mode, over +150, we are in O/B area)
NYSE Breadth Thrust = 56.6 (40 is considered as oversold and 65 as overbought)
This past week we had two great up days and one big down day. Still, Capt Tiko's SPX Primary & Secondary Profit Targets of 2745 & 2760 were destroyed on Friday, in the aftermath of June NFP Report. High of the day for SPX was 2764. Senate should start the confirmation hearing on our beloved Capt Tiko's promotion to Vice Admiral soon.
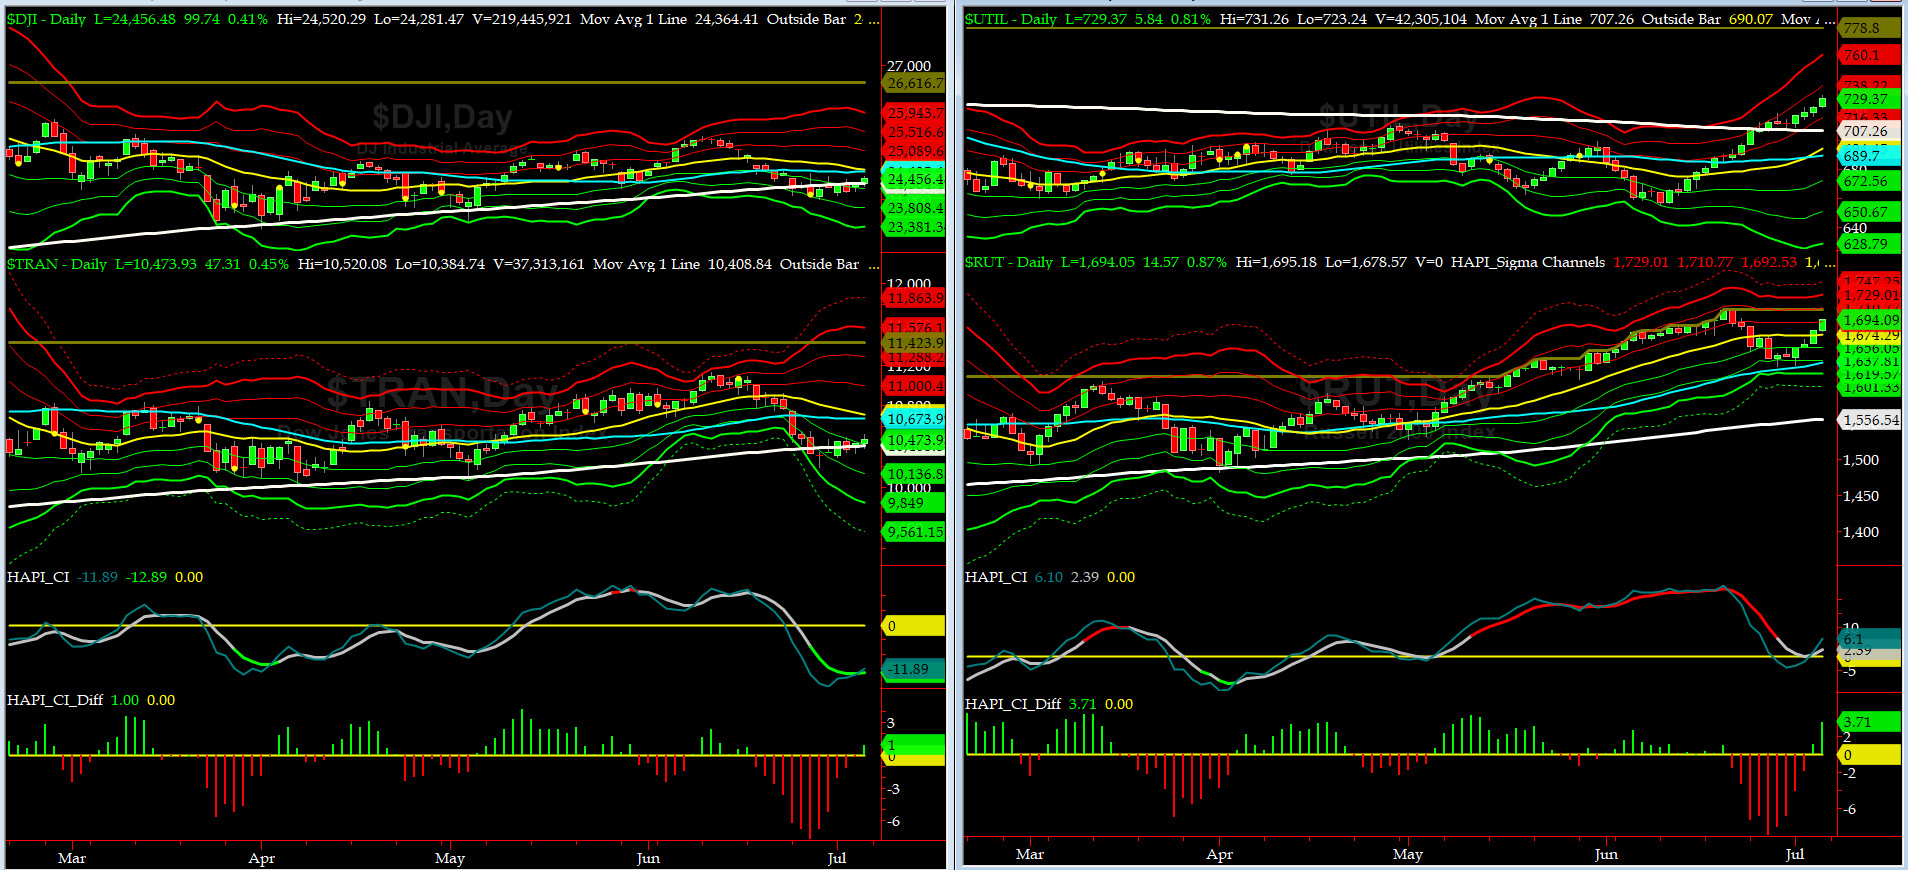
Canaries [in the Coal Mine] Chart for DJ TRAN & RUT Indices
200-Day MA DJ TRAN = 10,408 or 0.6% below DJ TRAN (max observed in last 7 yrs = 20.2%, min = -20.3%)
200-Day MA RUT = 1556 or 8.8% below RUT (max observed in last 7 yrs = 21.3%, min = -22.6%)
DJ Transportation Index (proxy for economic conditions 6 to 9 months hence) tried to get stabilized around its 200-day MA. Any mishap here by DJ TRAN will be a bad omen for the market as a whole. We shall watch TRAN this week like a hawk.
Russell 2000 Small Caps Index (proxy for Risk ON/OFF) had another awesome week after a retest failure of its 50-day MA. We think this has to do with Small Caps being least vulnerable to potential trade wars Don Grumpino & Co. may incubate. RISK is back ON.
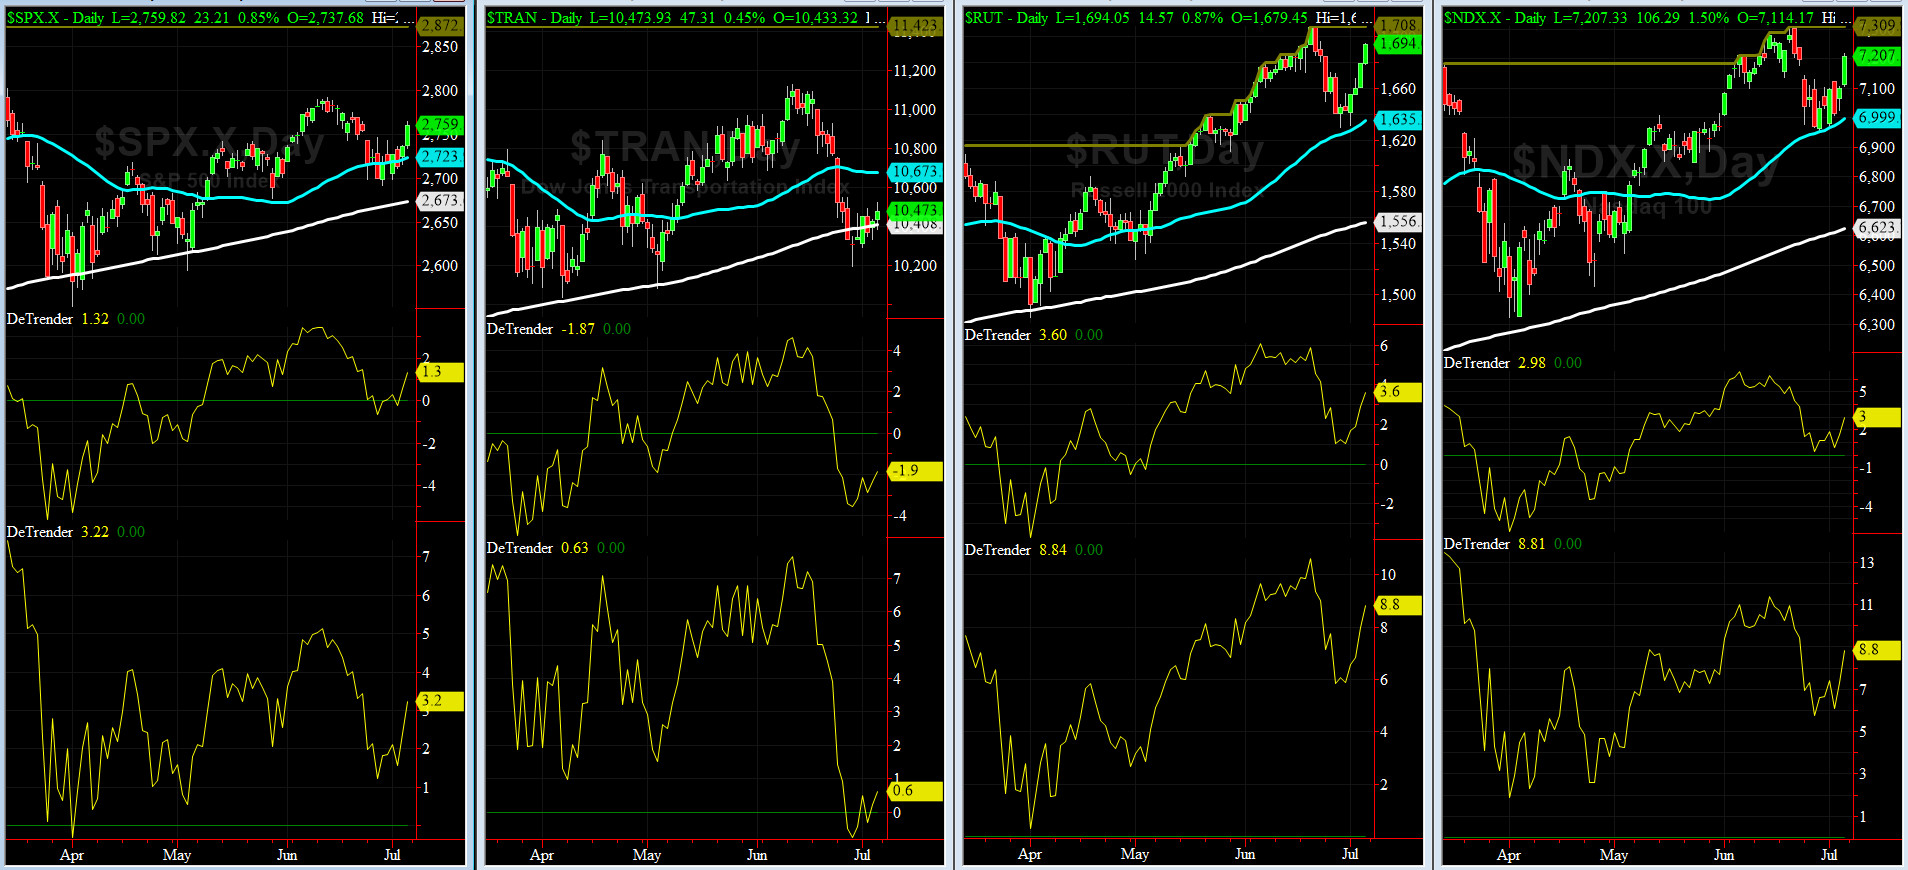
DeTrenders Charts for SPX, NDX, TRAN & RUT Indices
50-Day MA SPX = 2723 or 1.3% below SPX (max observed in last 7 yrs = +8.6%, min = -9.3%)
200-Day MA SPX = 2673 or 3.2% below SPX (max observed in last 7 yrs = 15.2%, min = -14%)
SEVEN of our EIGHT DeTrenders remain in POSITIVE territory. The DeTrenders for DJ Tran & RUT will continue to be harbingers of future price behavior in broad indices.

HA_SP1_Momo Chart
WEEKLY Timing Model = on a BUY Signal since Friday, June 15, 2018 CLOSE at 2779
DAILY Timing Model = on a BUY Signal since Friday, July 6, 2018 CLOSE at 2760
Max SPX 52wk-highs reading last week = 23 (over 120-140, the local maxima is in)
Max SPX 52wk-Lows reading last week = 11 (over 40-60, the local minima is in)
HA_SP1 closed near its +1.5 sigma channels
HA_Momo = +3.32 (reversals most likely occur above +10 or below -10)
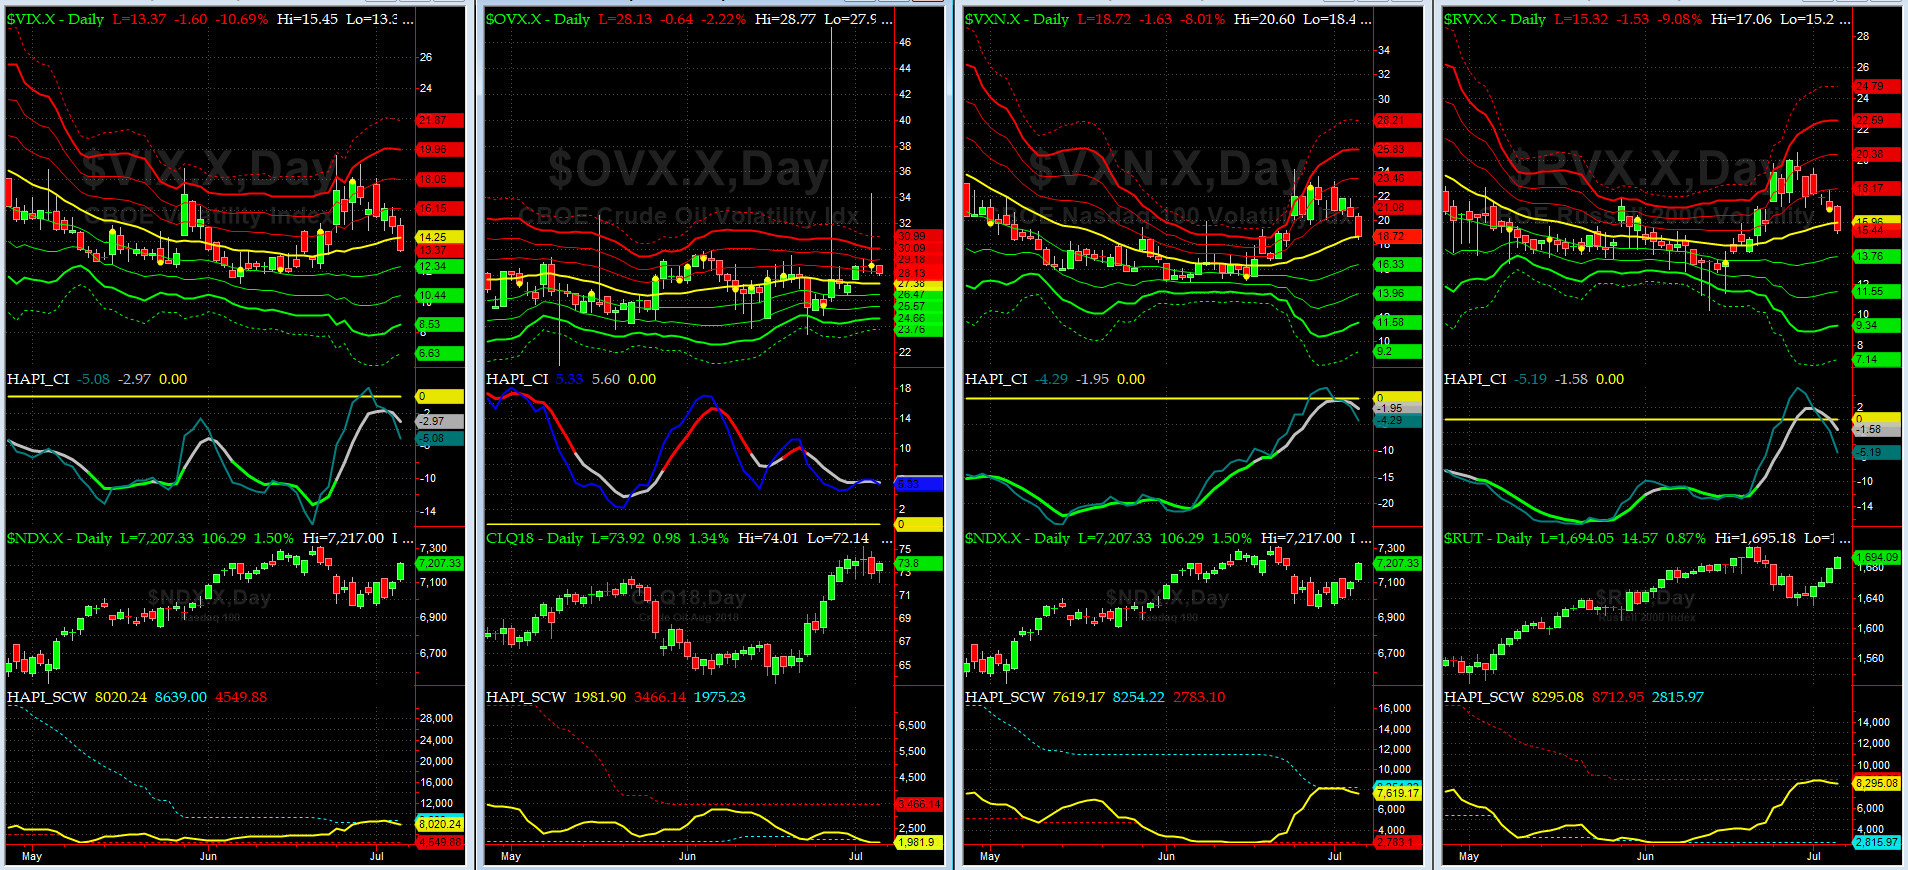
Vol of the Vols Chart
Spot VIX currently stands at 13.37, just below its zero sigma (remember it's the VIX volatility pattern aka "its sigma channels" that matters, and not the level of VIX itself (this is per Dr. Robert Whaley, a great mentor and inventor of original VIX, now called VXO). VIX usually peaks around a test of its +4 sigma).
VIX is heading down as the divergence signal we talked about last week here delivered. Cheers!!

5-day TRIN & TRINQ Charts
Both NYSE & NASDAQ 5-day TRINs are in NEUTRAL zone.
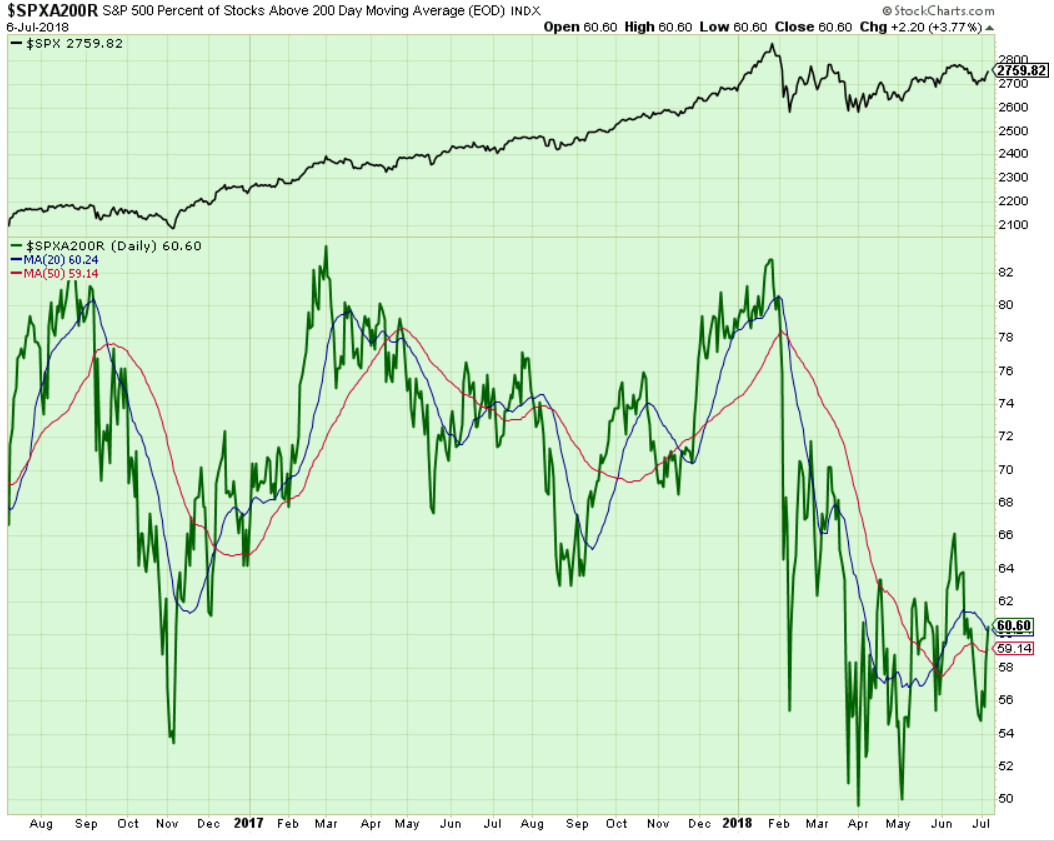
Components of SPX above their respective 200day MA Chart
This scoring indicator rallied after retested the 55% level. Should we take off here, the next level to be tested by this indicator is 66% and then break out to 72% area and then the low 80%s.

SPX SKEW (Tail Risk) Chart
On Friday, SPX SKEW (Tail Risk) closed near 141, right below its +1 sigma (normal = 120-125, range 100-150).
Is all quiet on the Eastern & Mid-Western Fronts? Our beloved Capt Tiko thinks so.
How to interpret the value of SPX SKEW? (from CBOE white paper on SKEW)

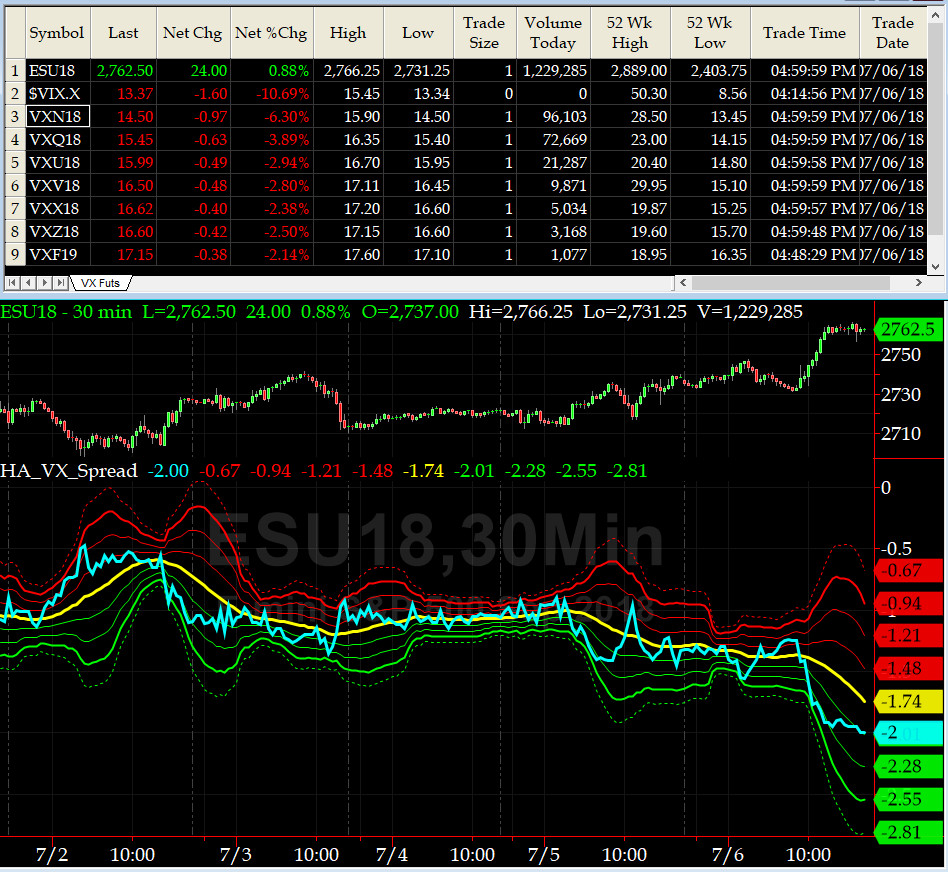
3-month VIX Futures Spread(VX) Chart
This popular timing indicator, (long July, & short Oct VIX Futures) is at -2. Right now, the signal here is NEUTRAL.
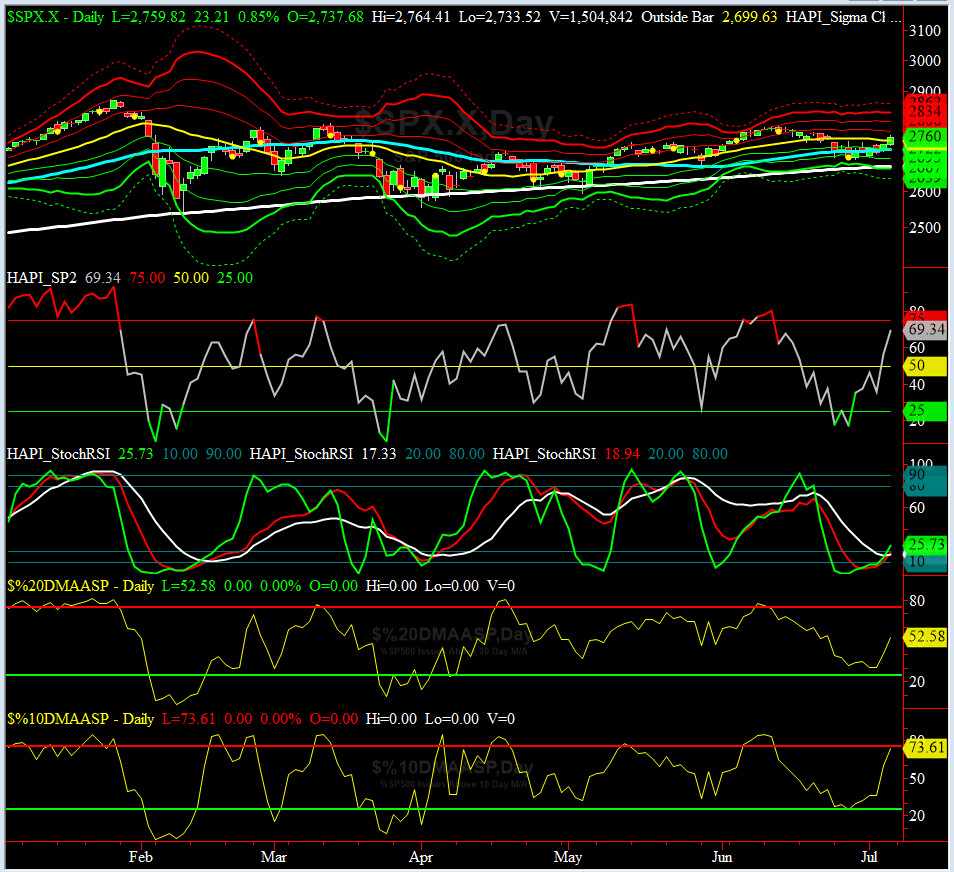
HA_SP2 Chart
HA_SP2 = 63.3 (Buy signal <= 25, Sell Signal >= 75)
This coveted prop indicator rallied hard this week. Bravo SP2, our trusted prop indicator!!!
Worth noting here is all three-timeframe StockRSIs were in oversold zone.
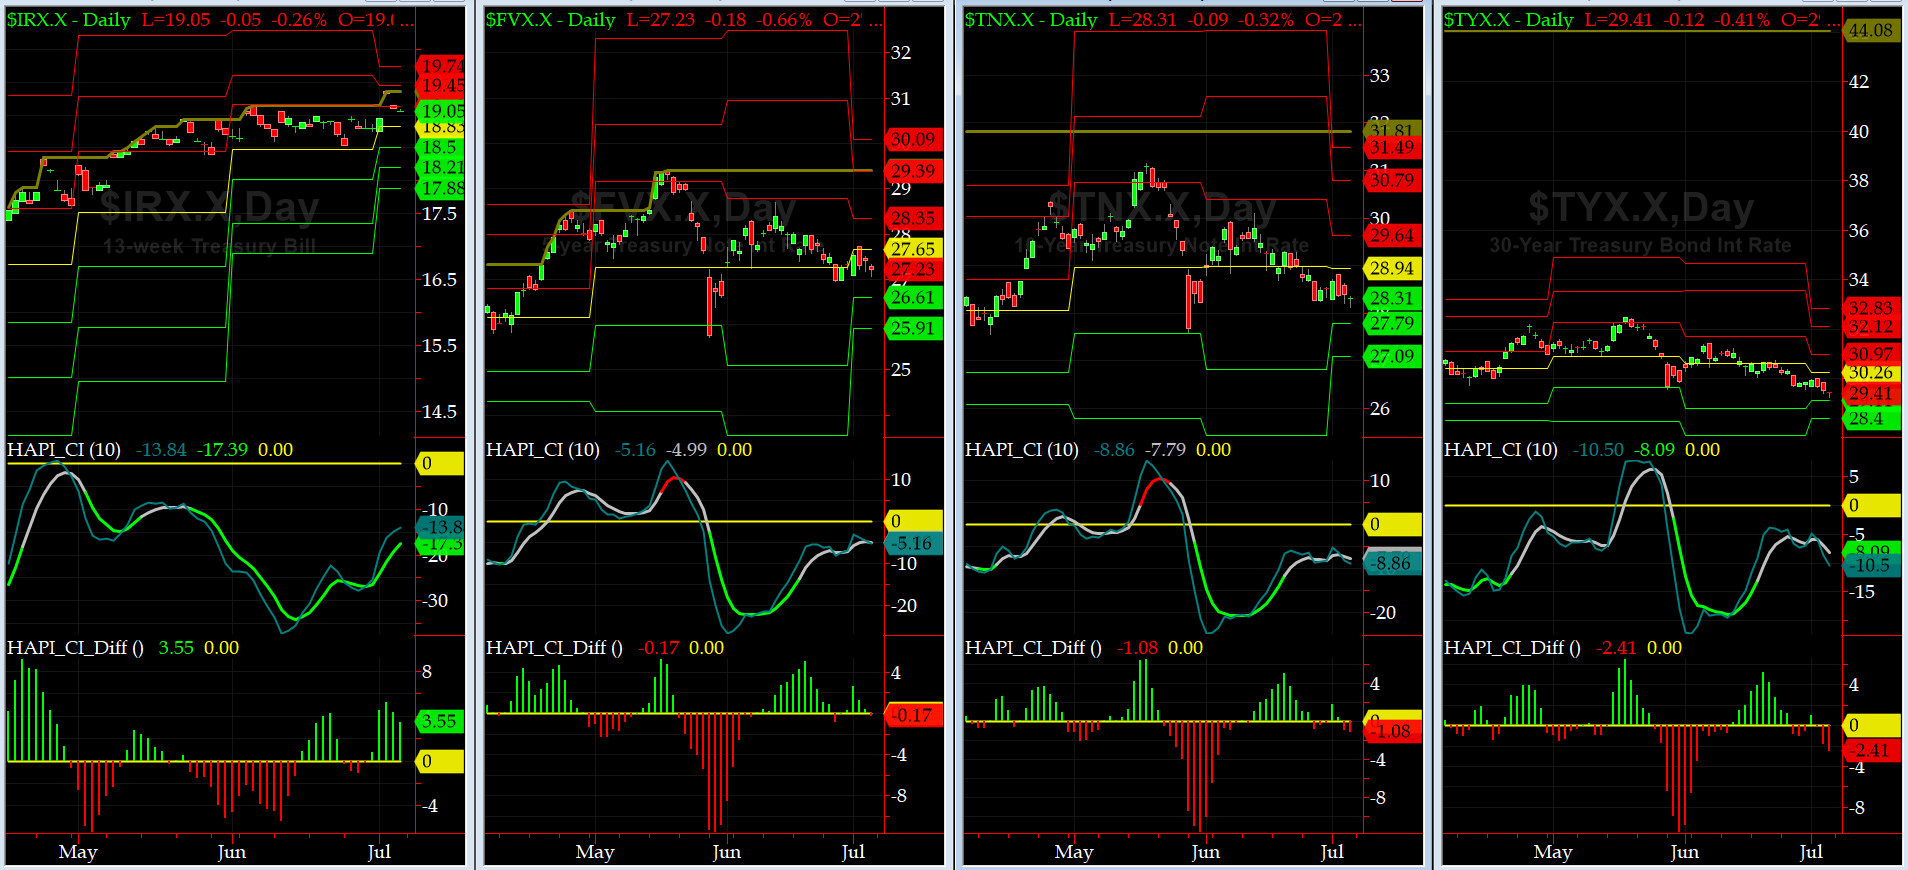
US Treasury T-Notes & T-Bonds Yields Chart
During this past week, the YTMs for the Notes & Bonds, went nowhere fast. Maury continues to worry about his future Implied Vig. LOL....
Fari Hamzei
|
|
|
|
|
|
Customer Care:
|
|
|
|
|
|
|
 |
 |
|
 |
|
 |
 |
 |
HA YouTube Channel ::: HA Blog ::: Testimonials ::: Tutorials & FAQs ::: Privacy Policy
|
Trading Derivatives (Options & Futures) contains substantial risk and is not for every investor. An investor could potentially lose all or more than his/her initial investment.
Only risk capital should be used for trading and only those with sufficient risk capital should consider trading derivatives. Past performance is not
necessarily indicative of future results. Testimonials appearing on this website may not be representative of other clients or customers
and are not a guarantee of future performance or success.
|
| (c) 1998-2025, Hamzei Analytics, LLC.® All Rights Reserved. |
|
|