
|
 |
 |
 |
 |
 |
 |
 |
 |
 Proactive Market Timing Proactive Market Timing
|
|
|
Most Recent PMT vs SPX Performance Chart

|
|
|
|
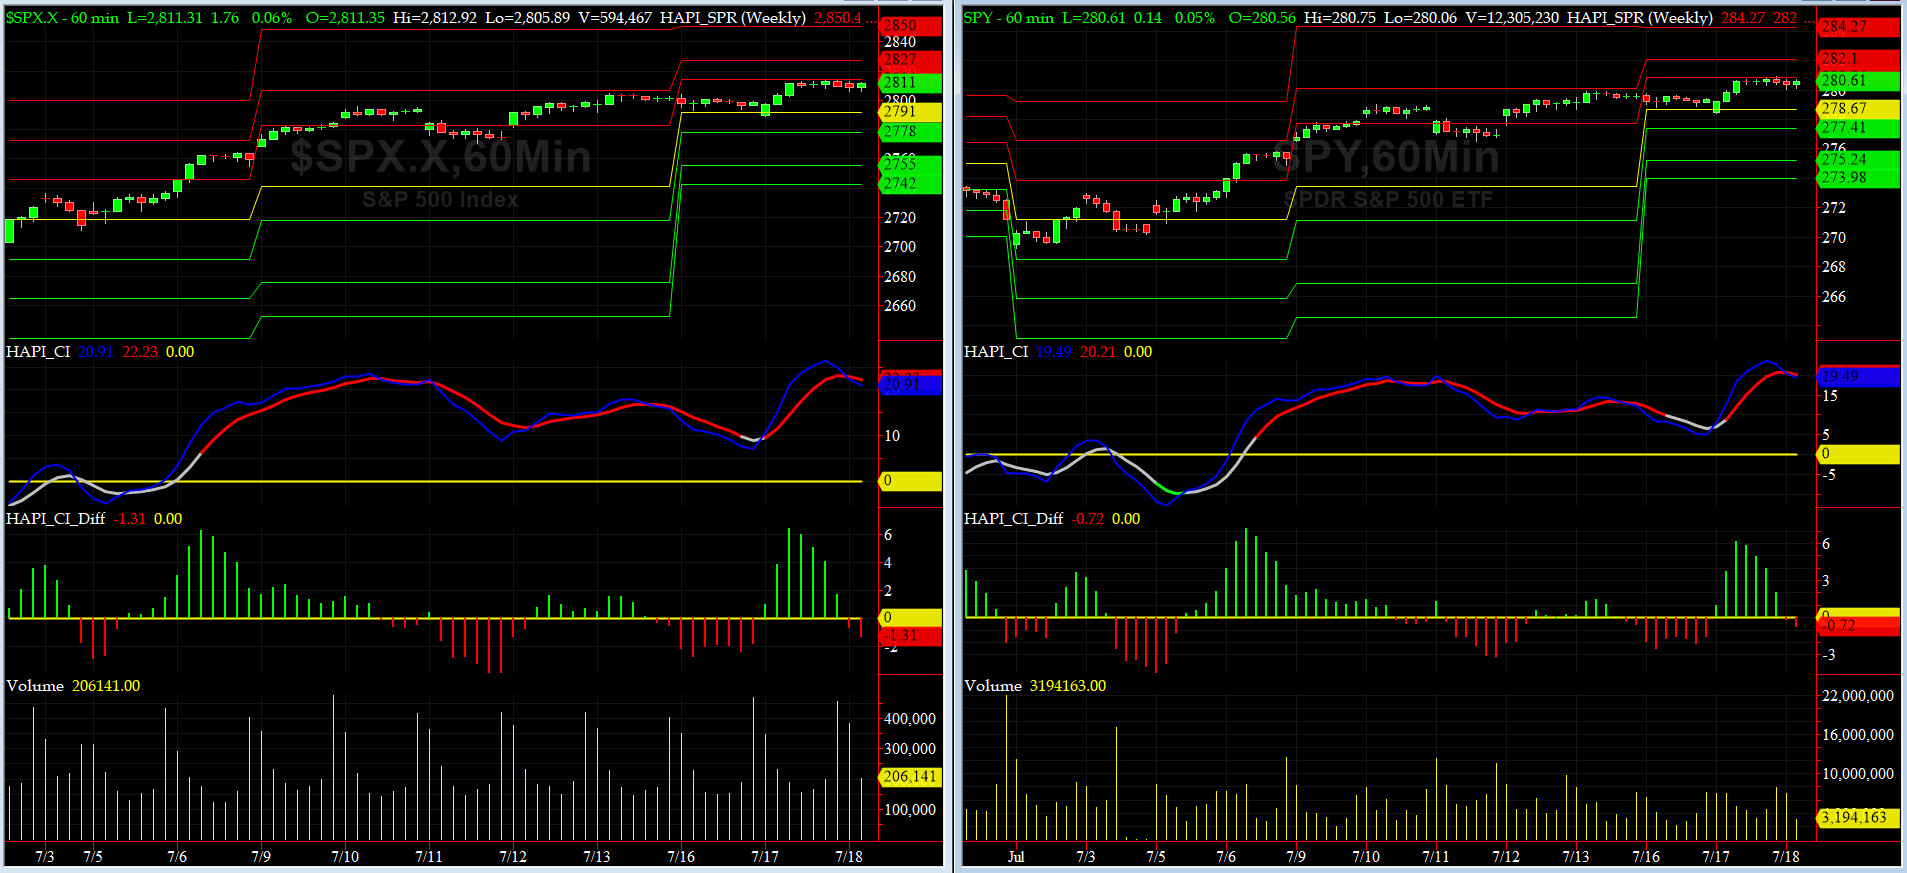
Wednesday, July 18, 2018, 1115ET
UPDATED Companion Chart for Market Bias Review, Issue #249
|
|
|
|
|
|
Wednesday, July 18, 2018, 1110ET
UPDATED Market Bias for Issue #249
Our current Market Bias with Timer Digest is LONG SPX as of JUL 17 at 2809.55
Our previous Market Bias was SHORT SPX as of JUL 10 at 2793.84
Here are the trade parameters for this week:
SPX Secondary Profit Target for last 20% of our position = 2850
SPX Primary Profit Target for first 80% of our position = 2835
SPX BreakEven Stop (Last Open) for last 20% of our position = 2811
SPX Money Management Stop for 100% of our position = 2795
|
| Action |
Asset |
Expiration |
Strike |
Option |
| BUY |
SPY |
Friday AUG 10 |
281 |
Calls |
| SELL SHORT |
SPY |
Friday AUG 10 |
285 |
Calls |
| You need to execute both legs and hold it as a Call-Spread.
|
Note A:
Once the Primary Profit Target has been reached, traders are advised to close 80% of their position in order to lock in profits. The remaining balance can be carried over with a BreakEven STOP, based on the SPX level at the time of entry, in order to make the trade a zero-risk trade with the final position running to reach the Secondary Profit Target.
Once either Secondary Profit or Money Management (BreakEven STOP after the 80% peel-off) is hit, our Option/ETF trade for that week is over. Go to Cash and wait for the next PMT Issue.
Note B:
When we change our Market Bias with Timer Digest, You need to go FLAT asap. With PMT Pro, that is before the Close that day and with the basic PMT, at the open of the next day. The following trading day, we will issue new SPX targets and a new SPY options trade, as long our new market bias with Timer Digest is NOT flat.
Fari Hamzei
|
|
|
|
|
|
Tuesday, July 17, 2018, 1609ET
Notice of Change of Bias with Timer Digest
Dear Jim,
Today�s strong rebound in futures speaks volume for the size of the bid to this market.
Getting LONG SPX here���.
Fari Hamzei
|
|
|
|
|
|
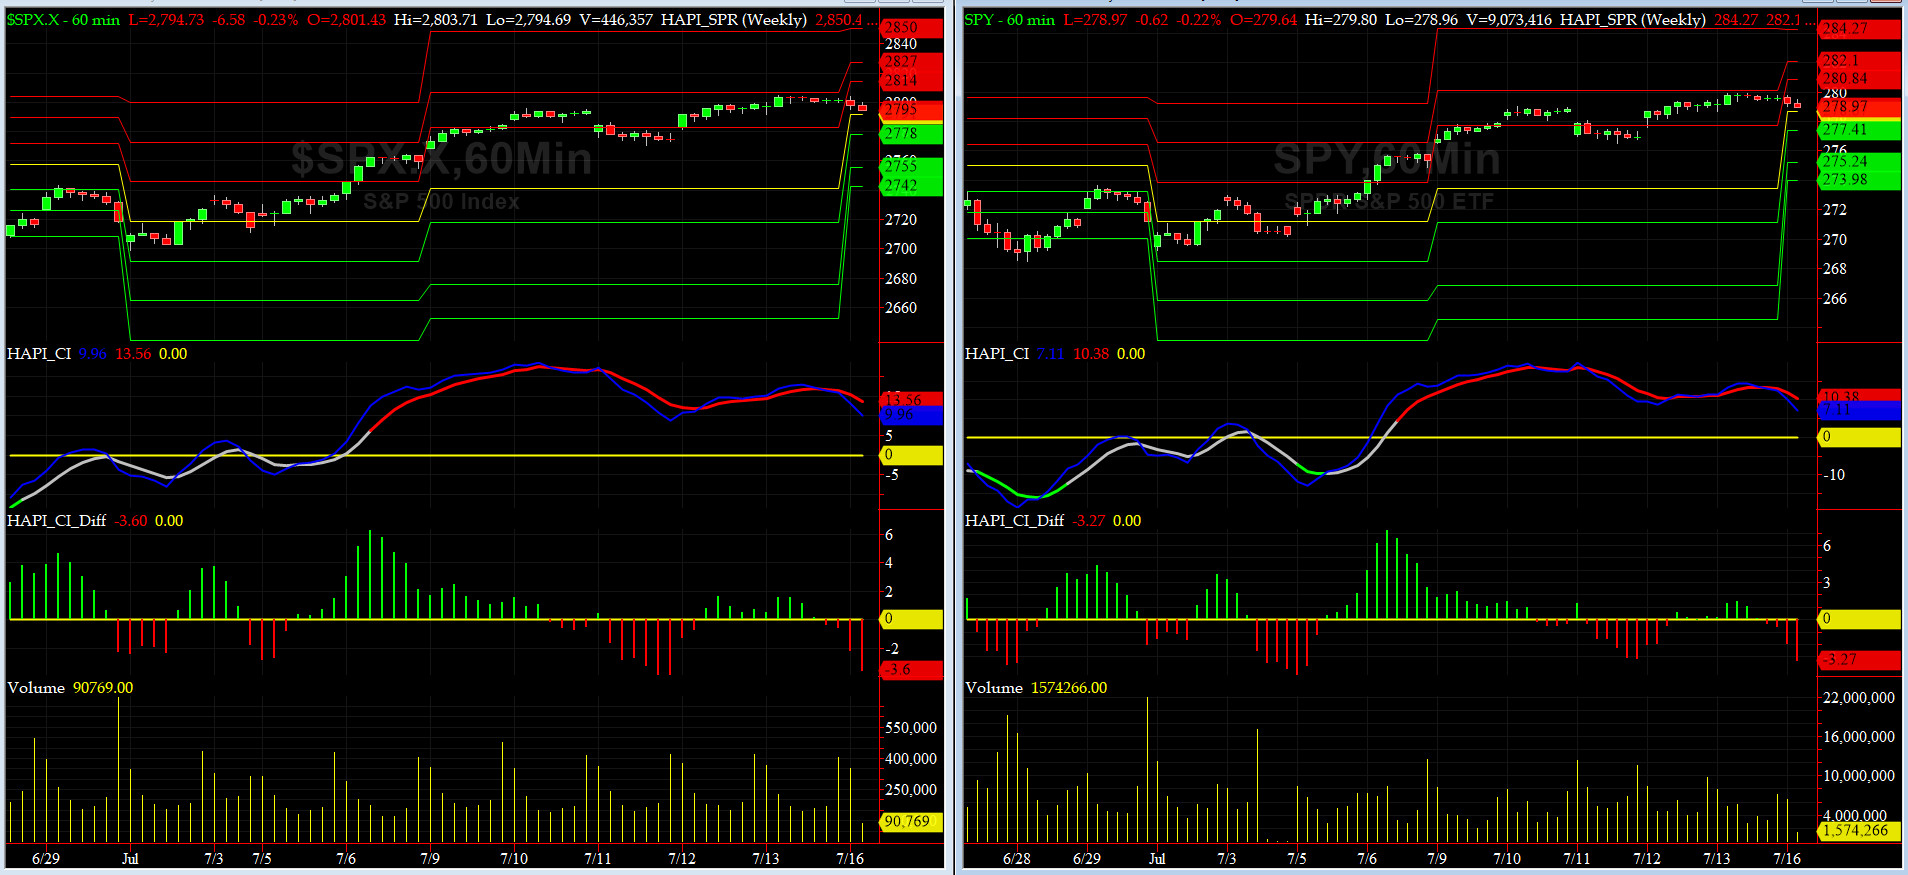
Monday, July 16, 2018, 1050ET
Companion Chart for Market Bias Review, Issue #249
|
|
|
|
|
|
Monday, July 16, 2018, 1035ET
Market Bias for Issue #249
Our current Market Bias with Timer Digest is SHORT SPX as of JUL 10 at 2793.84
Our previous Market Bias was LONG SPX as of JUN 28 at 2716.31
Here are the trade parameters for this week:
SPX Money Management Stop for 100% of our position = 2815
SPX BreakEven Stop (Last Open) for last 20% of our position = 2801
SPX Primary Profit Target for first 80% of our position = 2755
SPX Secondary Profit Target for last 20% of our position = 2740
|
| Action |
Asset |
Expiration |
Strike |
Option |
| BUY |
SPY |
Friday AUG 3 |
279 |
Puts |
| SELL SHORT |
SPY |
Friday AUG 3 |
274 |
Puts |
| You need to execute both legs and hold it as a Put-Spread.
|
Note A:
Once the Primary Profit Target has been reached, traders are advised to close 80% of their position in order to lock in profits. The remaining balance can be carried over with a BreakEven STOP, based on the SPX level at the time of entry, in order to make the trade a zero-risk trade with the final position running to reach the Secondary Profit Target.
Once either Secondary Profit or Money Management (BreakEven STOP after the 80% peel-off) is hit, our Option/ETF trade for that week is over. Go to Cash and wait for the next PMT Issue.
Note B:
When we change our Market Bias with Timer Digest, You need to go FLAT asap. With PMT Pro, that is before the Close that day and with the basic PMT, at the open of the next day. The following trading day, we will issue new SPX targets and a new SPY options trade, as long our new market bias with Timer Digest is NOT flat.
Fari Hamzei
|
|
|
|
|
|
Sunday, July 15th, 2018, 1500ET
Market Timing Charts, Analysis & Commentary for Issue #249
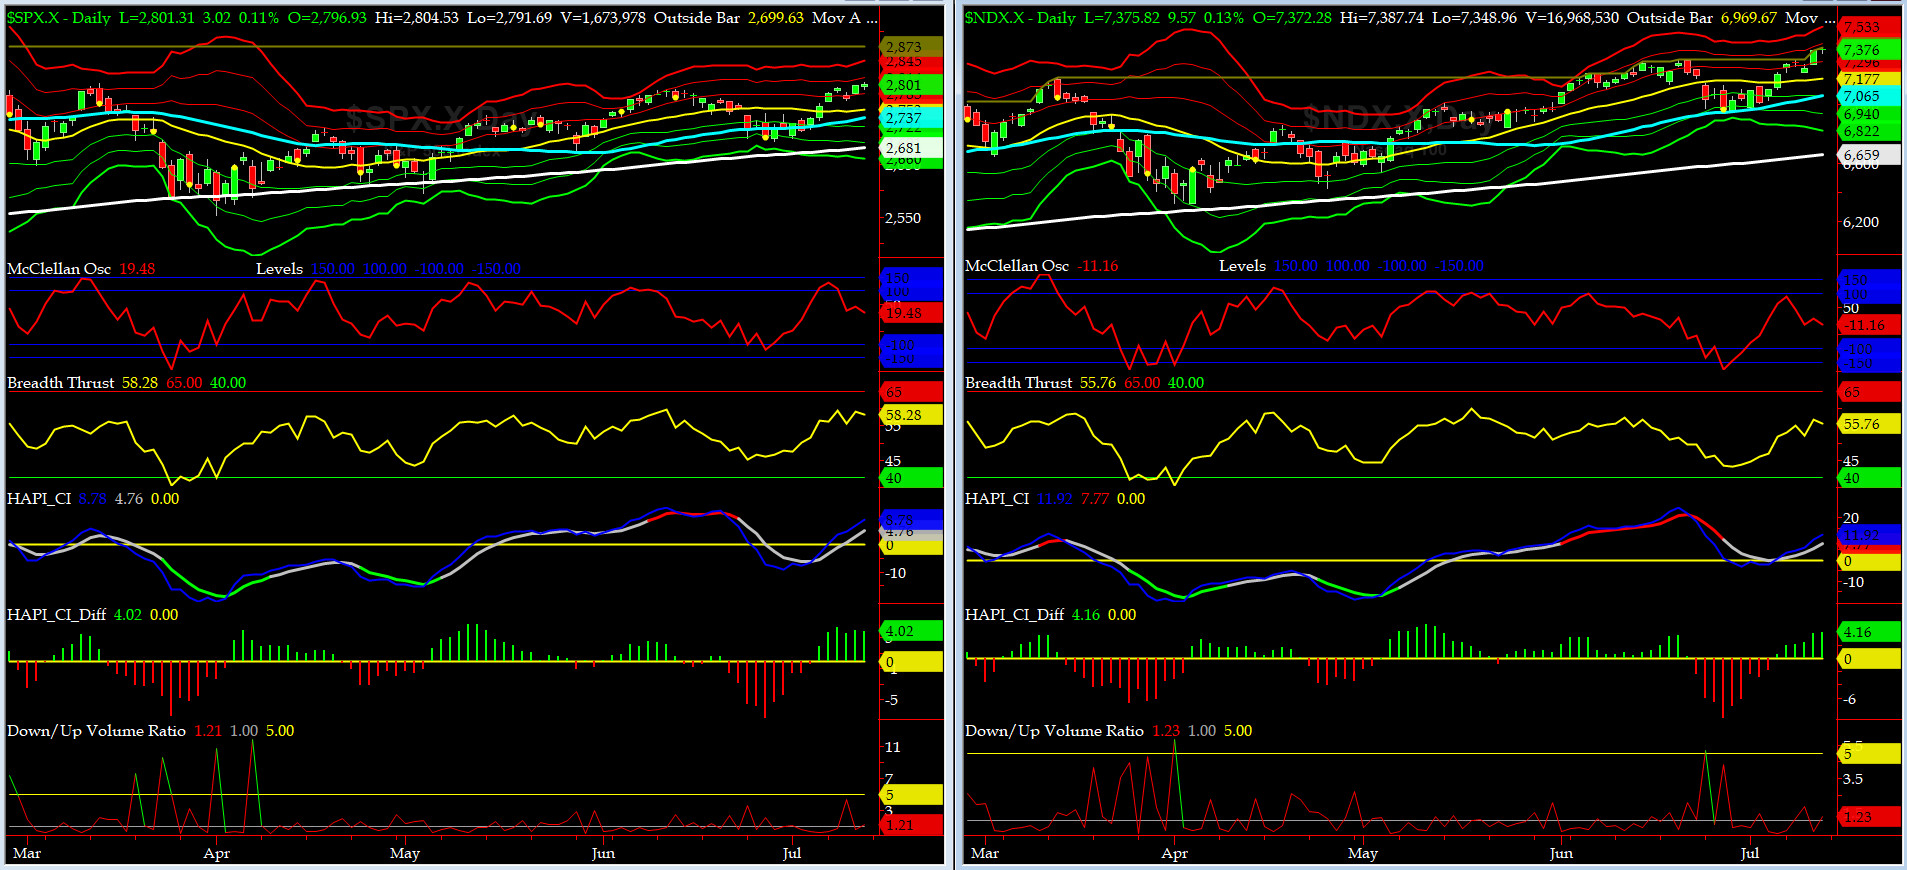
Timer Charts of S&P-500 Cash Index (SPX) + NASDAQ-100 Cash Index (NDX)
Most recent S&P-500 Cash Index (SPX): 2801 up +41 (up +1.49%) for the week ending on Friday, July 13, 2018, which closed about its +1.5 sigma.
DJIA ALL TIME INTRADAY HIGH = 26617 (reached on Friday, January 26, 2018)
TRAN ALL TIME INTRADAY HIGH = 11424 (reached on Tuesday, January 16, 2018)
SPX ALL TIME INTRADAY HIGH = 2873 (reached on Friday, January 26, 2018)
NDX ALL TIME INTRADAY HIGH = 7387 (reached on Friday, July 13, 2018)
RUT ALL TIME INTRADAY HIGH = 1708 (reached on Tuesday, July 10, 2018)
Current DAILY +2 Sigma SPX = 2814 with WEEKLY +2 Sigma = 2829
Current DAILY 0 Sigma (20 day MA) SPX = 2753 with WEEKLY 0 Sigma = 2711
Current DAILY -2 Sigma SPX = 2691 with WEEKLY -2 Sigma = 2592
NYSE McClellan Oscillator = +19 (-150 is start of the O/S area; around -275 to -300 area or lower, we go into the �launch-pad� mode, over +150, we are in O/B area)
NYSE Breadth Thrust = 58.3 (40 is considered as oversold and 65 as overbought)
For the longs this was a great week -- on the long side we hit our primary price target on Tuesday right about the end of first hour, and then by the time Europe closed, our short-term momentum indicators were giving solid overbought signals so we shorted SPX that night with Timer Digest. Wednesday was a glorious day for shorts but we gave it most of it back on Thursday. Friday was another Summer snoozer.
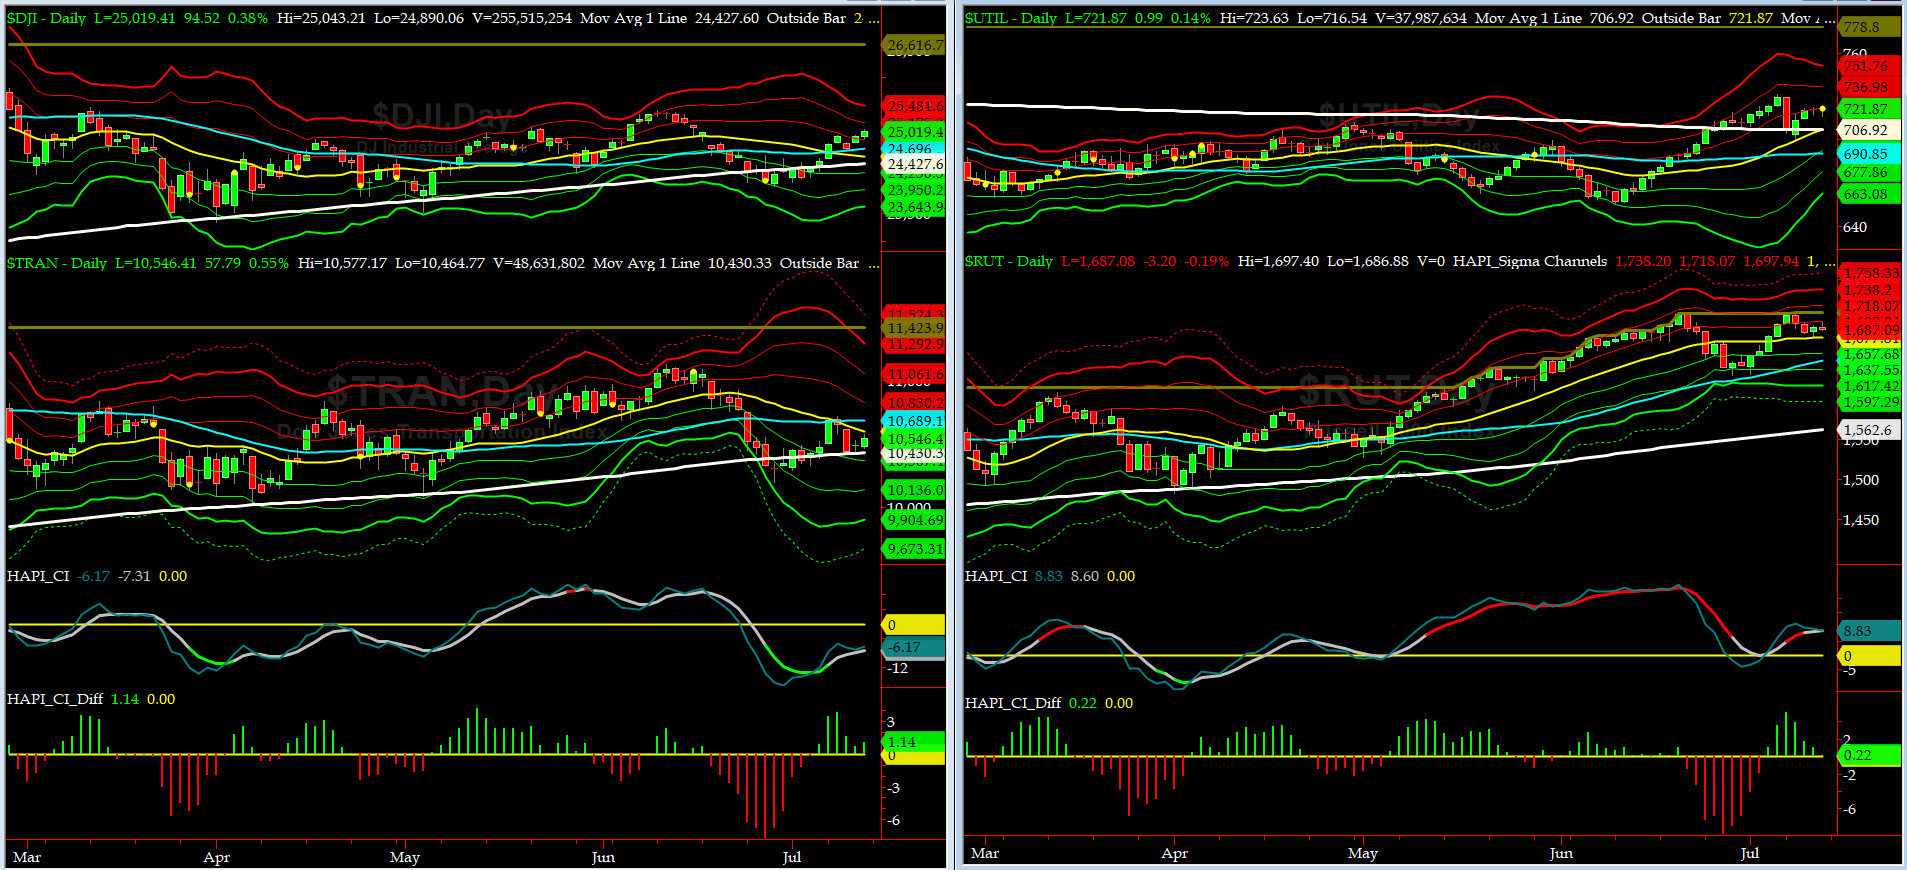
Canaries [in the Coal Mine] Chart for DJ TRAN & RUT Indices
200-Day MA DJ TRAN = 10,430 or 1.1% below DJ TRAN (max observed in last 7 yrs = 20.2%, min = -20.3%)
200-Day MA RUT = 1562 or 8.0% below RUT (max observed in last 7 yrs = 21.3%, min = -22.6%)
DJ Transportation Index (proxy for economic conditions 6 to 9 months hence) is still in a tight wedge shape bounded between 20-day, 50-day and 200-day MAs. We need to keep watching this index. Always a good [big] tell for future market direction.
Russell 2000 Small Caps Index (proxy for Risk ON/OFF) had another good week and put in another ATH, albeit a very marginal one. RISK remains ON.
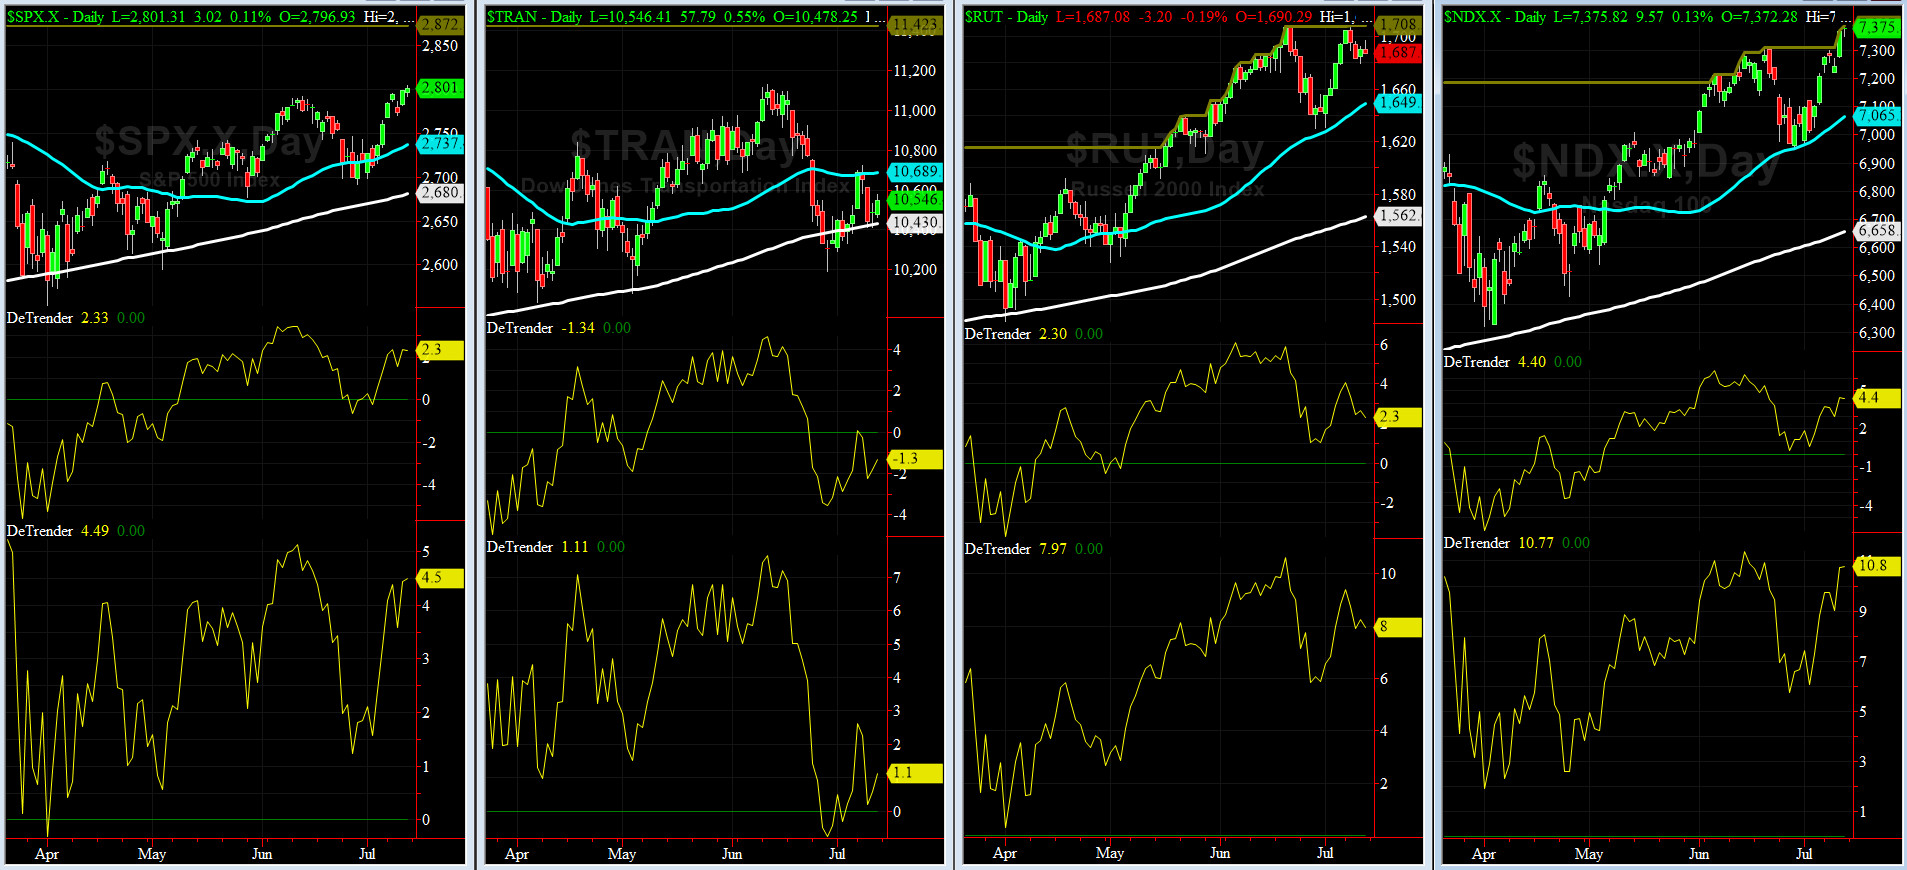
DeTrenders Charts for SPX, NDX, TRAN & RUT Indices
50-Day MA SPX = 2737 or 2.3% below SPX (max observed in last 7 yrs = +8.6%, min = -9.3%)
200-Day MA SPX = 2680 or 4.5% below SPX (max observed in last 7 yrs = 15.2%, min = -14%)
SEVEN of our EIGHT DeTrenders remain in POSITIVE territory. The DeTrenders for DJ Tran & RUT will continue to be harbingers of future price behavior in broad indices.
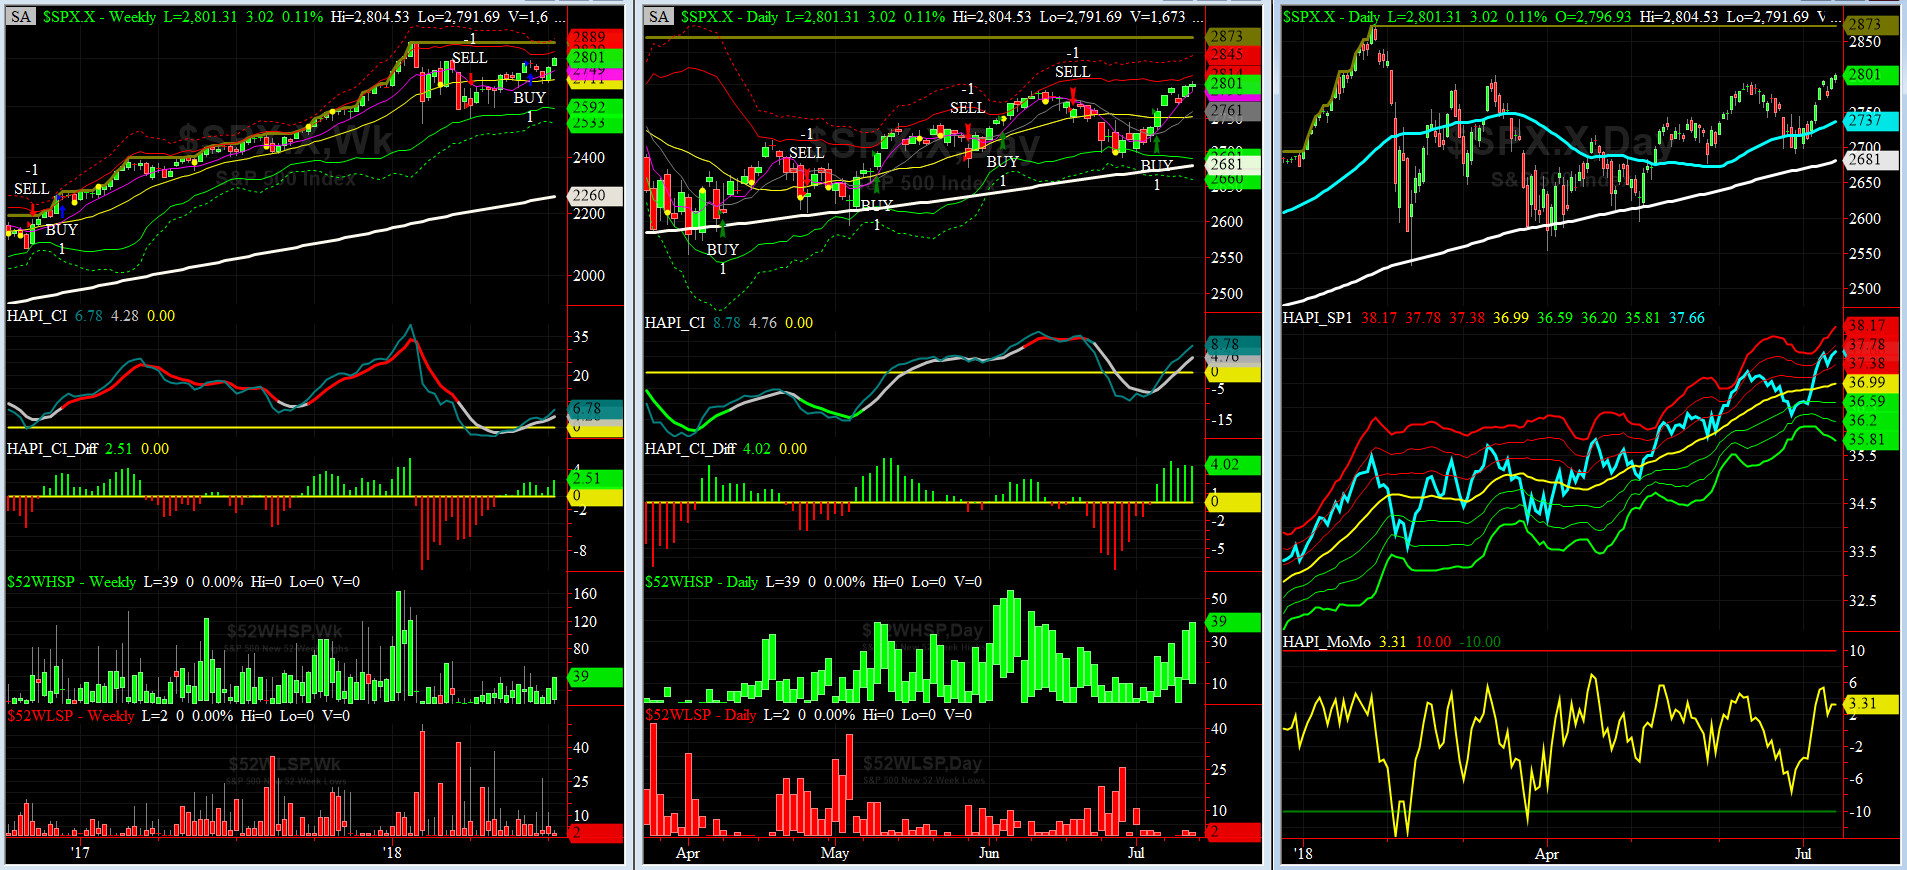
HA_SP1_Momo Chart
WEEKLY Timing Model = on a BUY Signal since Friday, June 15, 2018 CLOSE at 2779
DAILY Timing Model = on a BUY Signal since Friday, July 6, 2018 CLOSE at 2760
Max SPX 52wk-highs reading last week = 39 (over 120-140, the local maxima is in)
Max SPX 52wk-Lows reading last week = 3 (over 40-60, the local minima is in)
HA_SP1 closed above its +1.5 sigma channels
HA_Momo = +3.31 (reversals most likely occur above +10 or below -10)
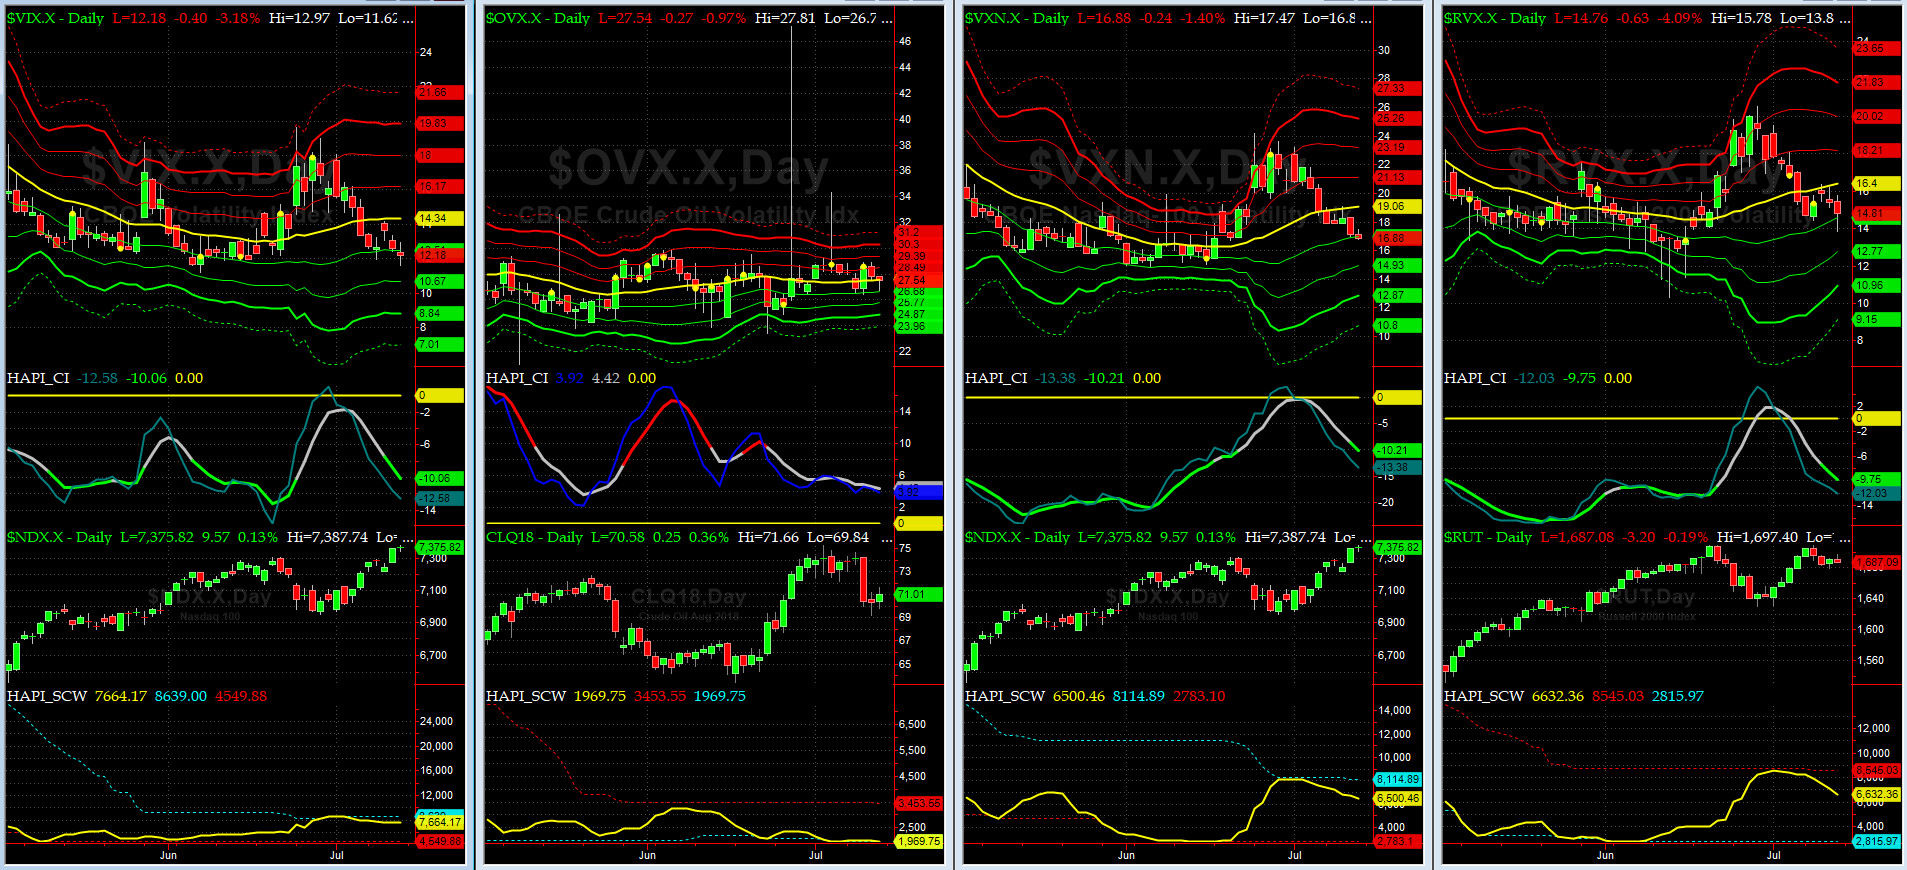
Vol of the Vols Chart
Spot VIX currently stands at 12.18, just below its -1 sigma (remember it's the VIX volatility pattern aka "its sigma channels" that matters, and not the level of VIX itself (this is per Dr. Robert Whaley, a great mentor and inventor of original VIX, now called VXO). VIX usually peaks around a test of its +4 sigma).
VIX contiues to head down; should it trade in sub-10 then we need to act!!
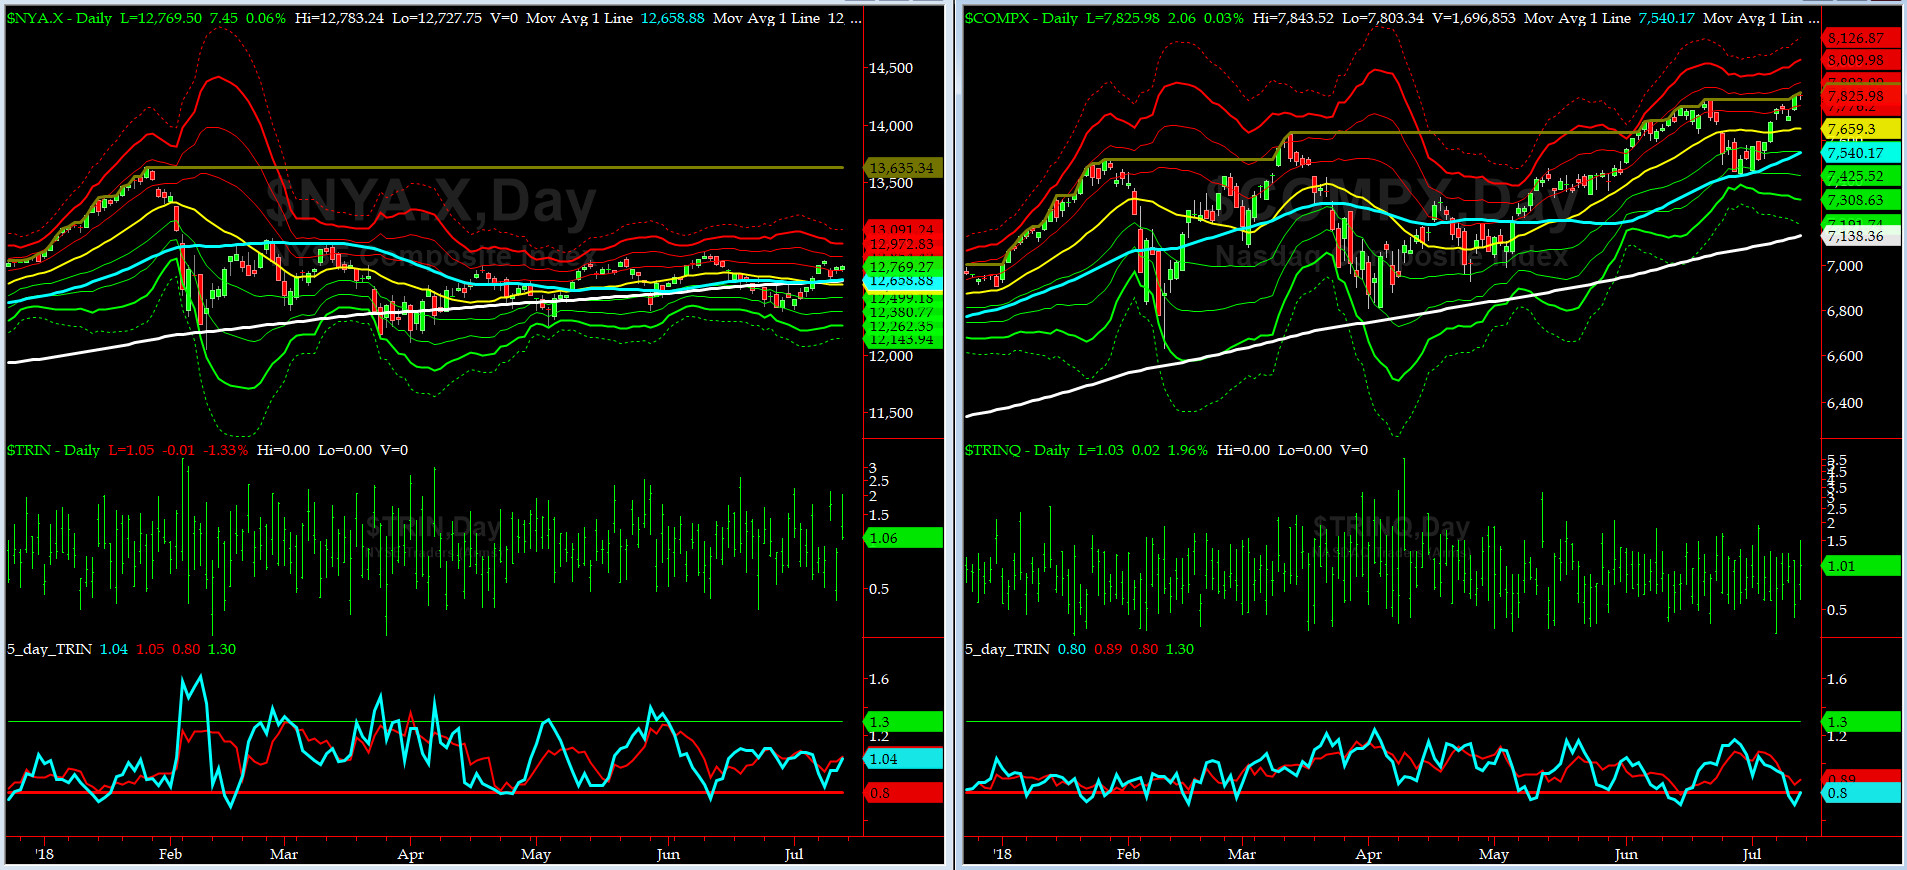
5-day TRIN & TRINQ Charts
NYSE 5-day TRIN is in NEUTRAL zone. NASDAQs is on a SELL.

Components of SPX above their respective 200day MA Chart
This scoring indicator, for now, has stalled in the low 60 levels. Should we take off here, the next level to be tested by this indicator is 66% and then break out to 72% area and then the low 80%s.
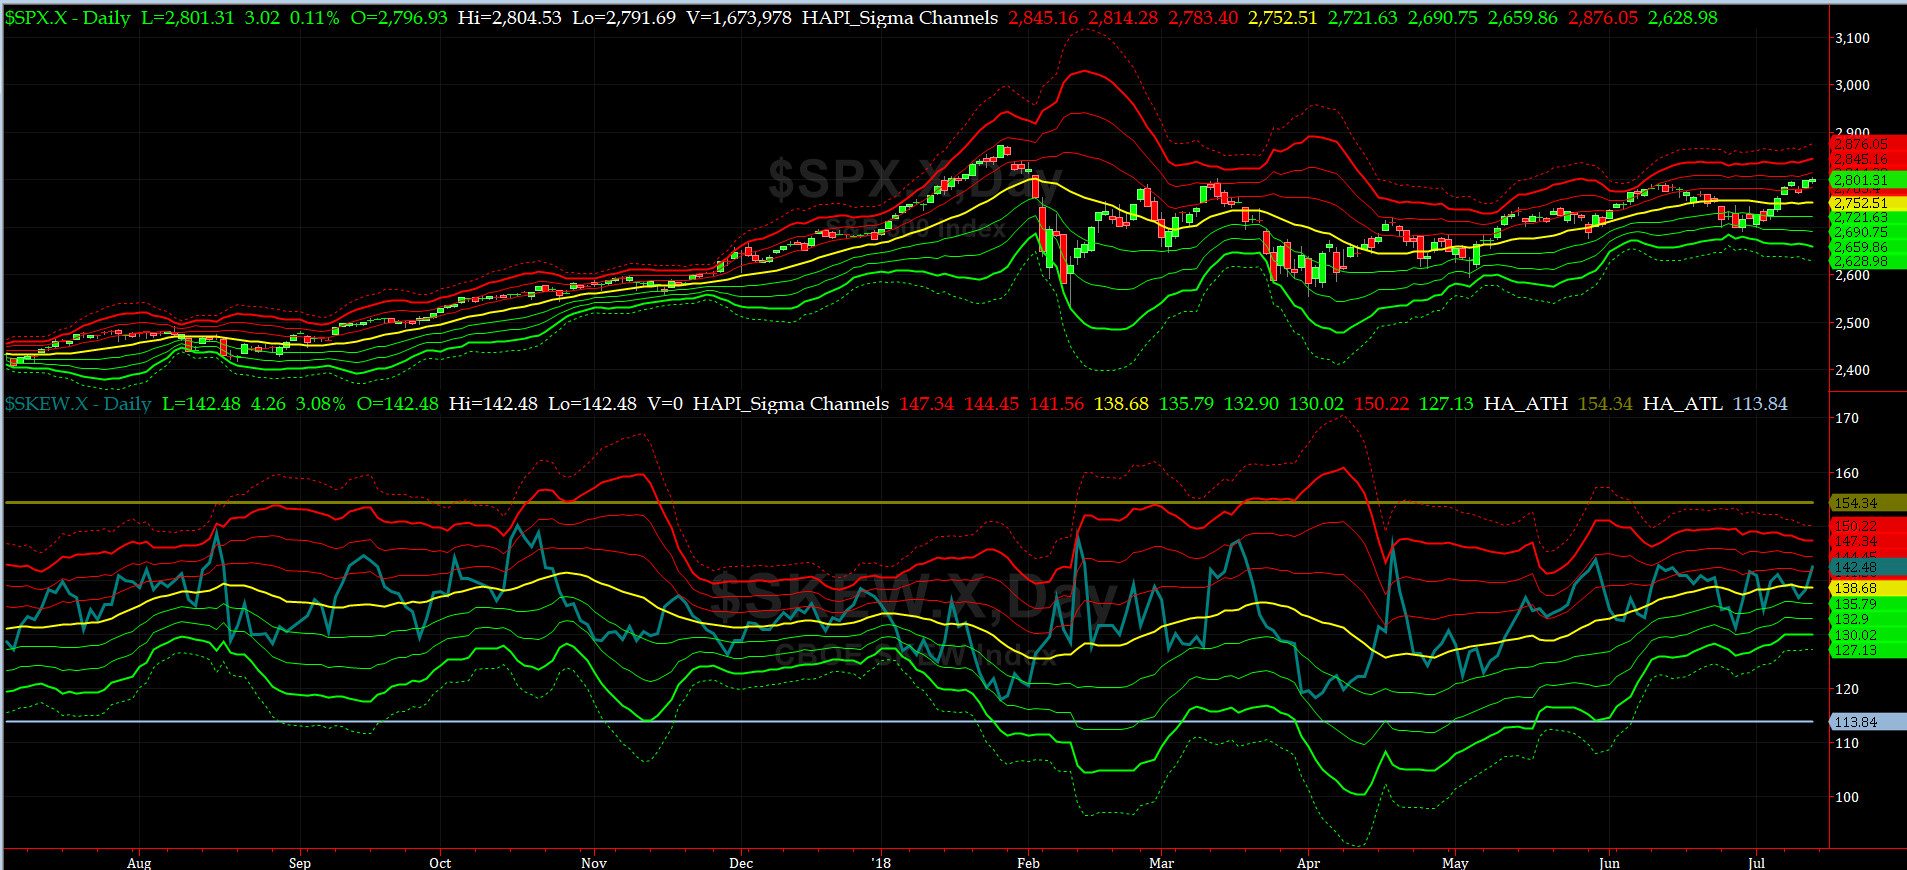
SPX SKEW (Tail Risk) Chart
On Friday, SPX SKEW (Tail Risk) closed near 142.5, right at its +1 sigma (normal = 120-125, range 100-150).
Is all quiet on the Eastern & Mid-Western Fronts? Our beloved Capt Tiko still thinks so.
How to interpret the value of SPX SKEW? (from CBOE white paper on SKEW)

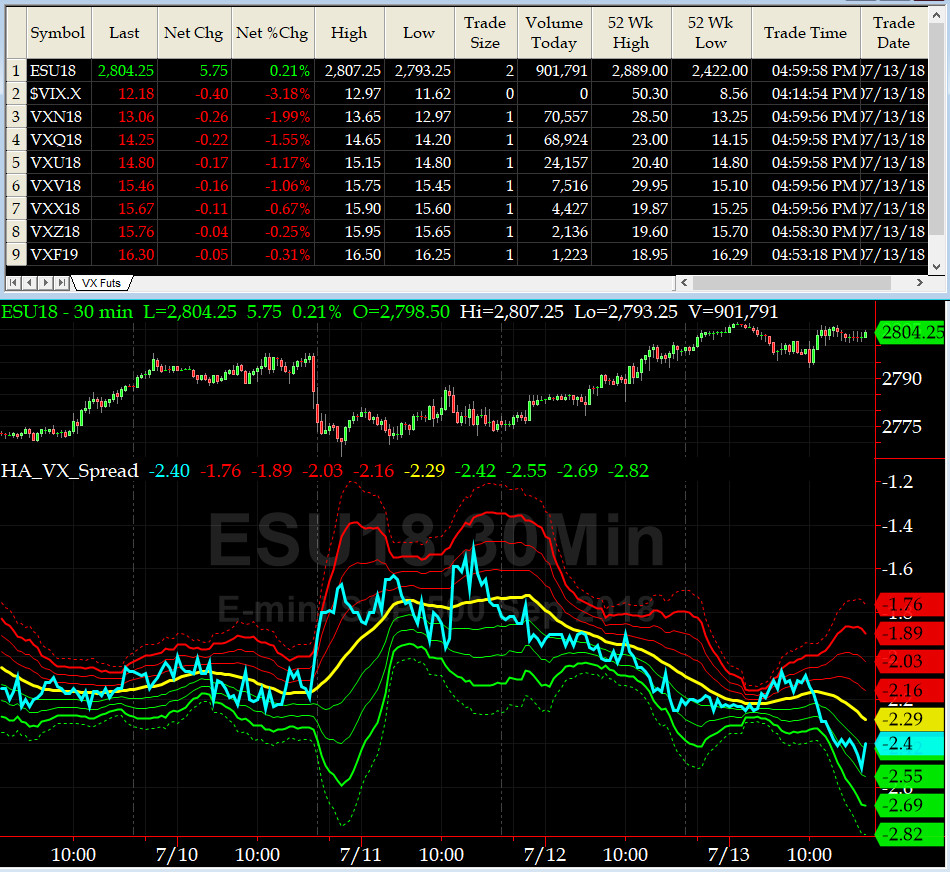
3-month VIX Futures Spread(VX) Chart
This popular timing indicator, (long July, & short Oct VIX Futures) is at -2.4. Right now, the signal here is NEUTRAL.
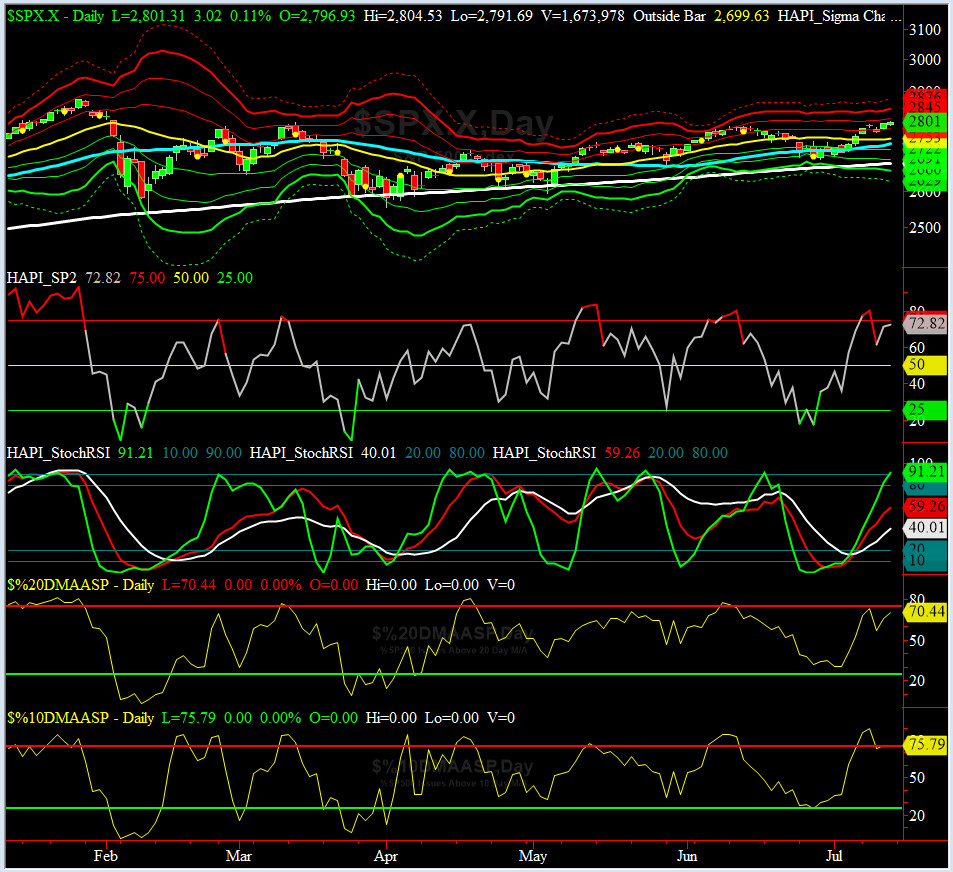
HA_SP2 Chart
HA_SP2 = 72.8 (Buy signal <= 25, Sell Signal >= 75)
Our coveted SP2 prop indicator was tired and slowed down a bit.
Worth noting here is all three-timeframe StockRSIs are rising, in tandem, after hitting the oversold zone last week.
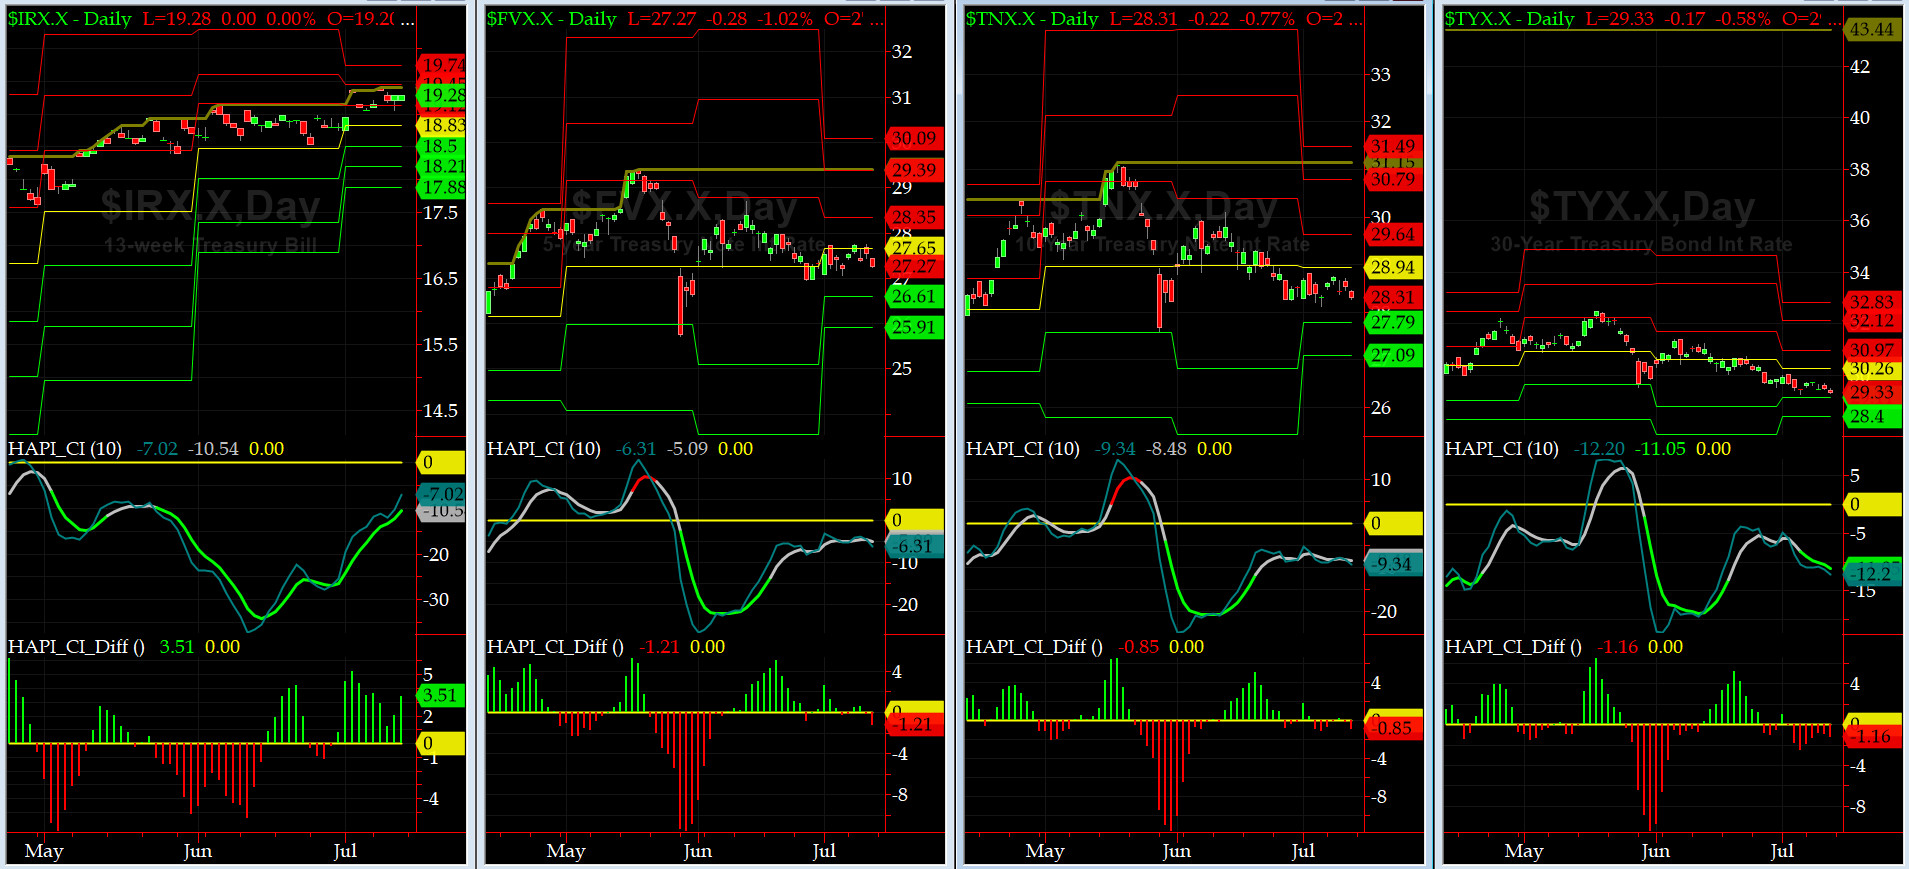
US Treasury T-Notes & T-Bonds Yields Chart
During this past week, the YTMs for the Notes & Bonds, again, went nowhere fast. Maury continues to worry about his future Implied Vig while CPI & PPI keep rising.
Fari Hamzei
|
|
|
|
|
|
Customer Care:
|
|
|
|
|
|
|
|
|
|


