|
Sunday, July 22nd, 2018, 1835ET
Market Timing Charts, Analysis & Commentary for Issue #250
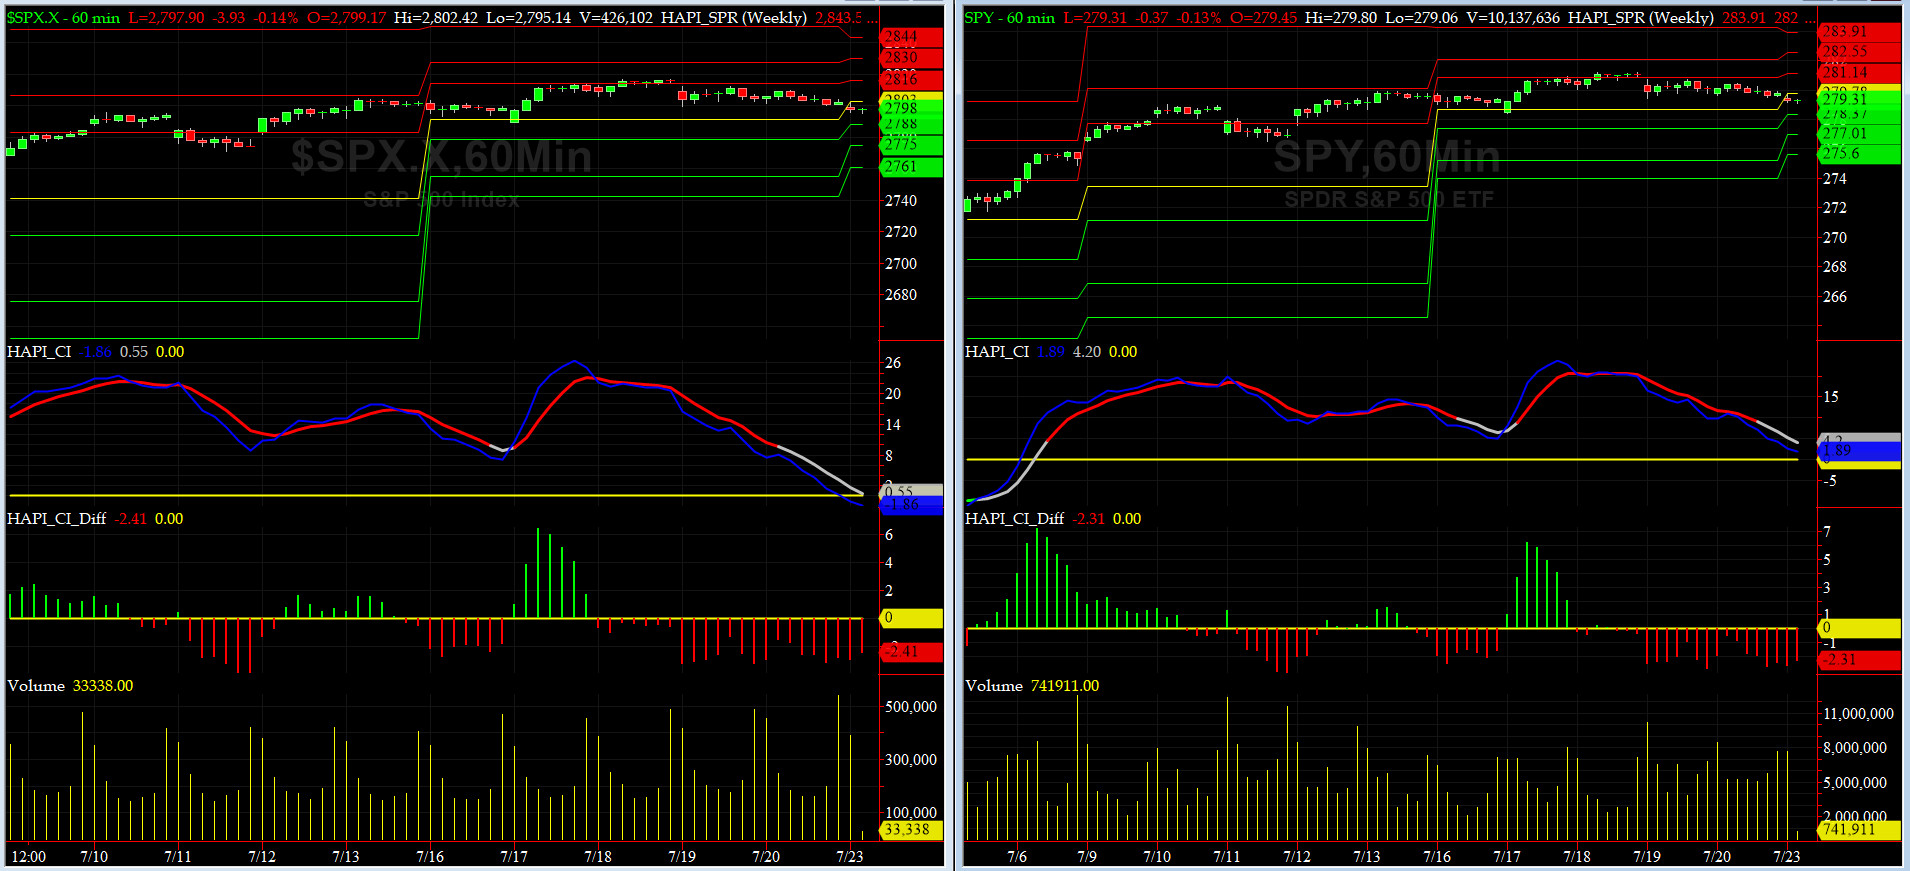
Timer Charts of S&P-500 Cash Index (SPX) + NASDAQ-100 Cash Index (NDX)
Most recent S&P-500 Cash Index (SPX): 2801 UNCHG for the week ending on Friday, July 20, 2018, which closed about its +1 sigma.
DJIA ALL TIME INTRADAY HIGH = 26617 (reached on Friday, January 26, 2018)
TRAN ALL TIME INTRADAY HIGH = 11424 (reached on Tuesday, January 16, 2018)
SPX ALL TIME INTRADAY HIGH = 2873 (reached on Friday, January 26, 2018)
NDX ALL TIME INTRADAY HIGH = 7418 (reached on Tuesday, July 17, 2018)
RUT ALL TIME INTRADAY HIGH = 1708 (reached on Tuesday, July 10, 2018)
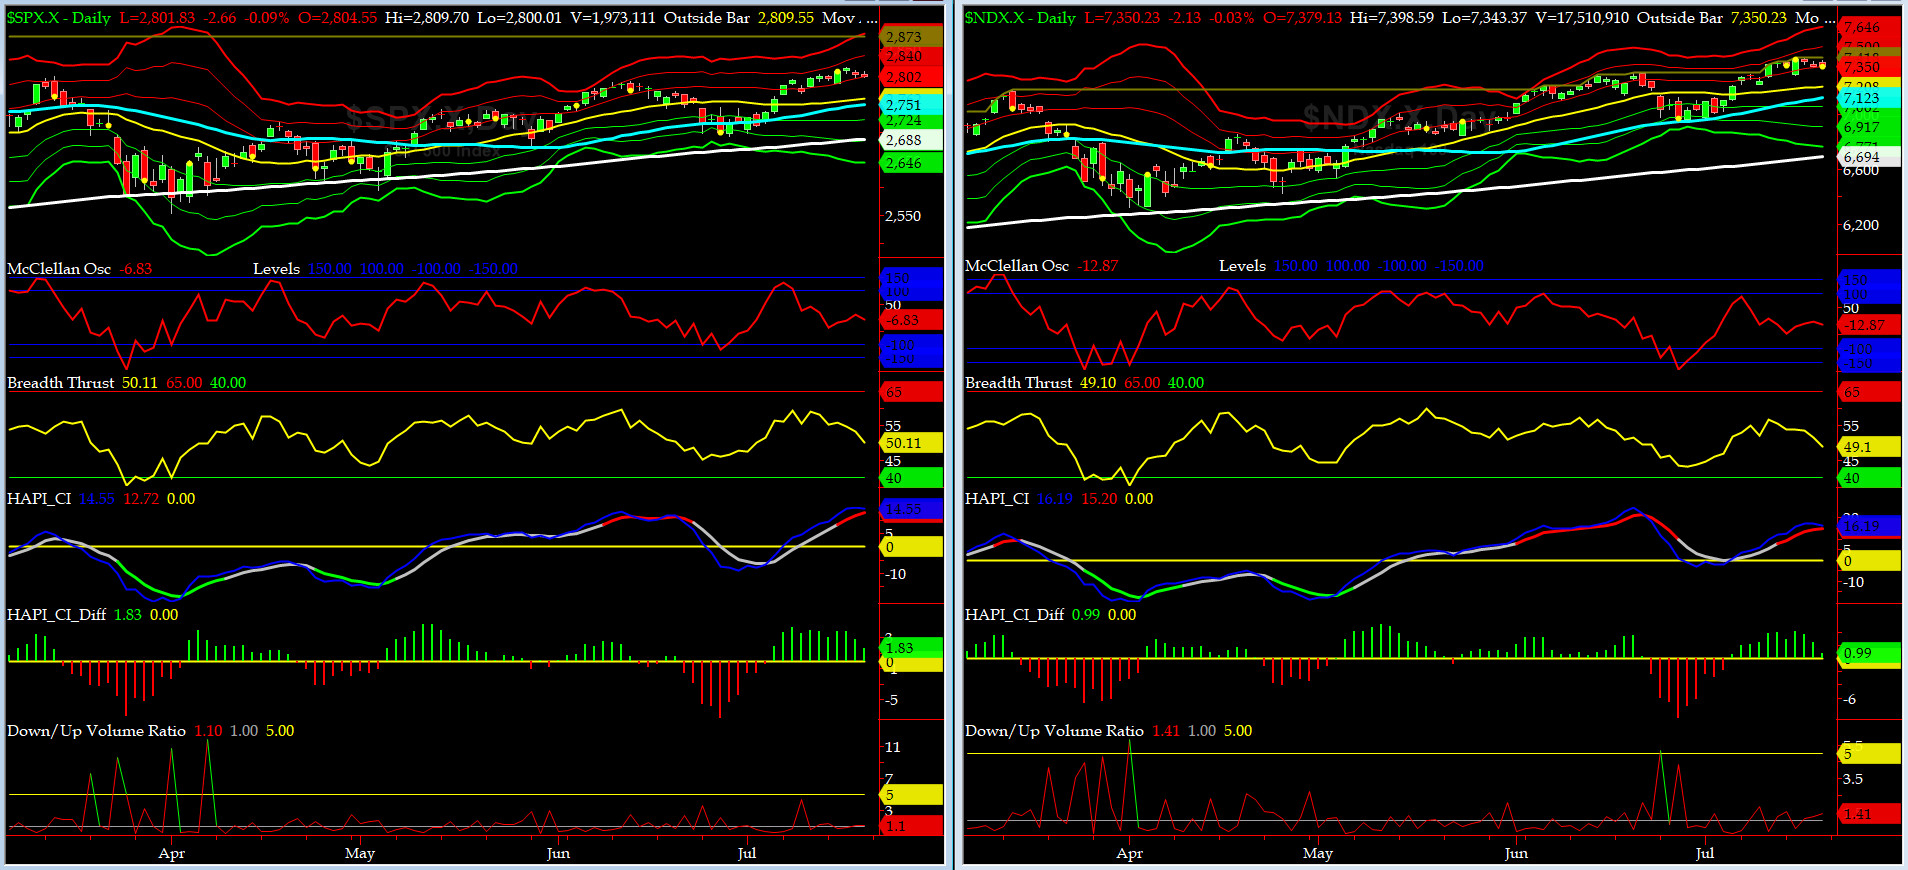
Current DAILY +2 Sigma SPX = 2840 with WEEKLY +2 Sigma = 2841
Current DAILY 0 Sigma (20 day MA) SPX = 2762 with WEEKLY 0 Sigma = 2716
Current DAILY -2 Sigma SPX = 2685 with WEEKLY -2 Sigma = 2591
NYSE McClellan Oscillator = -7 (-150 is start of the O/S area; around -275 to -300 area or lower, we go into the �launch-pad� mode, over +150, we are in O/B area)
NYSE Breadth Thrust = 50.1 (40 is considered as oversold and 65 as overbought)
We went nowhere fast but did observe a decent amount of intraday volatility in at least 2 days this week. IOHO, This is not good.
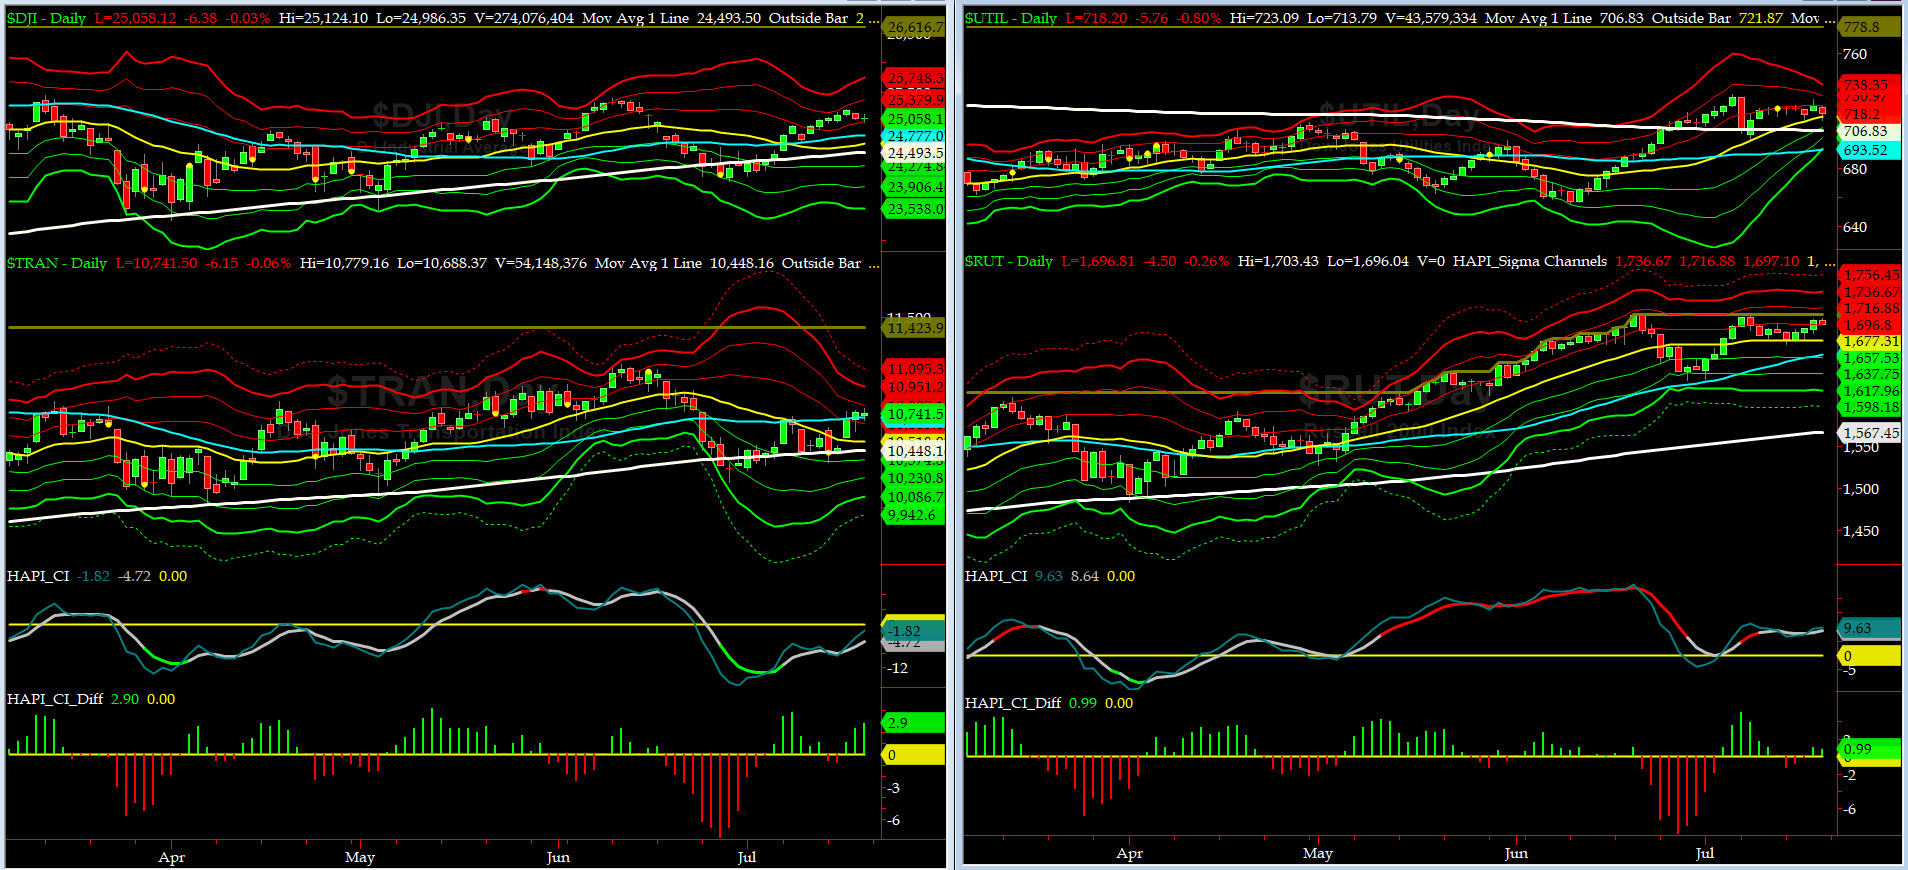
Canaries [in the Coal Mine] Chart for DJ TRAN & RUT Indices
200-Day MA DJ TRAN = 10,448 or 2.8% below DJ TRAN (max observed in last 7 yrs = 20.2%, min = -20.3%)
200-Day MA RUT = 1567 or 8.3% below RUT (max observed in last 7 yrs = 21.3%, min = -22.6%)
DJ Transportation Index (proxy for economic conditions 6 to 9 months hence) attempted to break out the tight wedge we discussed last week and closed above its 50-day MA. Again, we need to keep watching this index. Always a good [big] tell for future market direction.
Russell 2000 Small Caps Index (proxy for Risk ON/OFF) had another good week and rallied up most recent ATH. RISK remains ON.

DeTrenders Charts for SPX, NDX, TRAN & RUT Indices
50-Day MA SPX = 2751 or 1.8% below SPX (max observed in last 7 yrs = +8.6%, min = -9.3%)
200-Day MA SPX = 2688 or 4.2% below SPX (max observed in last 7 yrs = 15.2%, min = -14%)
ALL of our EIGHT DeTrenders are in POSITIVE territory. The DeTrenders for DJ Tran & RUT will continue to be harbingers of future price behavior in broad indices.
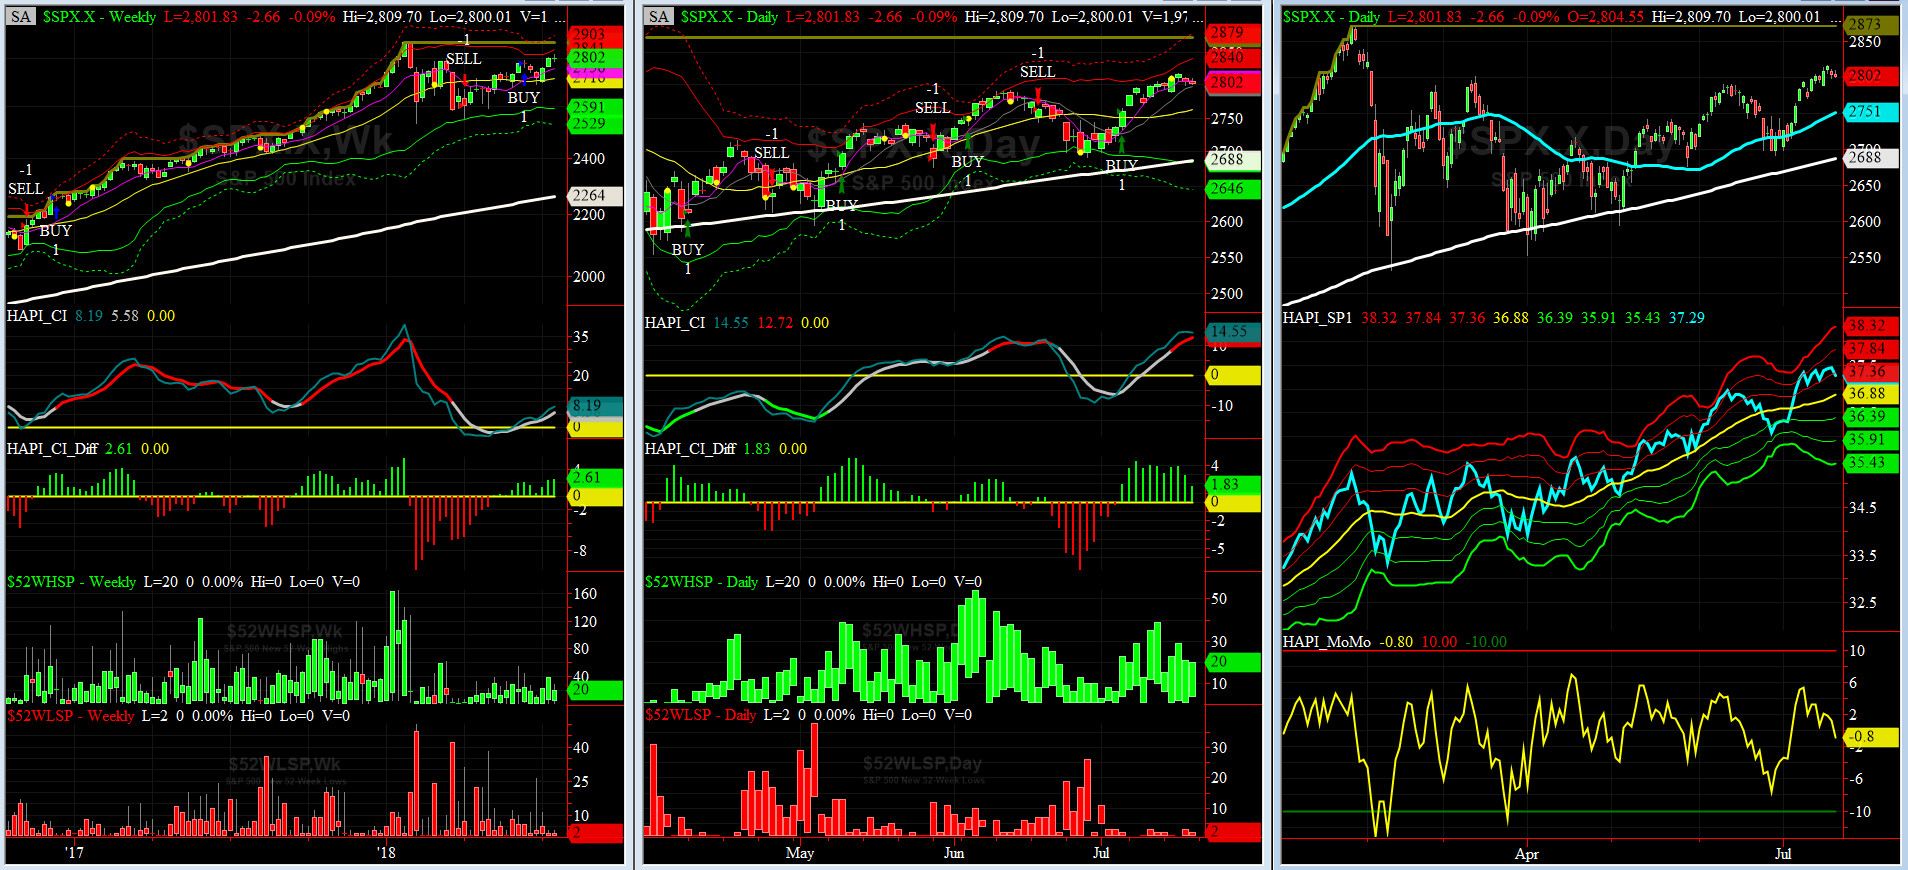
HA_SP1_Momo Chart
WEEKLY Timing Model = on a BUY Signal since Friday, June 15, 2018 CLOSE at 2779
DAILY Timing Model = on a BUY Signal since Friday, July 6, 2018 CLOSE at 2760
Max SPX 52wk-highs reading last week = 29 (over 120-140, the local maxima is in)
Max SPX 52wk-Lows reading last week = 3 (over 40-60, the local minima is in)
HA_SP1 closed above its +1 sigma channels
HA_Momo = -0.8 (reversals most likely occur above +10 or below -10)
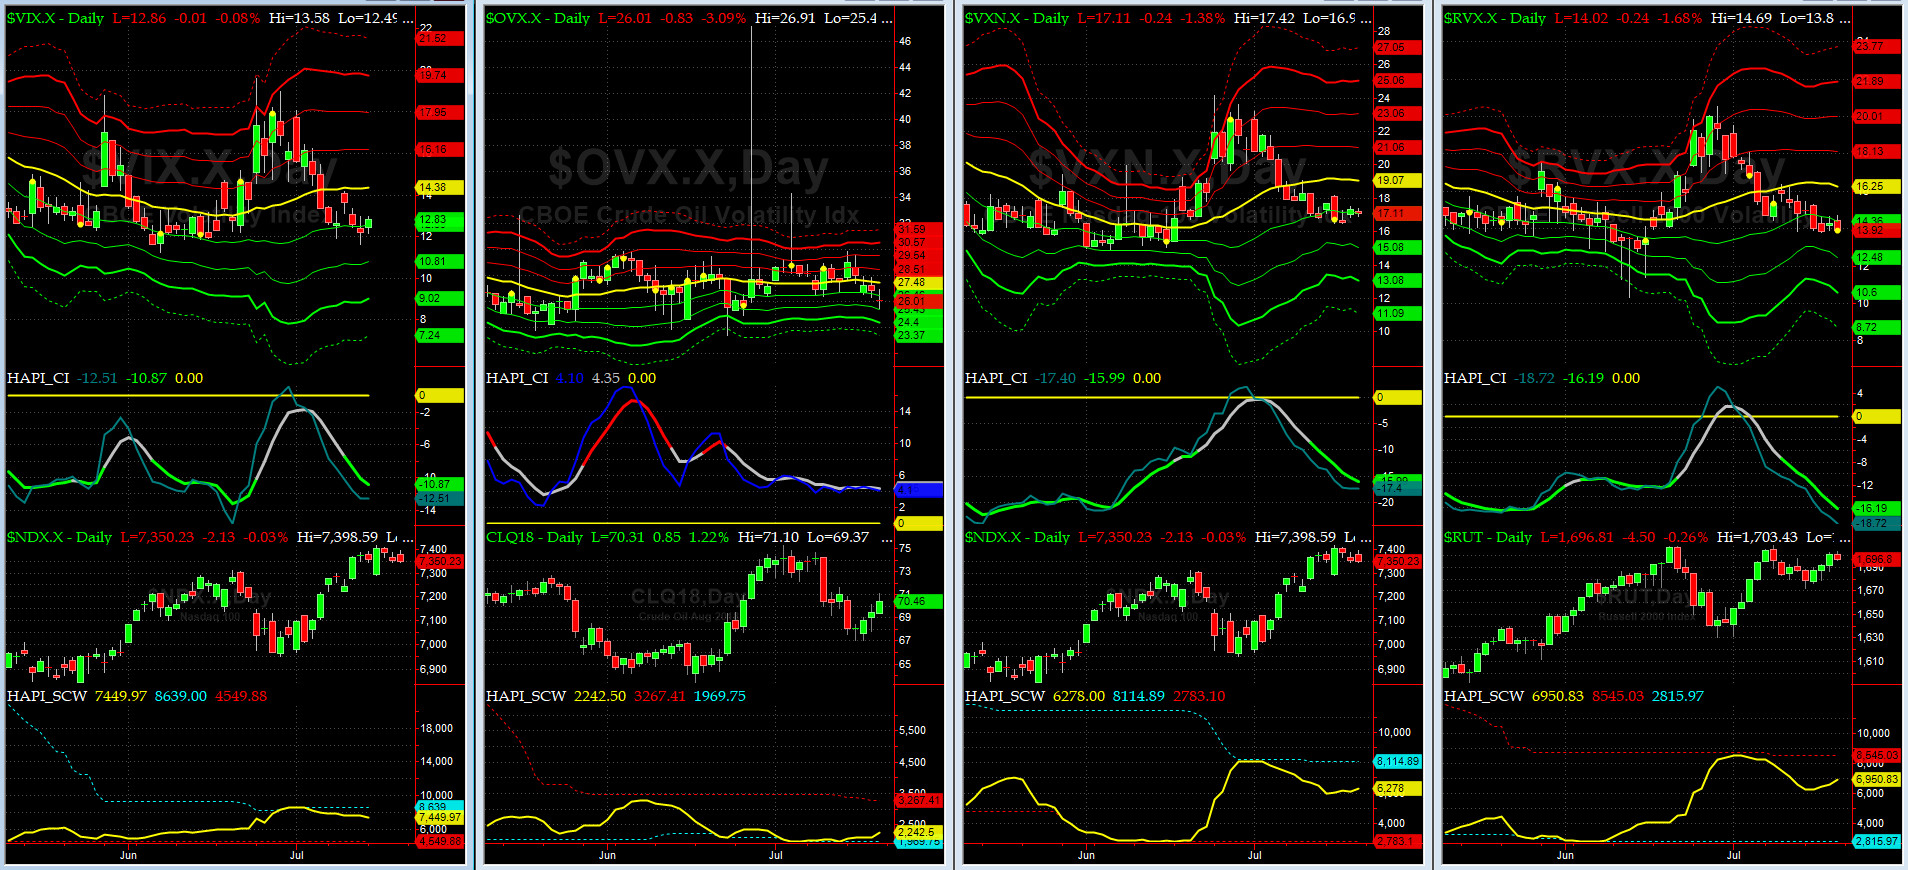
Vol of the Vols Chart
Spot VIX currently stands at 12.86, just a tad above its -1 sigma (remember it's the VIX volatility pattern aka "its sigma channels" that matters, and not the level of VIX itself (this is per Dr. Robert Whaley, a great mentor and inventor of original VIX, now called VXO). VIX usually peaks around a test of its +4 sigma).
VIX has started to flatten out (its CI crossed up). Should it trade above 14 (its current zero sigma), IHOO, it will serve as a decent warning for another sharp drop.
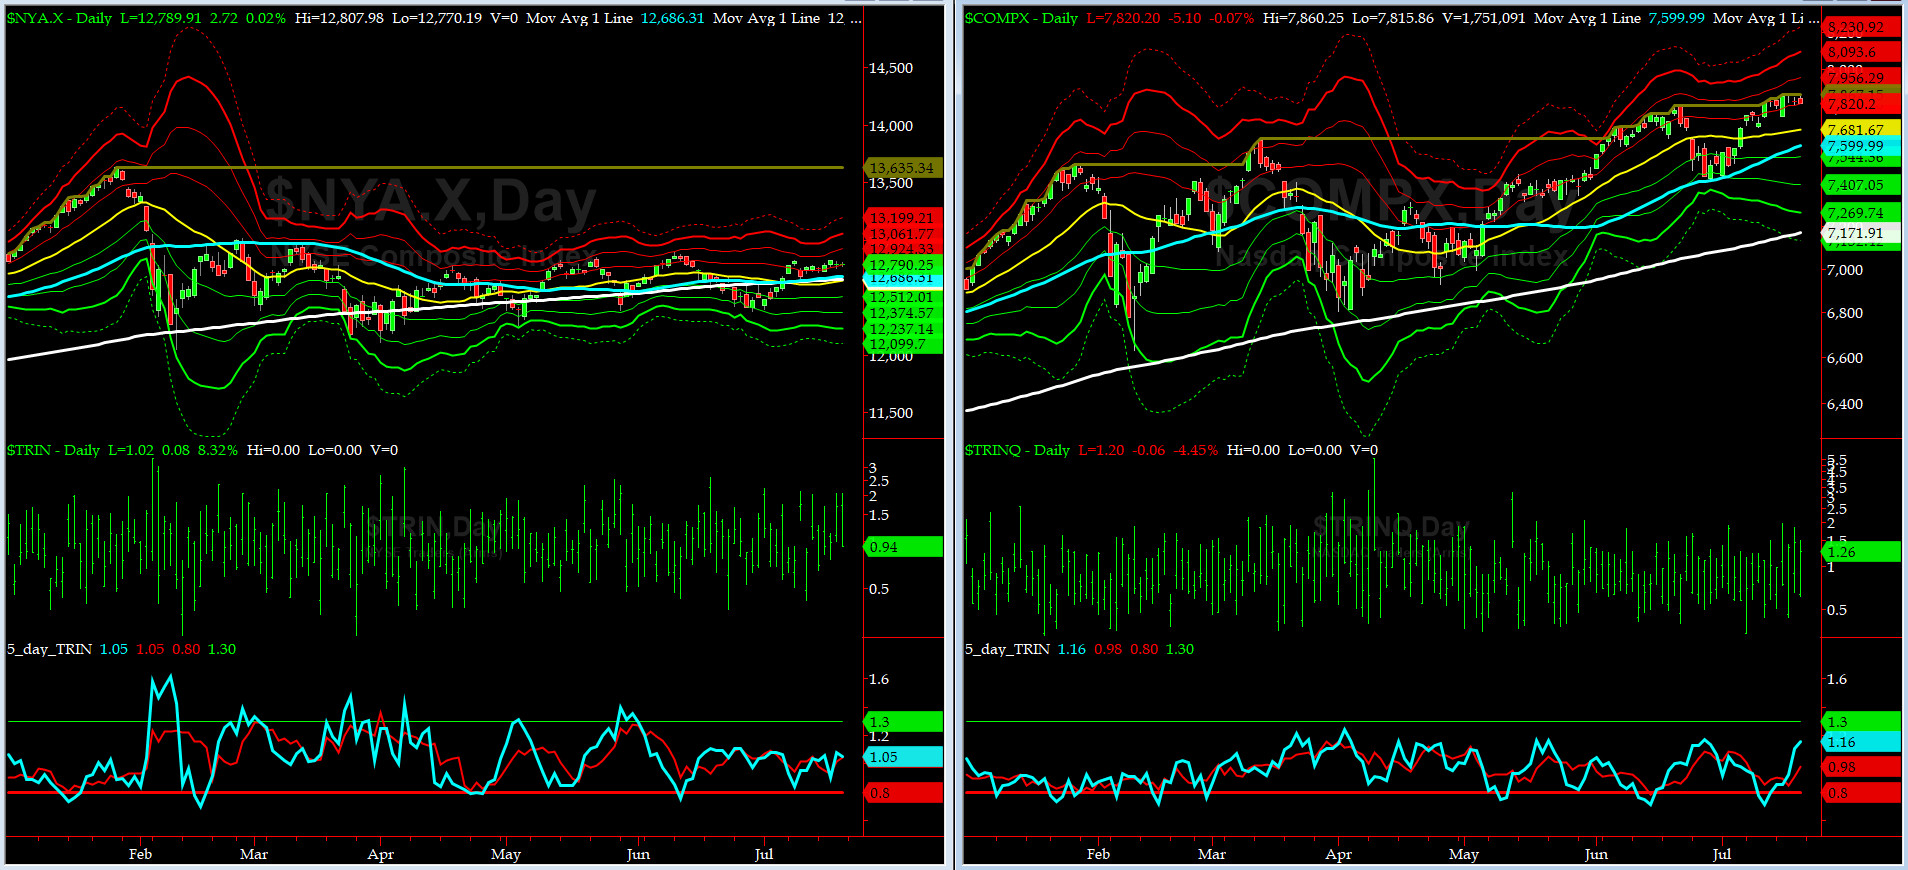
5-day TRIN & TRINQ Charts
Both NYSE & NASDAQ 5-day TRINs are in NEUTRAL zone.

Components of SPX above their respective 200day MA Chart
This scoring indicator, for now, continues to struggle in the mid to low 60 levels. Next targets remain the same: should we take off here, the next level to be tested by this indicator is 66% and then break out to 72% area and then the low 80%s.
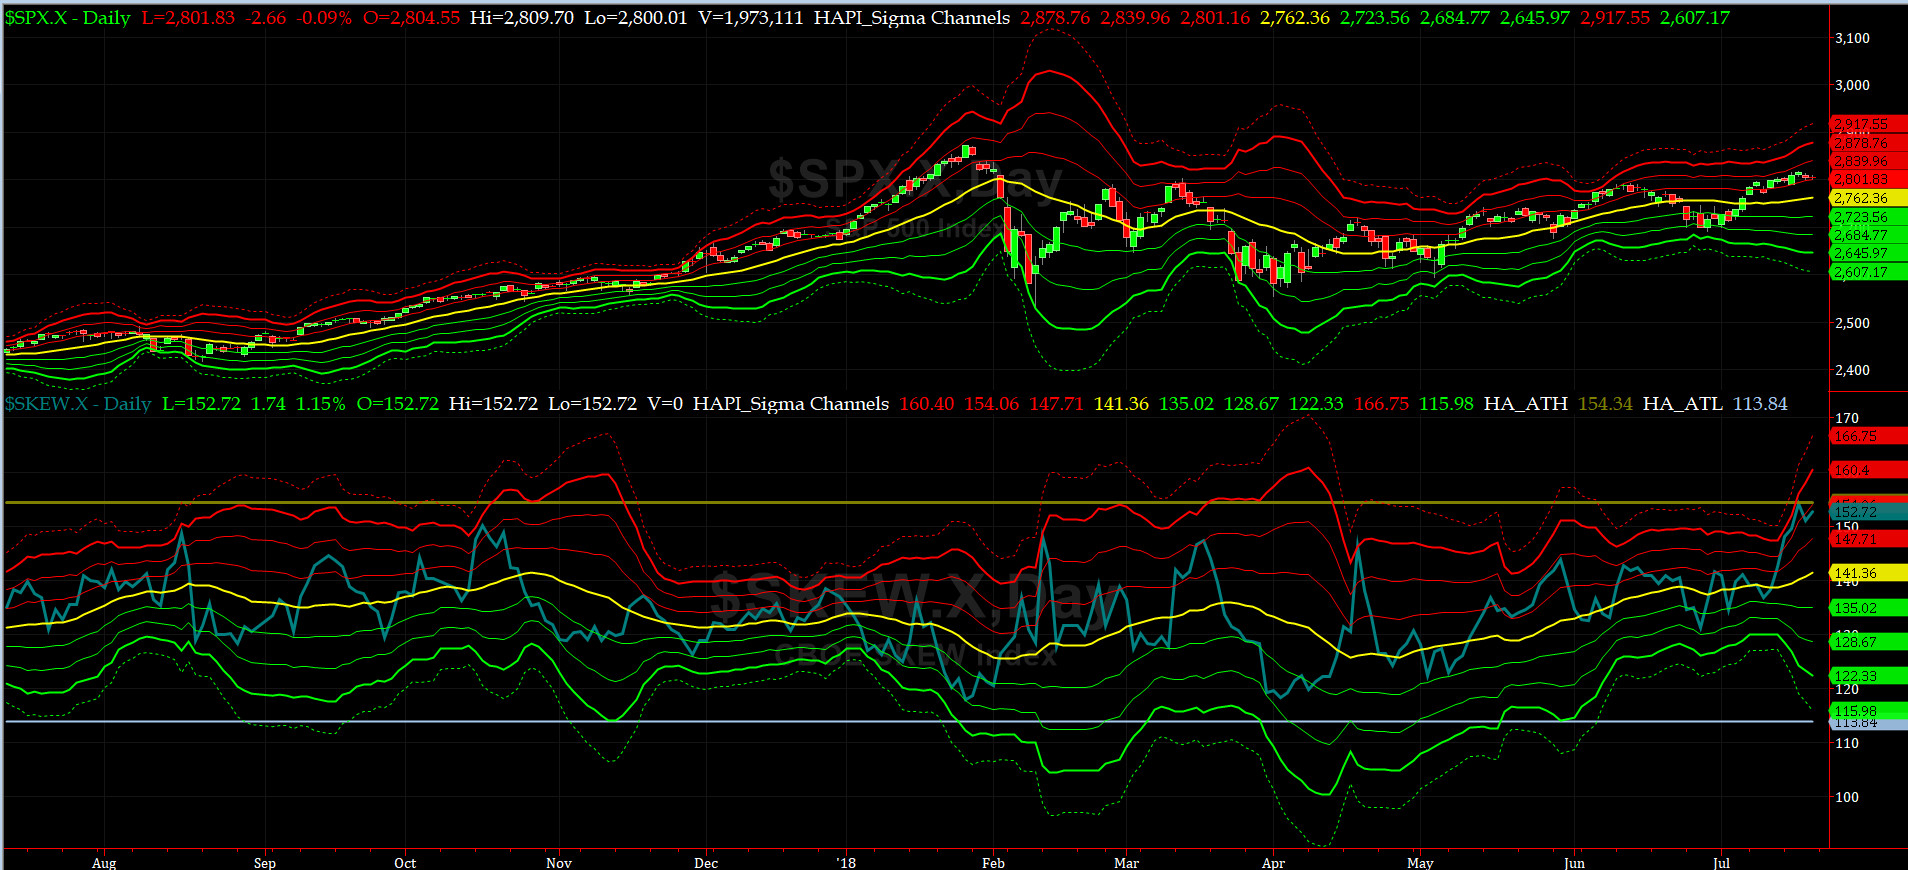
SPX SKEW (Tail Risk) Chart
On Friday, SPX SKEW (Tail Risk) closed near 152.7, right about its +2 sigma (normal = 120-125, range 100-150).
Is all quiet on the Eastern & Mid-Western Fronts? Our beloved Capt Tiko barks NO as he reminds us that on Wednesday, due to smart money not buying Grumpino's excuses for his July 16 speaking fiasco at Helsinki, Finland, SPX SKEW went up to within 9 cents of its ATH.
How to interpret the value of SPX SKEW? (from CBOE white paper on SKEW)


3-month VIX Futures Spread(VX) Chart
This popular timing indicator, (long AUG, & short NOV VIX Futures) is at -1.75. This is a very NEUTRAL reading.
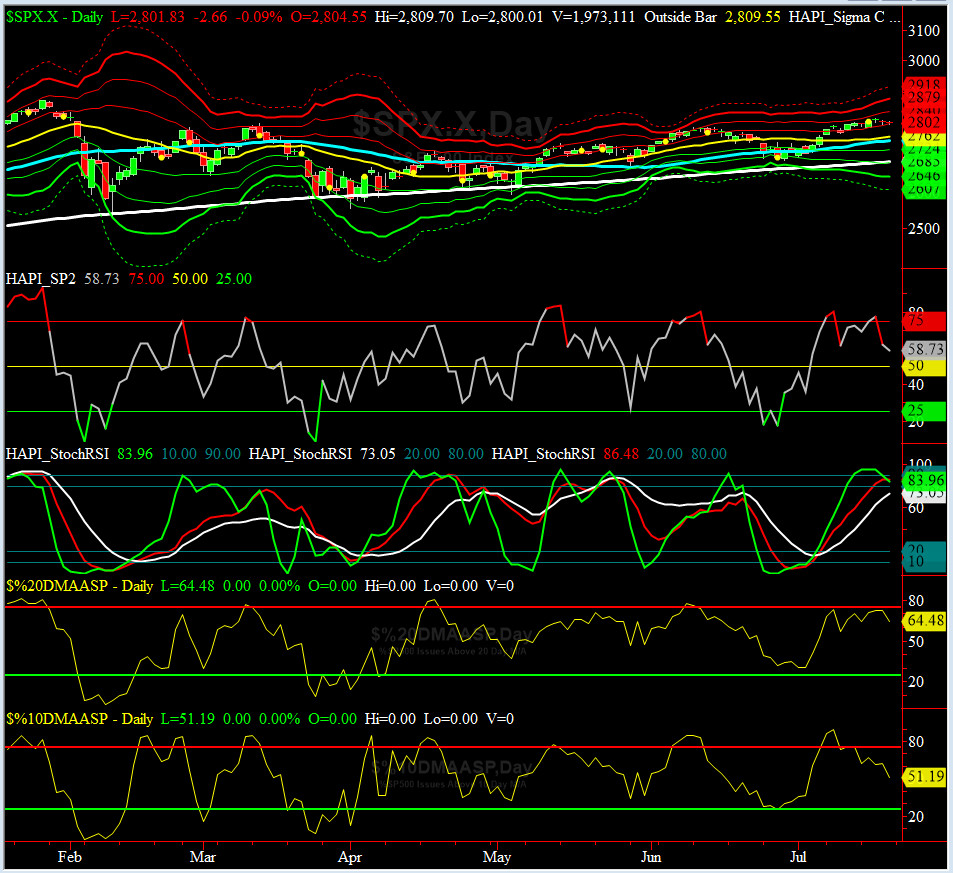
HA_SP2 Chart
HA_SP2 = 58.7 (Buy signal <= 25, Sell Signal >= 75)
Our coveted SP2 prop indicator rose up on Tuesday and then dropped off by Friday to near NEUTRAL area.
Worth noting here is all three-timeframe StockRSIs are approaching a 'potential' short-term top formation.
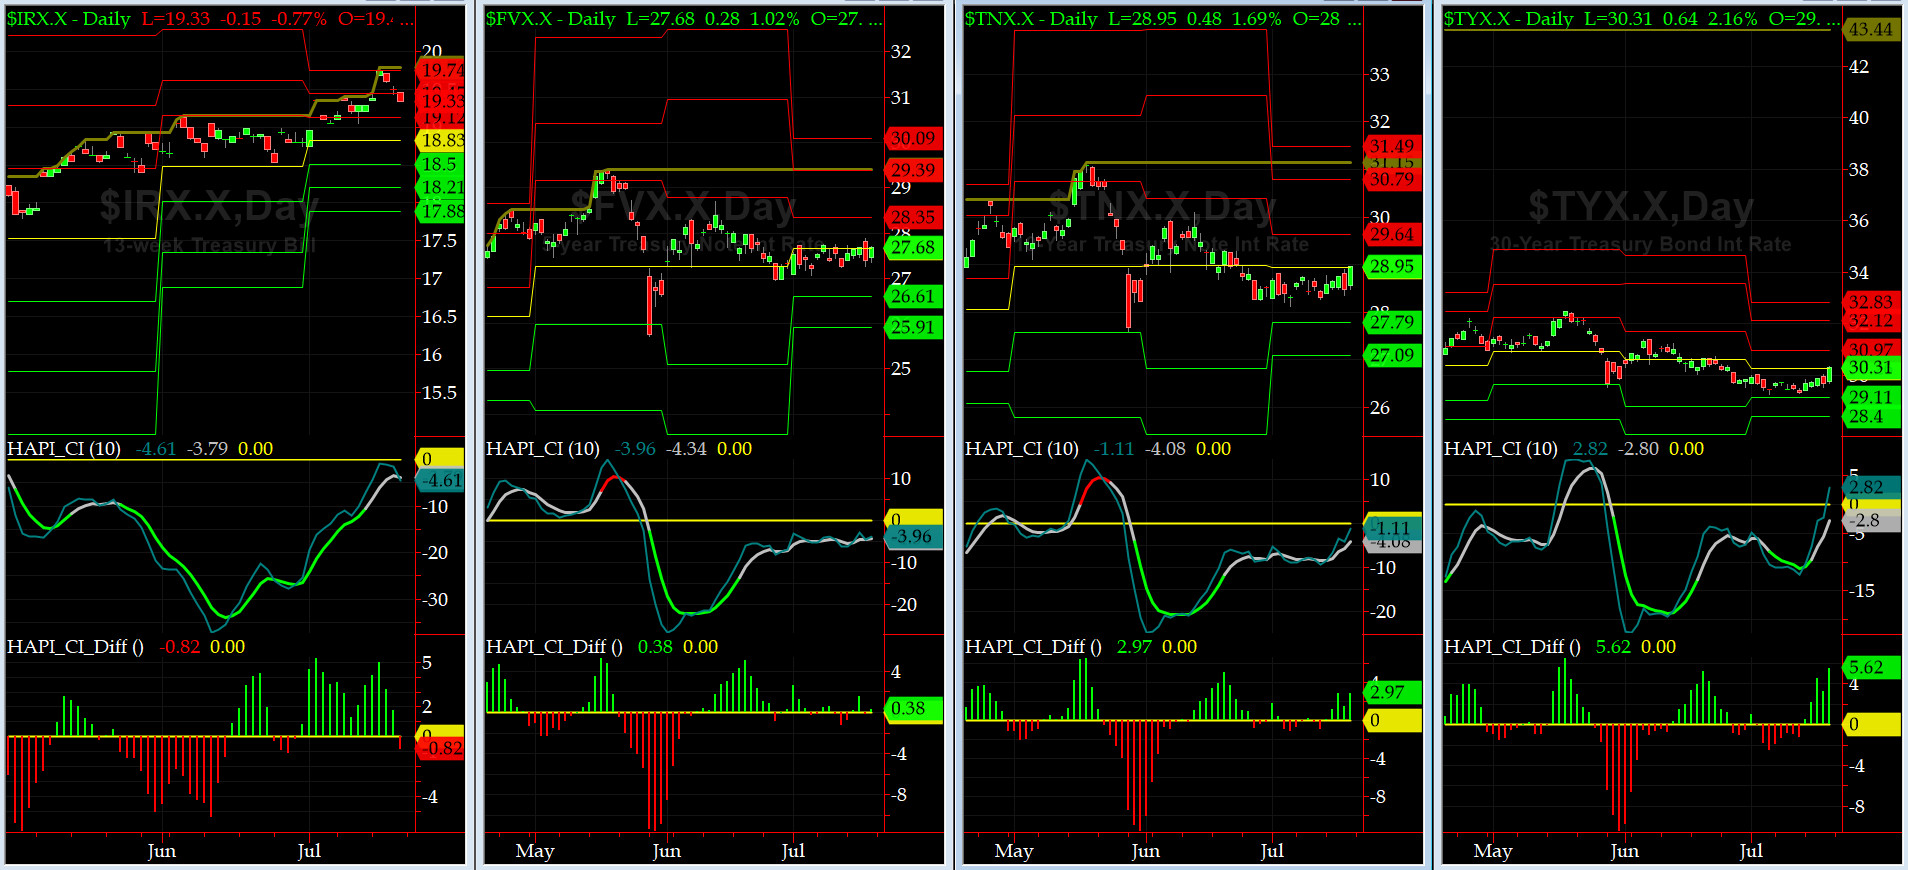
US Treasury T-Notes & T-Bonds Yields Chart
During this past week, the YTMs for the Notes & Bonds, were very quiet till Friday, when the short-end dropped and its long-end rose. Maury continues to worry about his future Implied Vig.
Fari Hamzei
|


 Proactive Market Timing