|
Monday, August 6th, 2018, 0750ET
Market Timing Charts, Analysis & Commentary for Issue #252
Timer Charts of S&P-500 Cash Index (SPX) + NASDAQ-100 Cash Index (NDX)
Most recent S&P-500 Cash Index (SPX): 2840 up +22 (up +0.78%) for the week ending on Friday, August 3, 2018, which closed above its +1.5 sigma.
DJIA ALL TIME INTRADAY HIGH = 26617 (reached on Friday, January 26, 2018)
TRAN ALL TIME INTRADAY HIGH = 11424 (reached on Tuesday, January 16, 2018)
SPX ALL TIME INTRADAY HIGH = 2873 (reached on Friday, January 26, 2018)
NDX ALL TIME INTRADAY HIGH = 7511 (reached on Wednesday, July 25, 2018)
RUT ALL TIME INTRADAY HIGH = 1708 (reached on Tuesday, July 10, 2018)
Current DAILY +2 Sigma SPX = 2846 with WEEKLY +2 Sigma = 2861
Current DAILY 0 Sigma SPX = 2811 with WEEKLY 0 Sigma = 2722
Current DAILY -2 Sigma SPX = 2775 with WEEKLY -2 Sigma = 2583
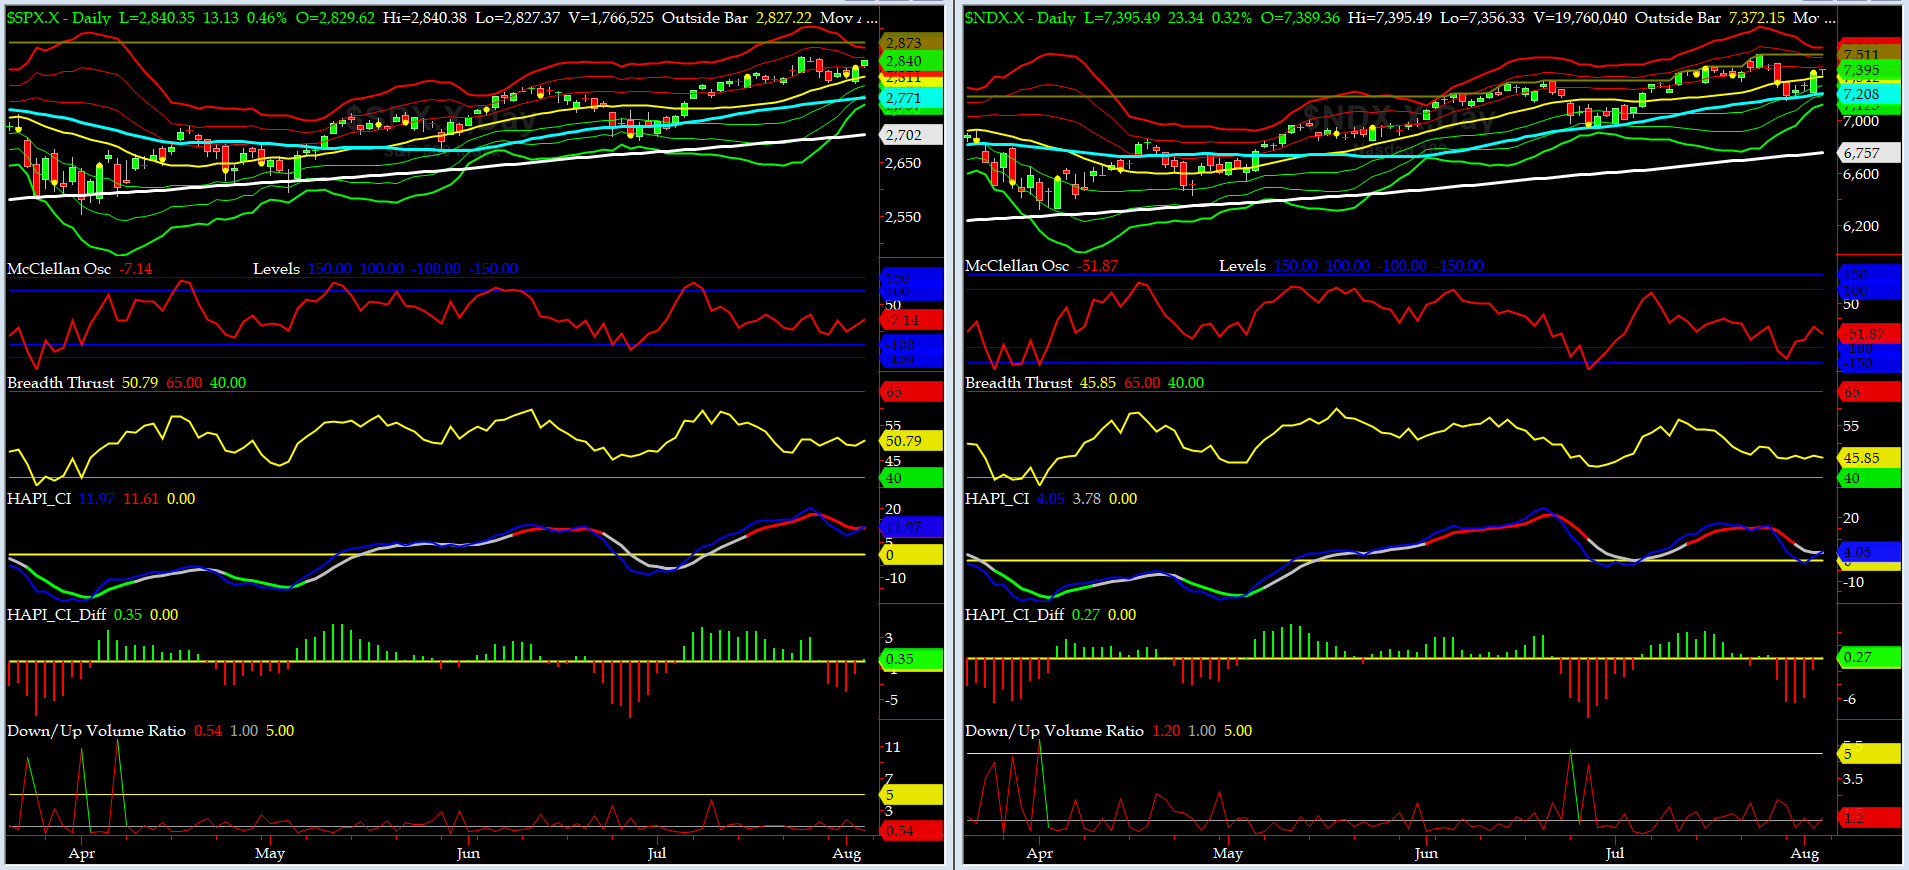
NYSE McClellan Oscillator = -7 (-150 is start of the O/S area; around -275 to -300 area or lower, we go into the �launch-pad� mode, over +150, we are in O/B area)
NYSE Breadth Thrust = 50.8 (40 is considered as oversold and 65 as overbought)
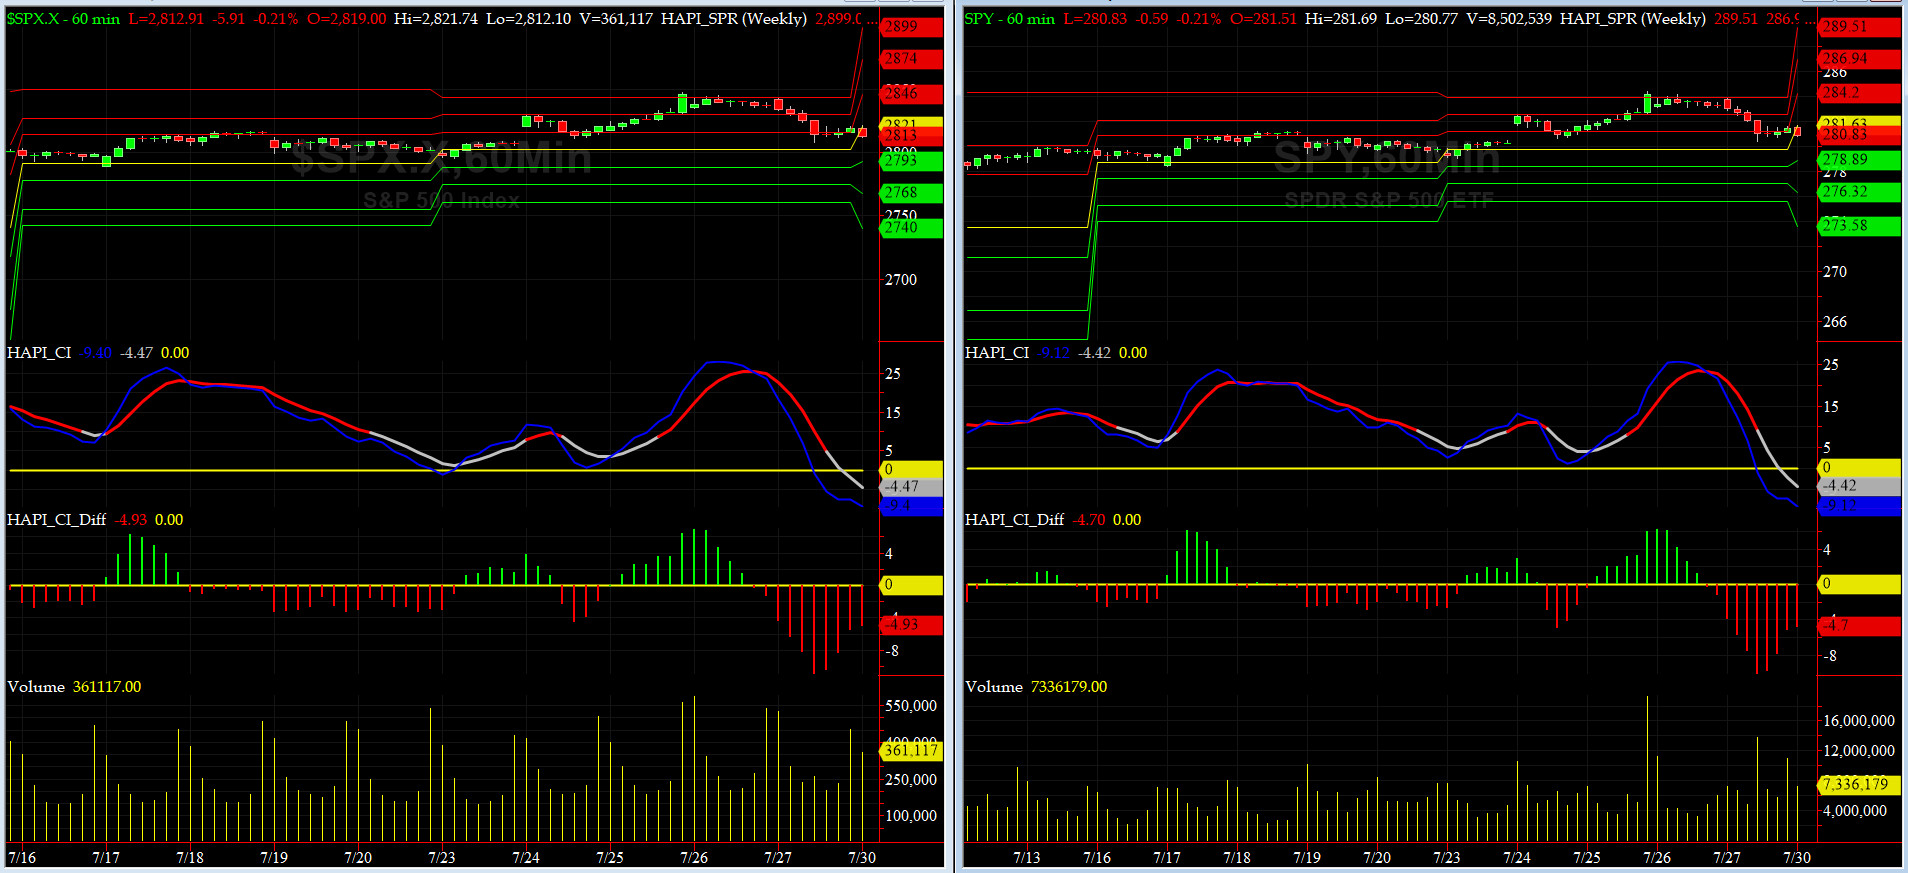
Another week of reasonable good intraday vol, specially on Thursday. We now expect a break to new ATHs.
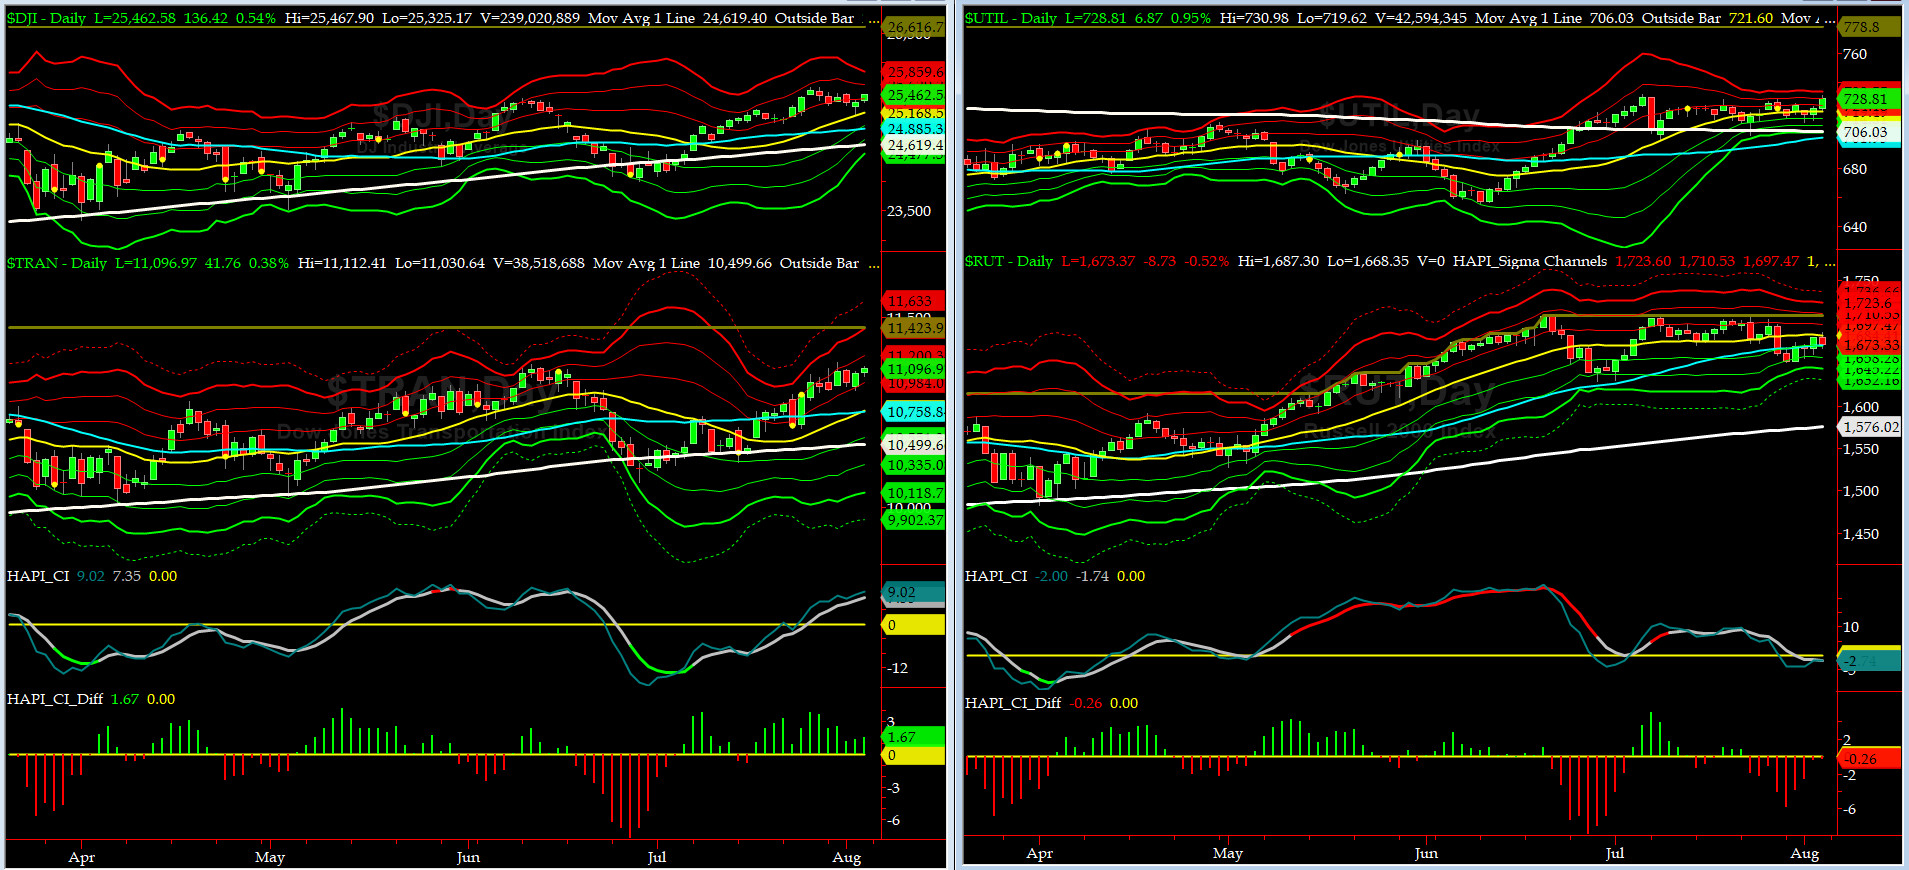
Canaries [in the Coal Mine] Chart for DJ TRAN & RUT Indices
200-Day MA DJ TRAN = 10,499 or 5.7% below DJ TRAN (max observed in last 7 yrs = 20.2%, min = -20.3%)
200-Day MA RUT = 1576 or 6.2% below RUT (max observed in last 7 yrs = 21.3%, min = -22.6%)
DJ Transportation Index (proxy for economic conditions 6 to 9 months hence) finally putting in a channel break out. Need to see a CLOSE above 11,130.
Russell 2000 Small Caps Index (proxy for Risk ON/OFF) had a mixed week and ended at its 50-day MA. RISK ON still is at crossroads here.

DeTrenders Charts for SPX, NDX, TRAN & RUT Indices
50-Day MA SPX = 2771 or 2.5% below SPX (max observed in last 7 yrs = +8.6%, min = -9.3%)
200-Day MA SPX = 2701 or 5.1% below SPX (max observed in last 7 yrs = 15.2%, min = -14%)
SEVEN of our EIGHT DeTrenders are in POSITIVE territory. The DeTrenders for DJ Tran & RUT will continue to be harbingers of future price behavior in broad indices.
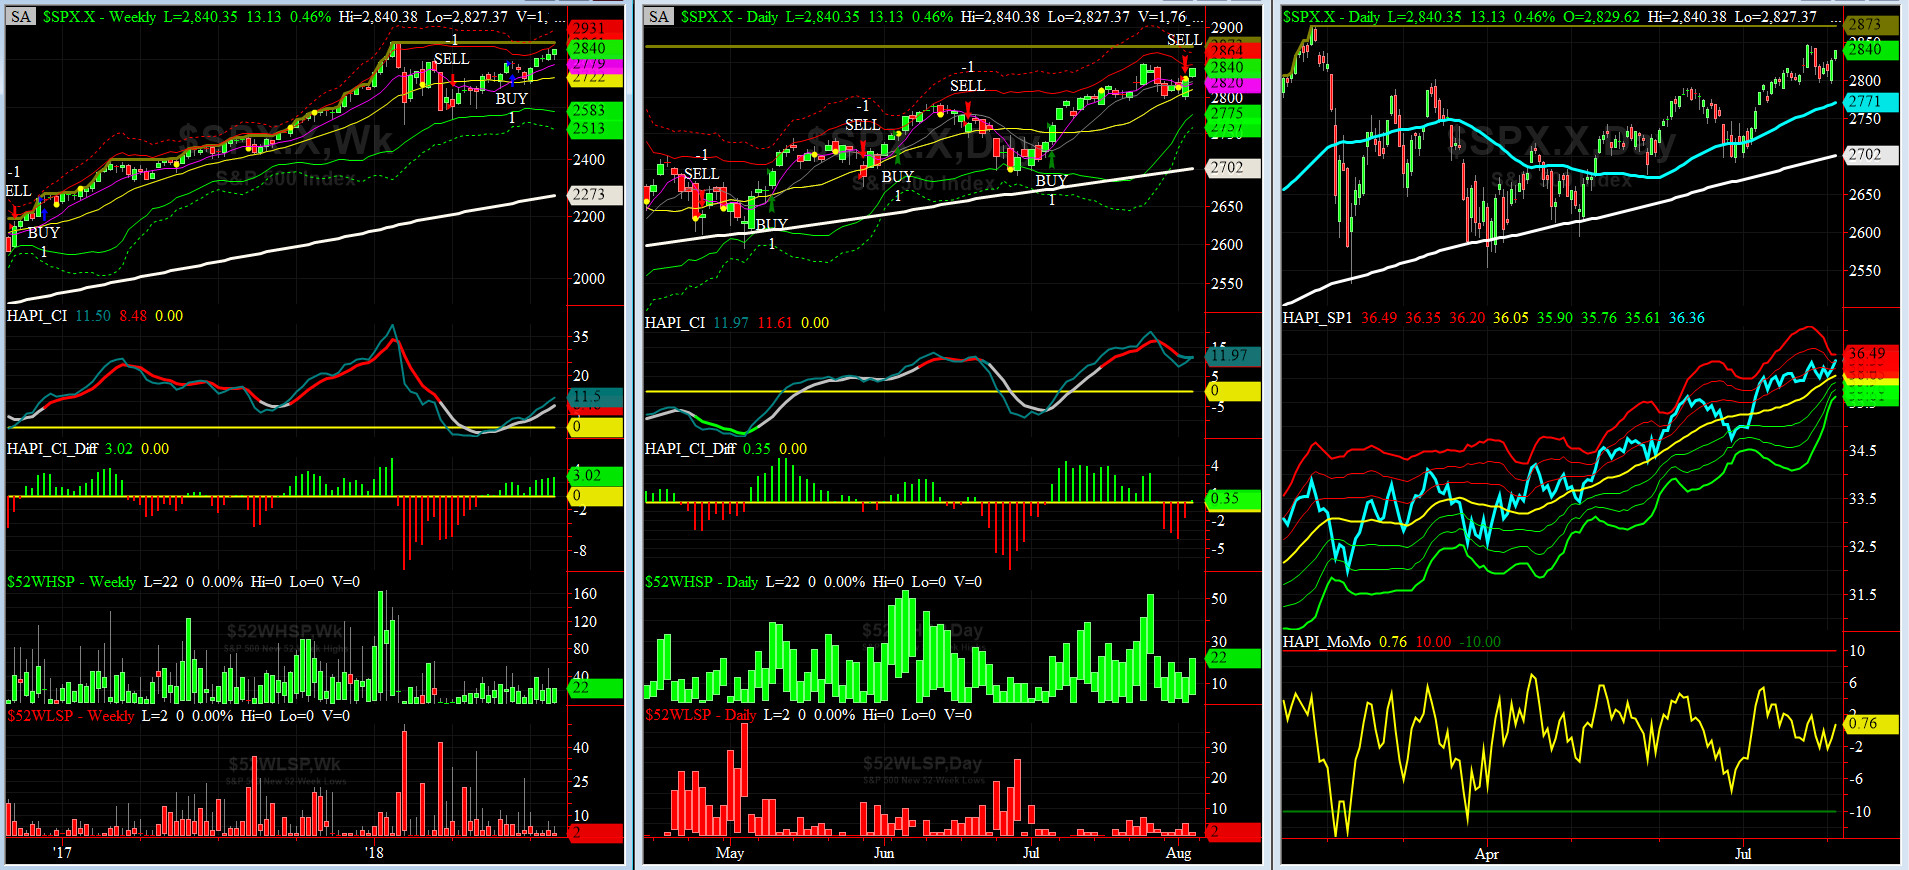
HA_SP1_Momo Chart
WEEKLY Timing Model = on a BUY Signal since Friday, June 15, 2018 CLOSE at 2779
DAILY Timing Model = on a SELL Signal since Wednesday, August 2, 2018 CLOSE at 2827
Max SPX 52wk-highs reading last week = 22 (over 120-140, the local maxima is in)
Max SPX 52wk-Lows reading last week = 5 (over 40-60, the local minima is in)
HA_SP1 closed above its +2 sigma channels
HA_Momo = +0.76 (reversals most likely occur above +10 or below -10)

Vol of the Vols Chart
Spot VIX currently stands at 11.64, right about its -1 sigma (remember it's the VIX volatility pattern aka "its sigma channels" that matters, and not the level of VIX itself (this is per Dr. Robert Whaley, a great mentor and inventor of original VIX, now called VXO). VIX usually peaks around a test of its +4 sigma).
VIX continues to meander. Should it trade above 15 (its current zero sigma), IOHO, it will serve as a decent warning for another sharp drop.
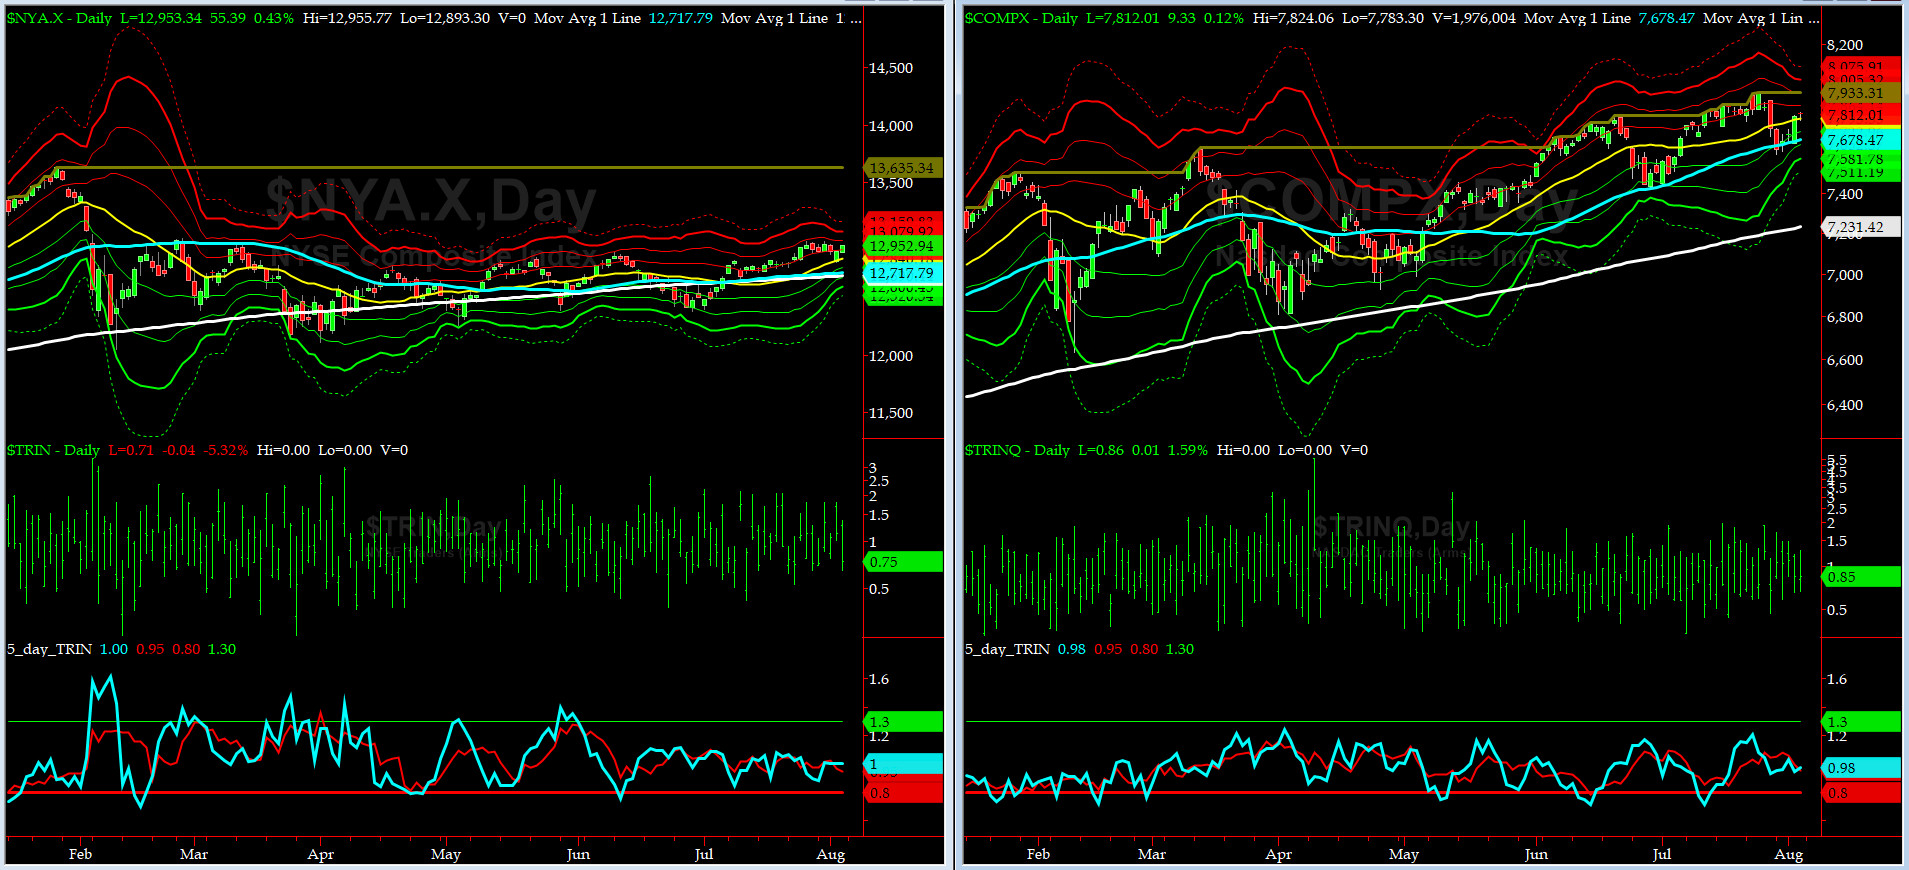
5-day TRIN & TRINQ Charts
Both NYSE & NASDAQ 5-day TRINs are in NEUTRAL zone.

Components of SPX above their respective 200day MA Chart
This scoring indicator finally rose to 69%. Next targets are: a break out to 72% area and then the low 80%s.
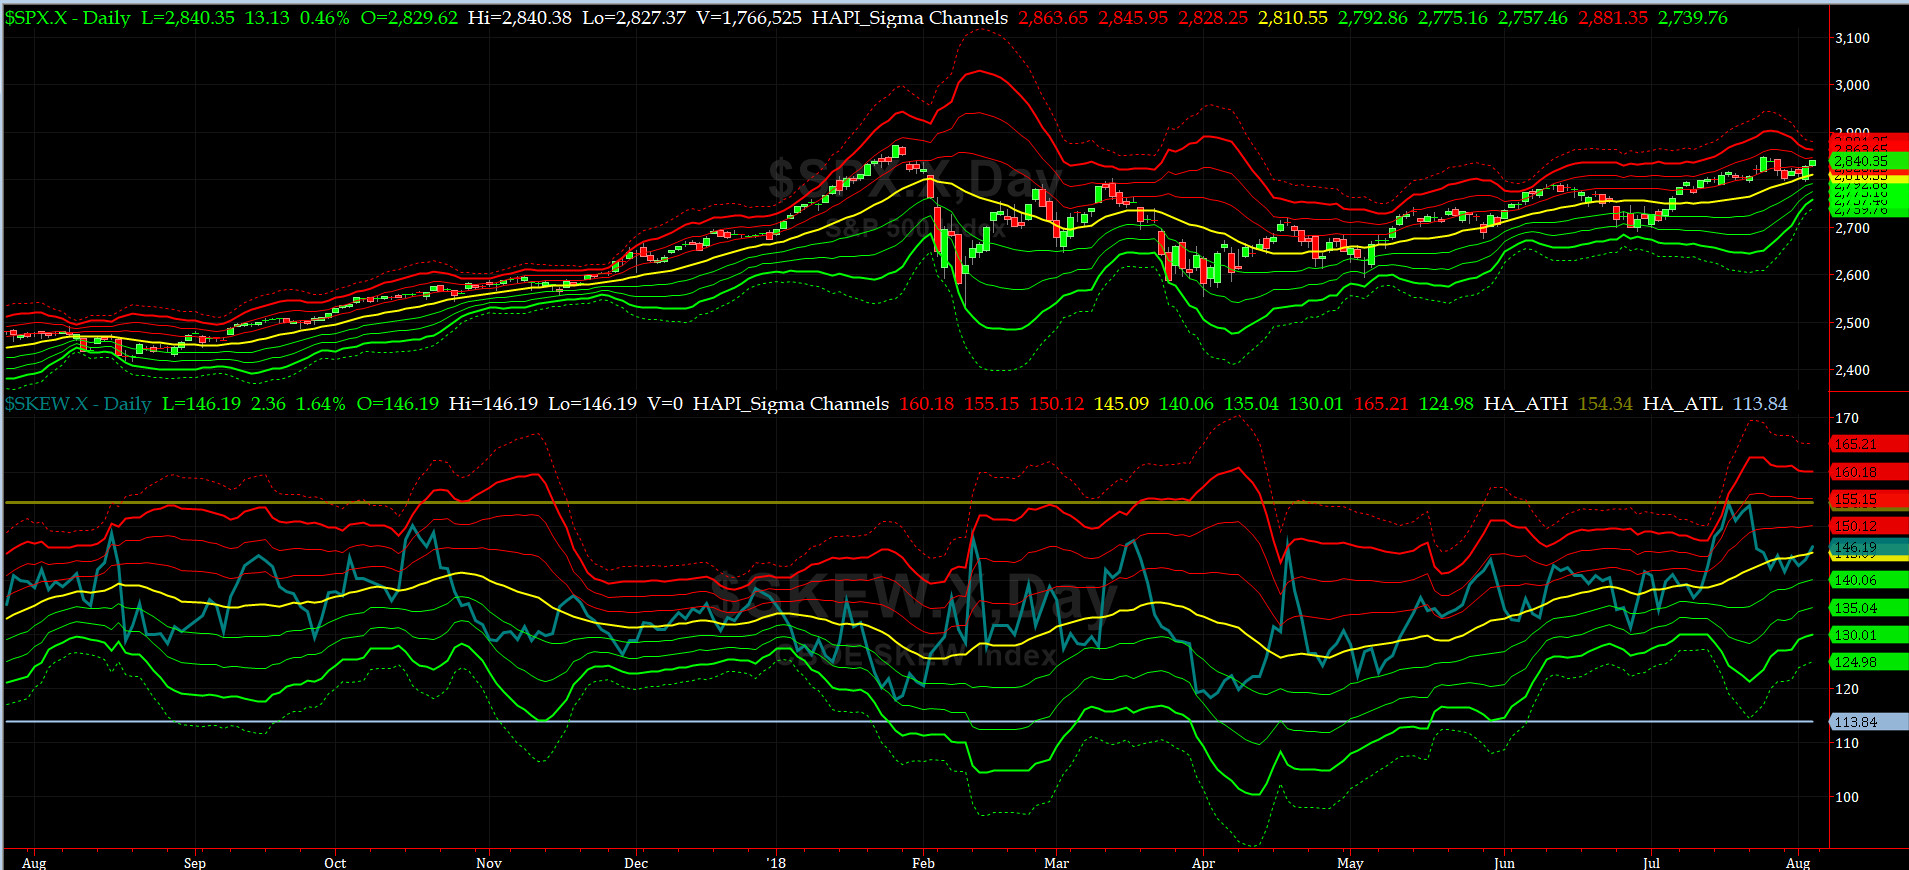
SPX SKEW (Tail Risk) Chart
On Friday, SPX SKEW (Tail Risk) closed near 146.2, right about its zero sigma (normal = 120-125, range 100-150).
Is all quiet on the Eastern & Mid-Western Fronts? Our beloved @Capt_Tiko says YES.
How to interpret the value of SPX SKEW? (from CBOE white paper on SKEW)

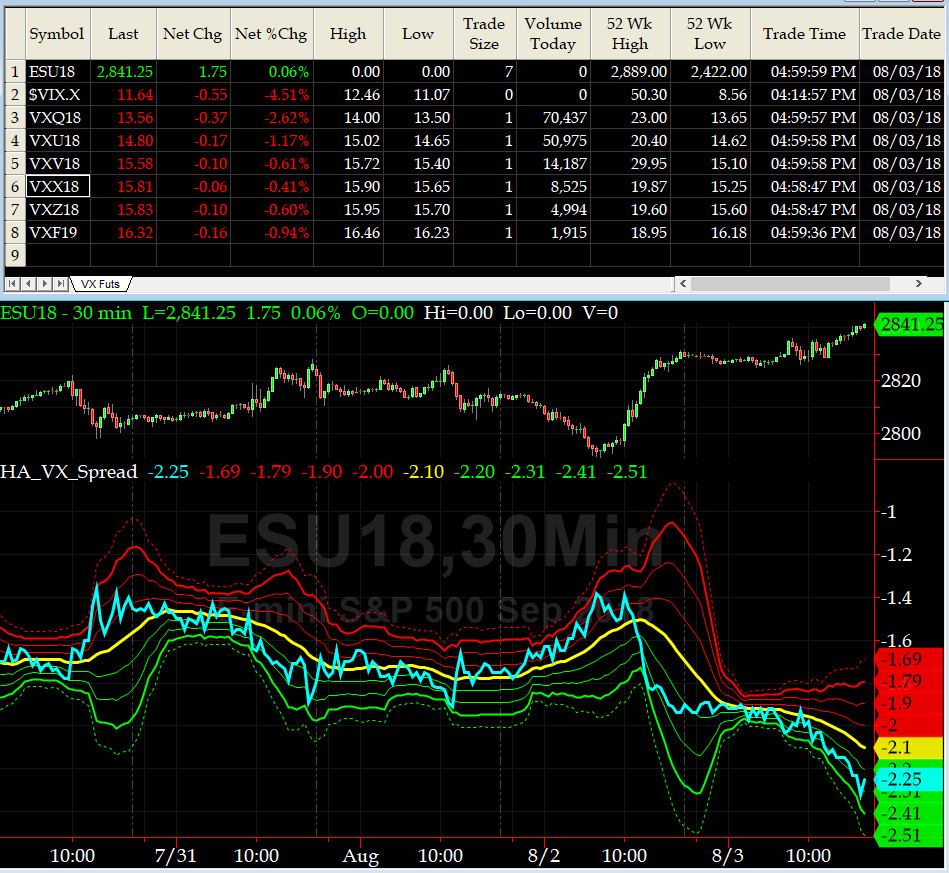
3-month VIX Futures Spread(VX) Chart
This popular timing indicator, (long AUG, & short NOV VIX Futures) is at -2.25. IOHO, we are slowly approaching overbought areas.
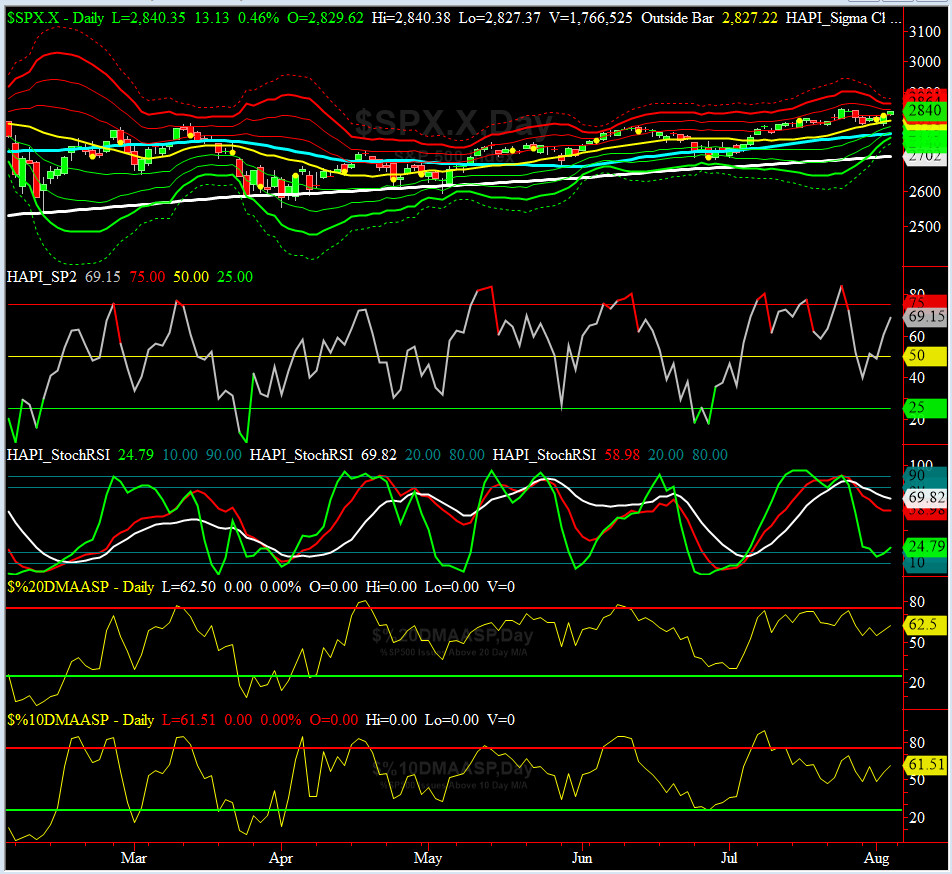
HA_SP2 Chart
HA_SP2 = 69 (Buy signal <= 25, Sell Signal >= 75)
Our coveted SP2 prop indicator dropped to 39.8 on Monday and then rose all the way up to 69 on Friday, nearing its overbought area.
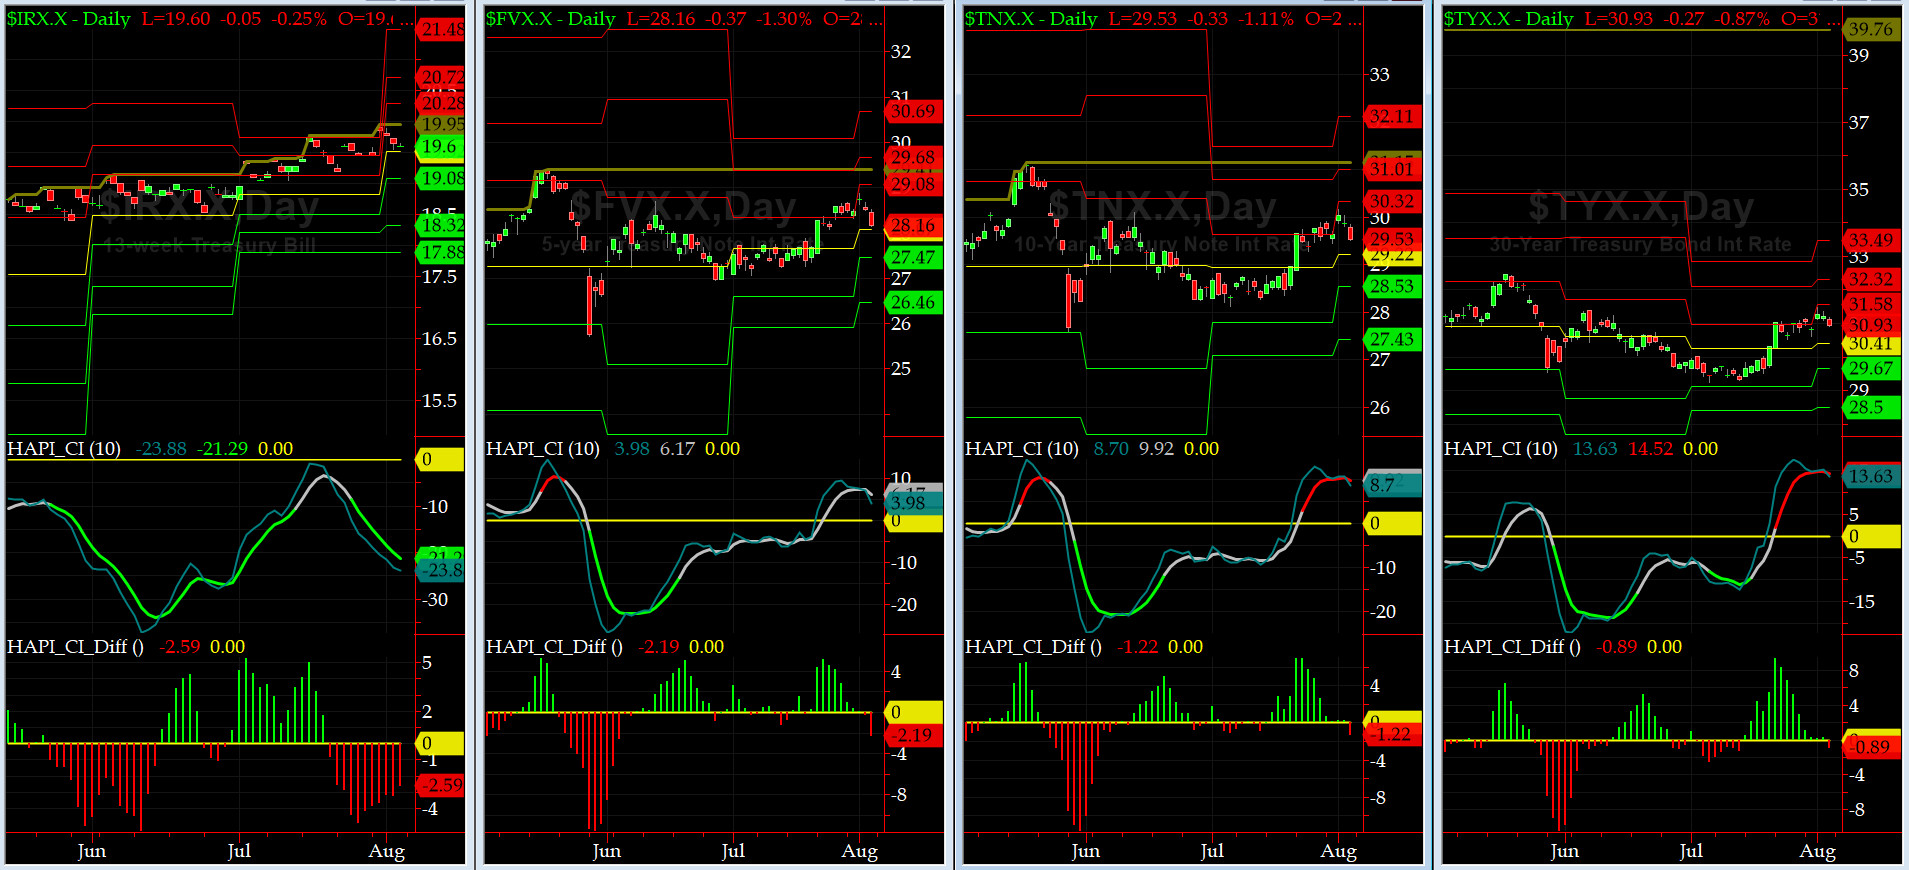
US Treasury T-Notes & T-Bonds Yields Chart
During this past week, the YTMs for the Notes & Bonds, slowly drifted down after hitting 3.0 on the ten yr but that was no surprise - most talking heads on Comedy Central (aka CNBC) have been talking about it for months. Our beloved Maury (& Mrs. Maury) are uber happy as a clam now.
Fari Hamzei
|


 Proactive Market Timing