|
Sunday, August 12th, 2018, 2230ET
Market Timing Charts, Analysis & Commentary for Issue #253
Timer Charts of S&P-500 Cash Index (SPX) + NASDAQ-100 Cash Index (NDX)
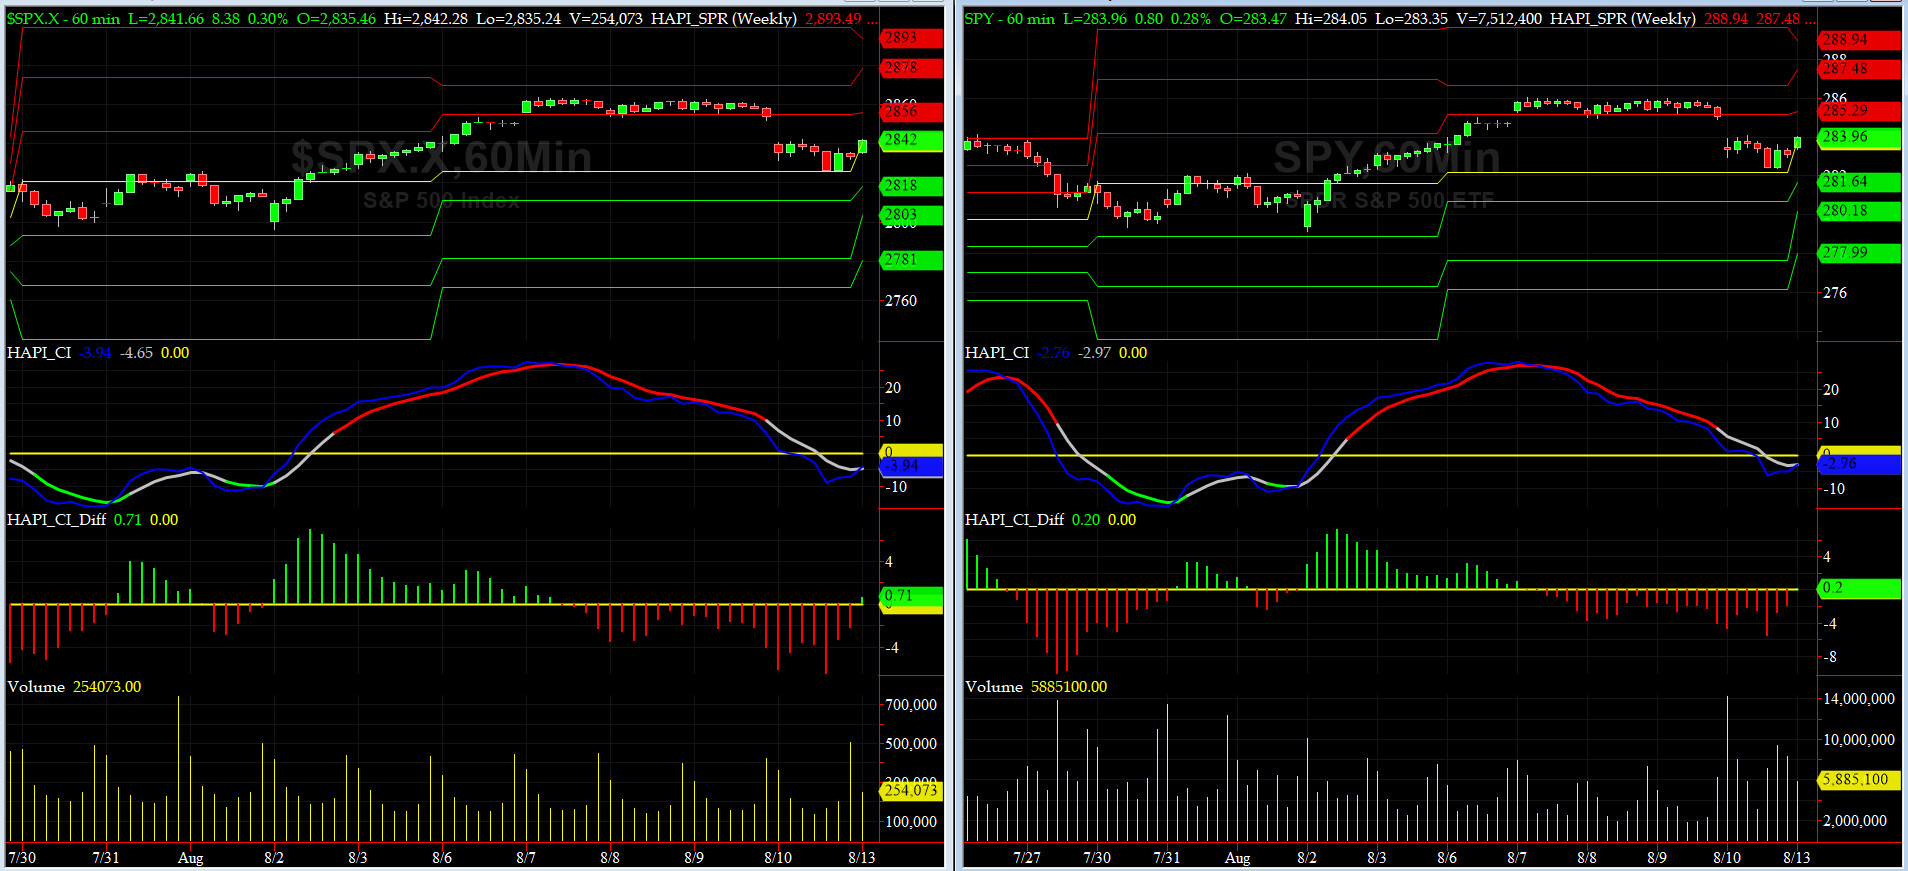
Most recent S&P-500 Cash Index (SPX): 2833 down -7 (down -0.25%) for the week ending on Friday, August 10, 2018, which closed about its +0.5 sigma.
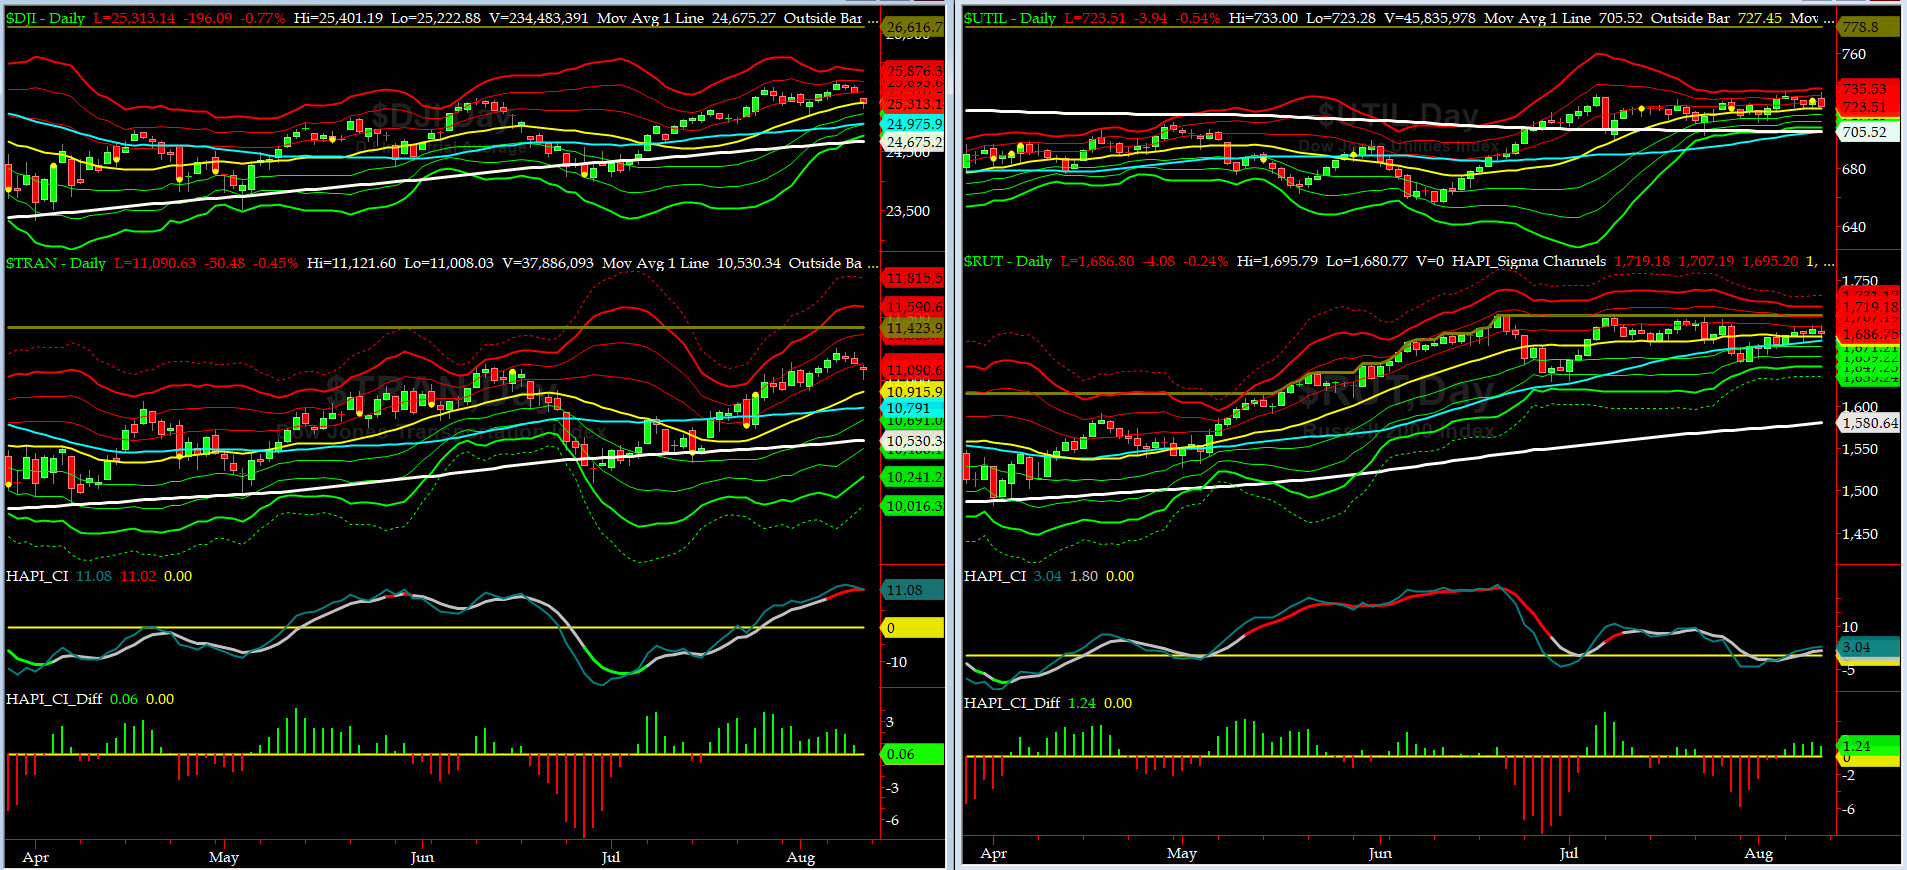
DJIA ALL TIME INTRADAY HIGH = 26617 (reached on Friday, January 26, 2018)
TRAN ALL TIME INTRADAY HIGH = 11424 (reached on Tuesday, January 16, 2018)
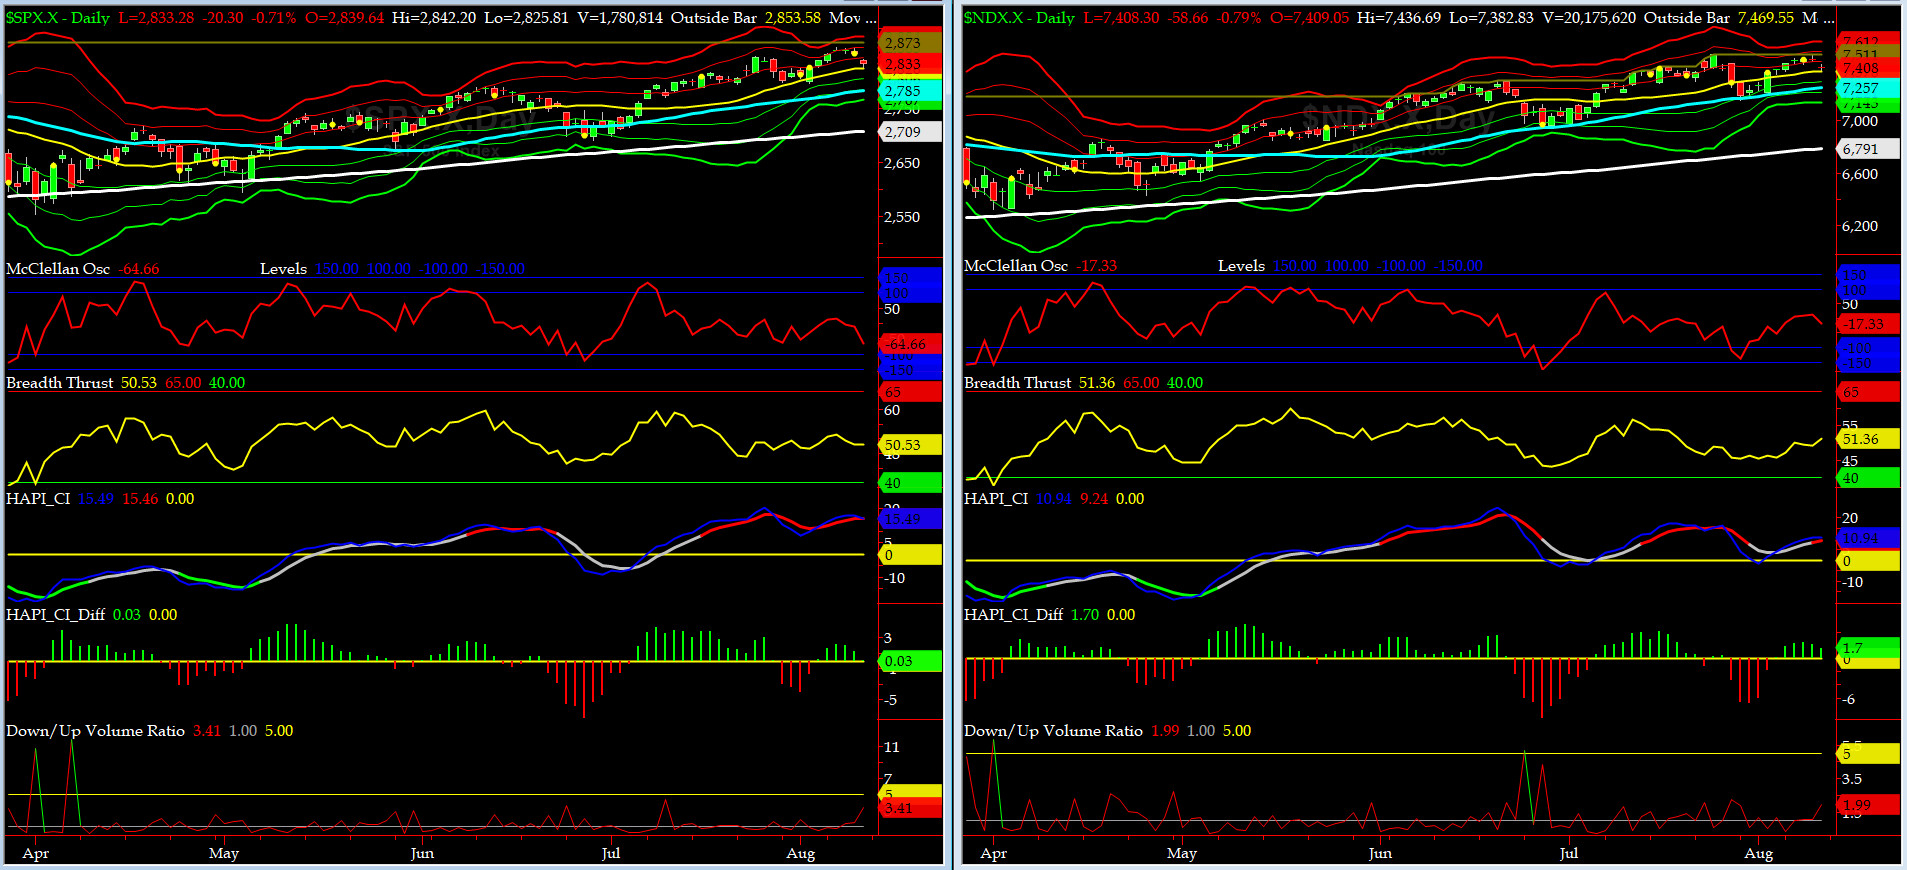
SPX ALL TIME INTRADAY HIGH = 2873 (reached on Friday, January 26, 2018)
NDX ALL TIME INTRADAY HIGH = 7511 (reached on Wednesday, July 25, 2018)
RUT ALL TIME INTRADAY HIGH = 1708 (reached on Tuesday, July 10, 2018)
Current DAILY +2 Sigma SPX = 2865 with WEEKLY +2 Sigma = 2867
Current DAILY 0 Sigma SPX = 2826 with WEEKLY 0 Sigma = 2734
Current DAILY -2 Sigma SPX = 2787 with WEEKLY -2 Sigma = 2602
NYSE McClellan Oscillator = -65 (-150 is start of the O/S area; around -275 to -300 area or lower, we go into the �launch-pad� mode, over +150, we are in O/B area)
NYSE Breadth Thrust = 50.5 (40 is considered as oversold and 65 as overbought)
SPX had a decent run-up on Monday followed by three days of sausage ops and then a big whoosh down right after we changed our bias the evening before.
Canaries [in the Coal Mine] Chart for DJ TRAN & RUT Indices
200-Day MA DJ TRAN = 10,530 or 5.3% below DJ TRAN (max observed in last 7 yrs = 20.2%, min = -20.3%)
200-Day MA RUT = 1580 or 6.7% below RUT (max observed in last 7 yrs = 21.3%, min = -22.6%)
DJ Transportation Index (proxy for economic conditions 6 to 9 months hence) had a mixed week and after a huge intraday fall on Friday, ended up closing about unchanged for the week.
Russell 2000 Small Caps Index (proxy for Risk ON/OFF) pretty much tested and stayed above its 50-day MA. RISK is still ON but may put in lower highs here, so stay tuned.
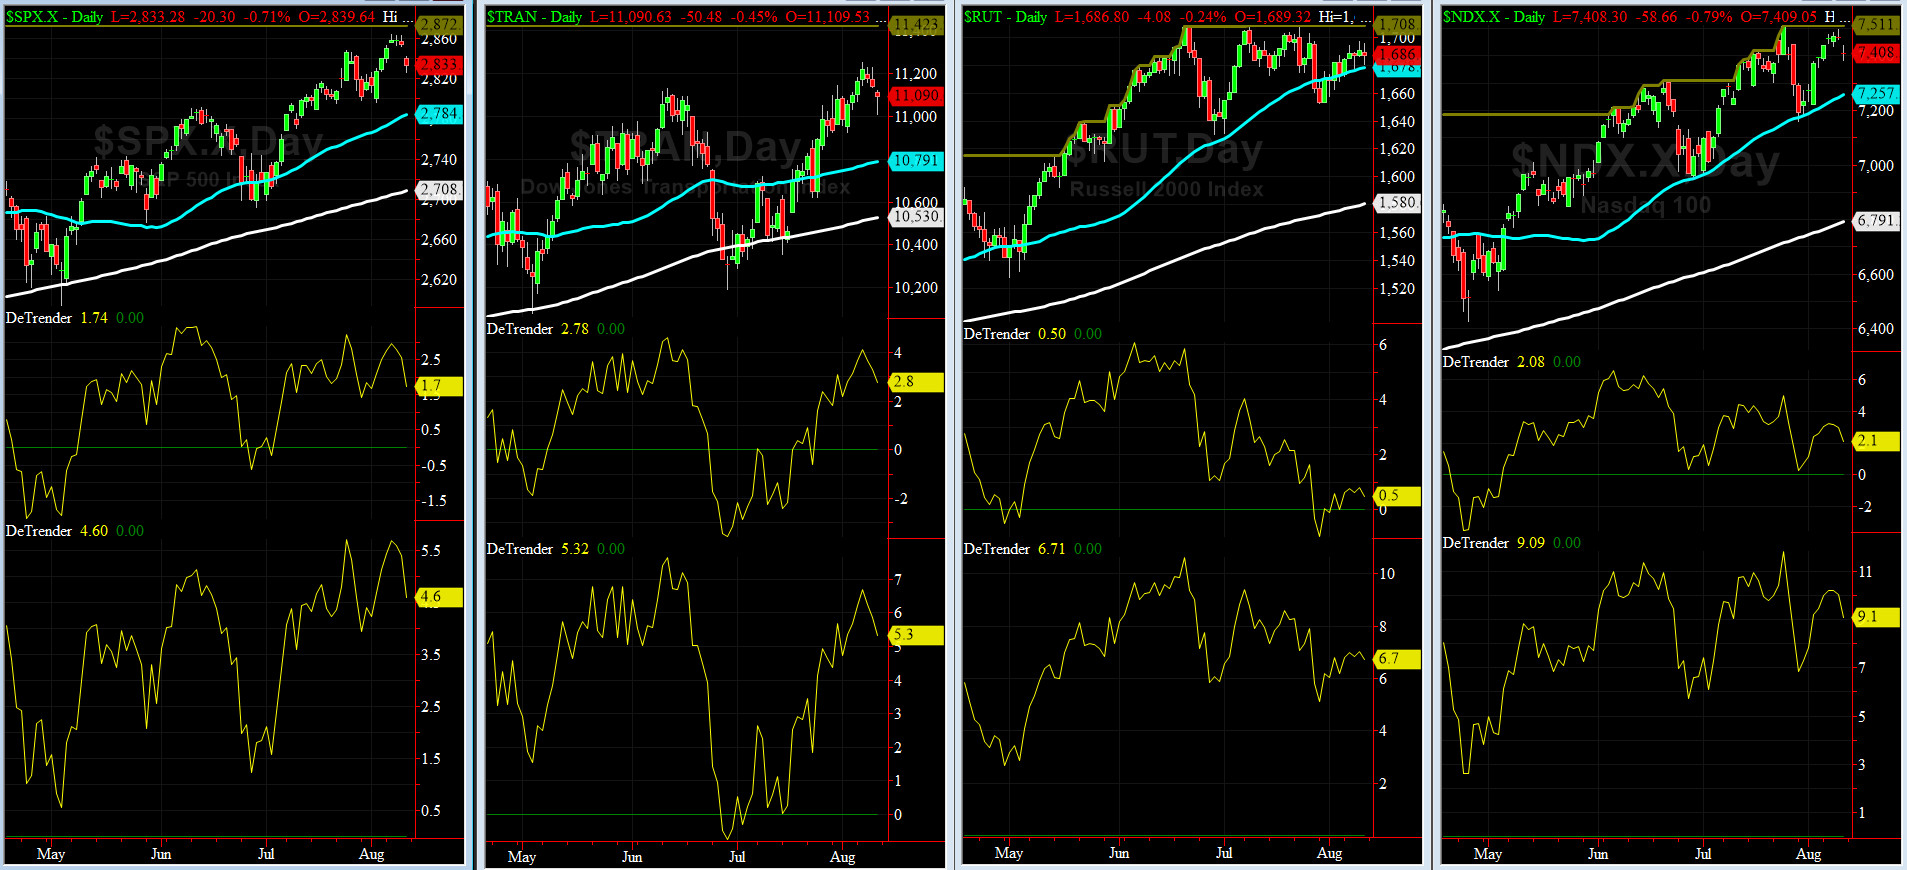
DeTrenders Charts for SPX, NDX, TRAN & RUT Indices
50-Day MA SPX = 2784 or 1.7% below SPX (max observed in last 7 yrs = +8.6%, min = -9.3%)
200-Day MA SPX = 2708 or 4.6% below SPX (max observed in last 7 yrs = 15.2%, min = -14%)
ALL of our EIGHT DeTrenders are in POSITIVE territory. The DeTrenders for DJ Tran & RUT will continue to be harbingers of future price behavior in broad indices.
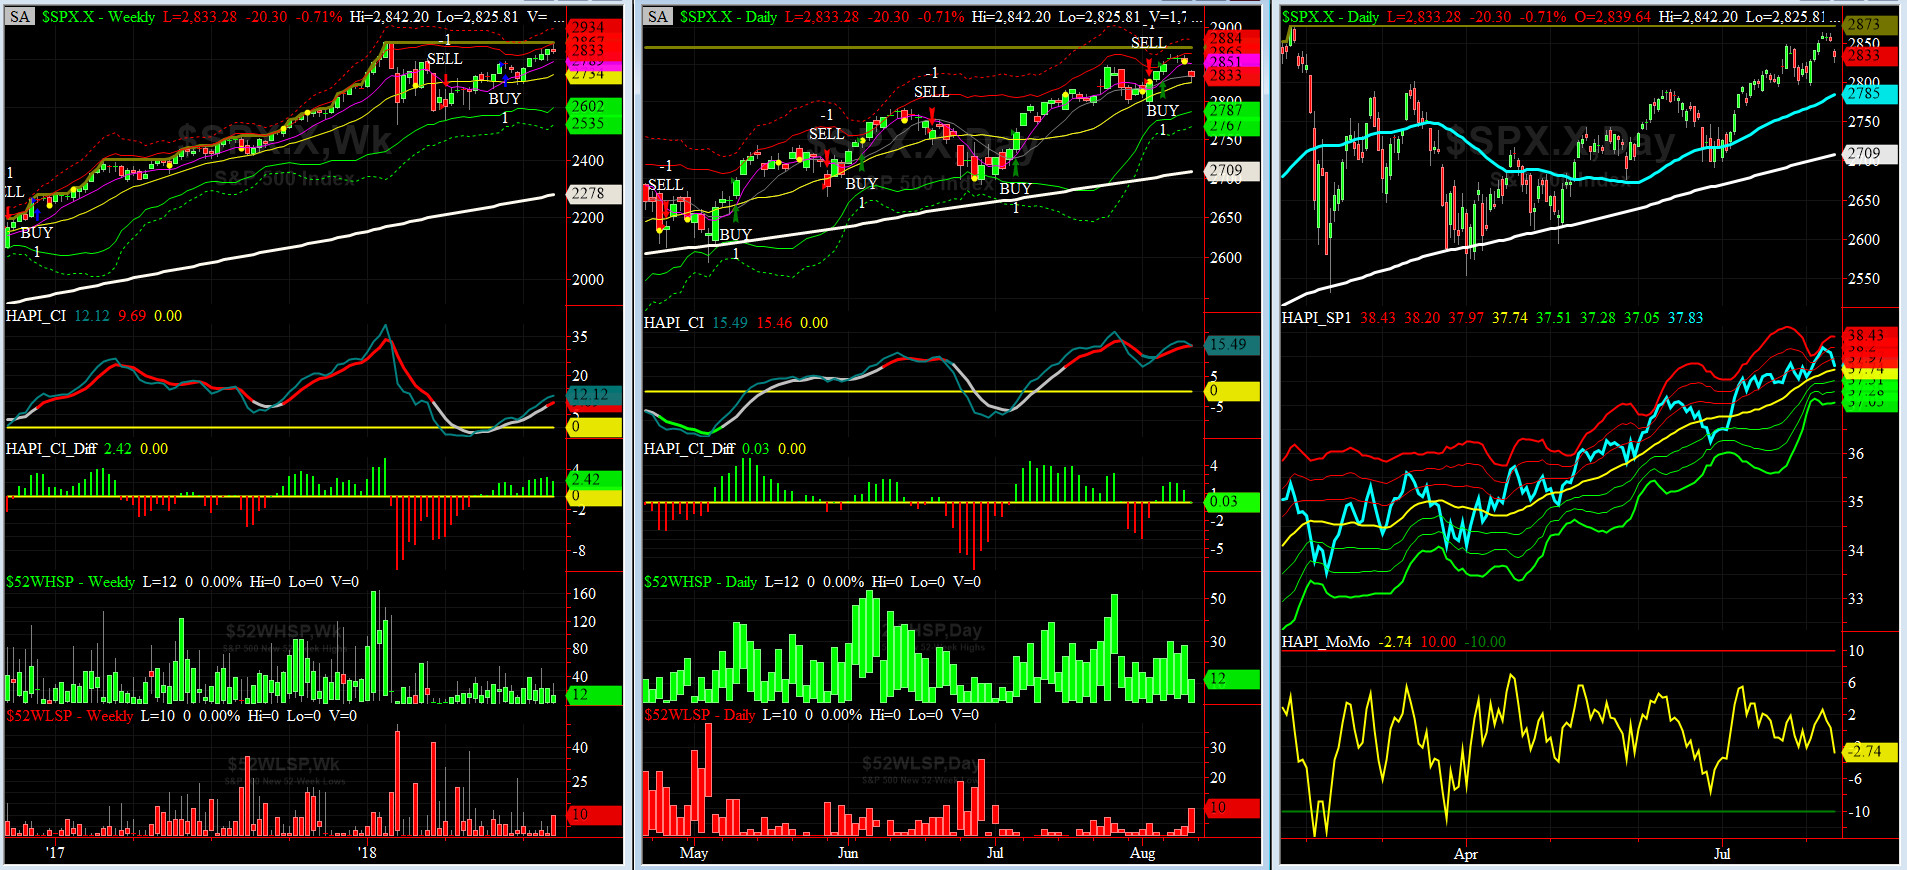
HA_SP1_Momo Chart
WEEKLY Timing Model = on a BUY Signal since Friday, June 15, 2018 CLOSE at 2779
DAILY Timing Model = on a BUY Signal since Monday, August 6, 2018 CLOSE at 2850
Max SPX 52wk-highs reading last week = 30 (over 120-140, the local maxima is in)
Max SPX 52wk-Lows reading last week = 10 (over 40-60, the local minima is in)
HA_SP1 closed just above its zero sigma channels
HA_Momo = -2.7 (reversals most likely occur above +10 or below -10)

Vol of the Vols Chart
Spot VIX currently stands at 13.16, right about its +1 sigma (remember it's the VIX volatility pattern aka "its sigma channels" that matters, and not the level of VIX itself (this is per Dr. Robert Whaley, a great mentor and inventor of original VIX, now called VXO). VIX usually peaks around a test of its +4 sigma).
VIX hit 13.8 on Friday and is beginning to rotate up. Should SPX close lower on Monday, we think first hour of Tuesday is a must watch for VIX enthusiasts.
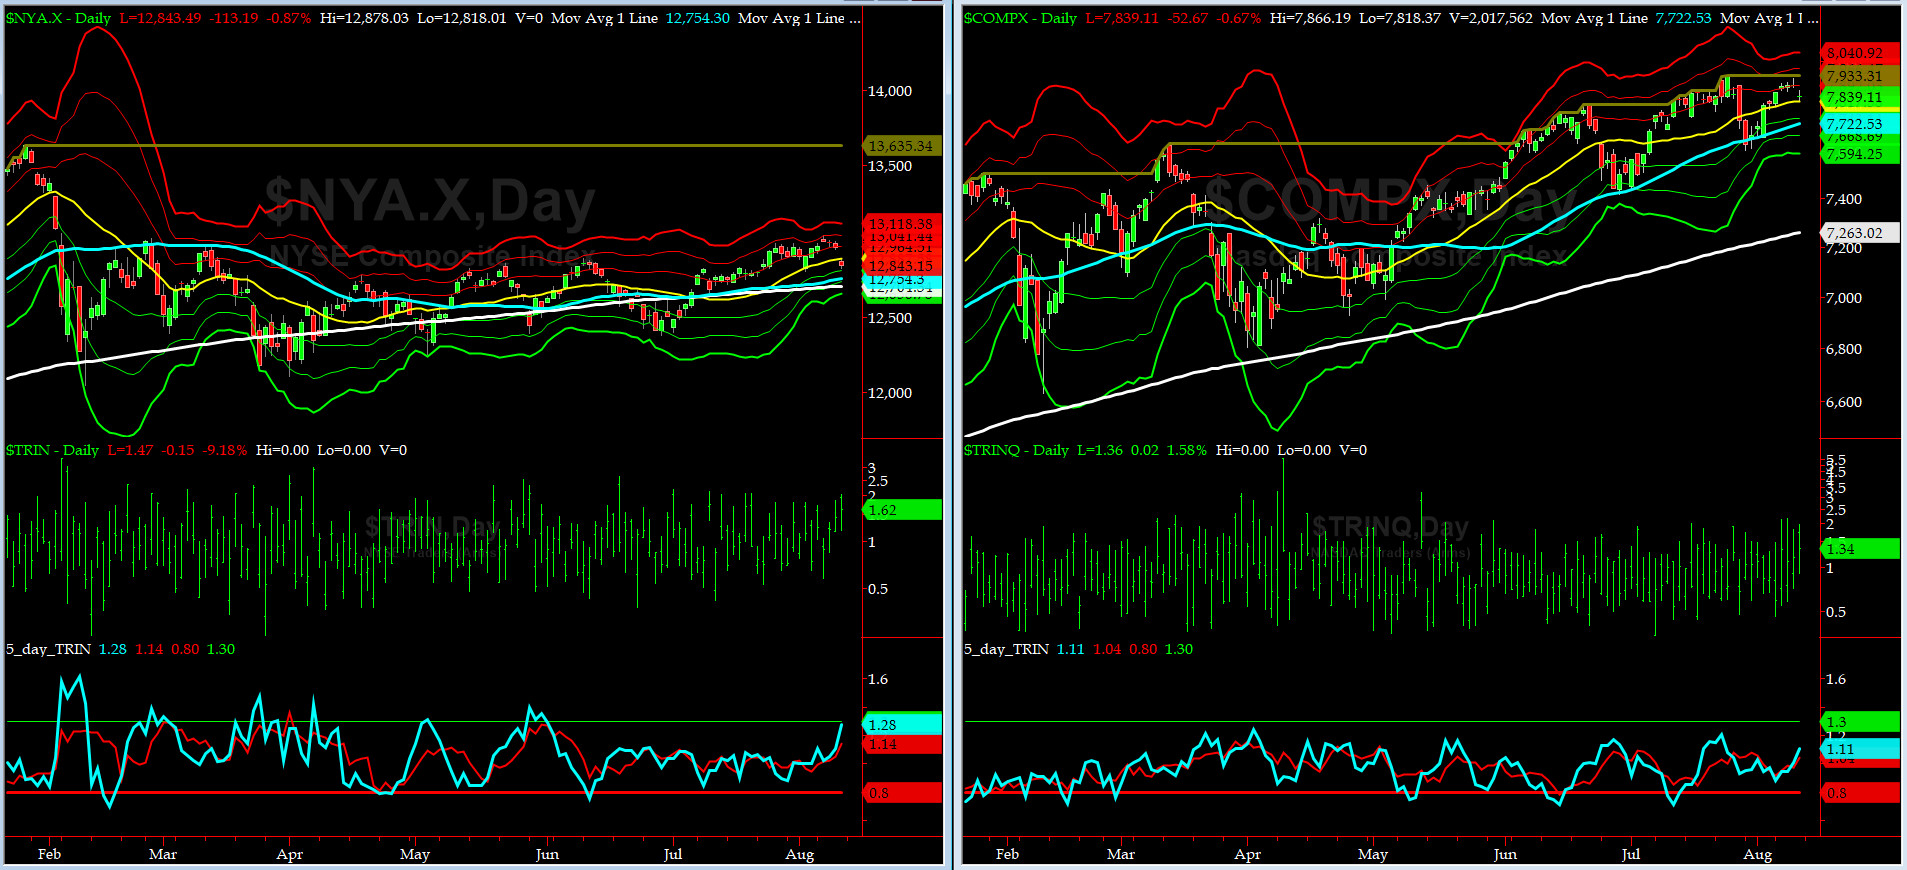
5-day TRIN & TRINQ Charts
Both NYSE & NASDAQ 5-day TRINs are beginning to head towards BUY zones.
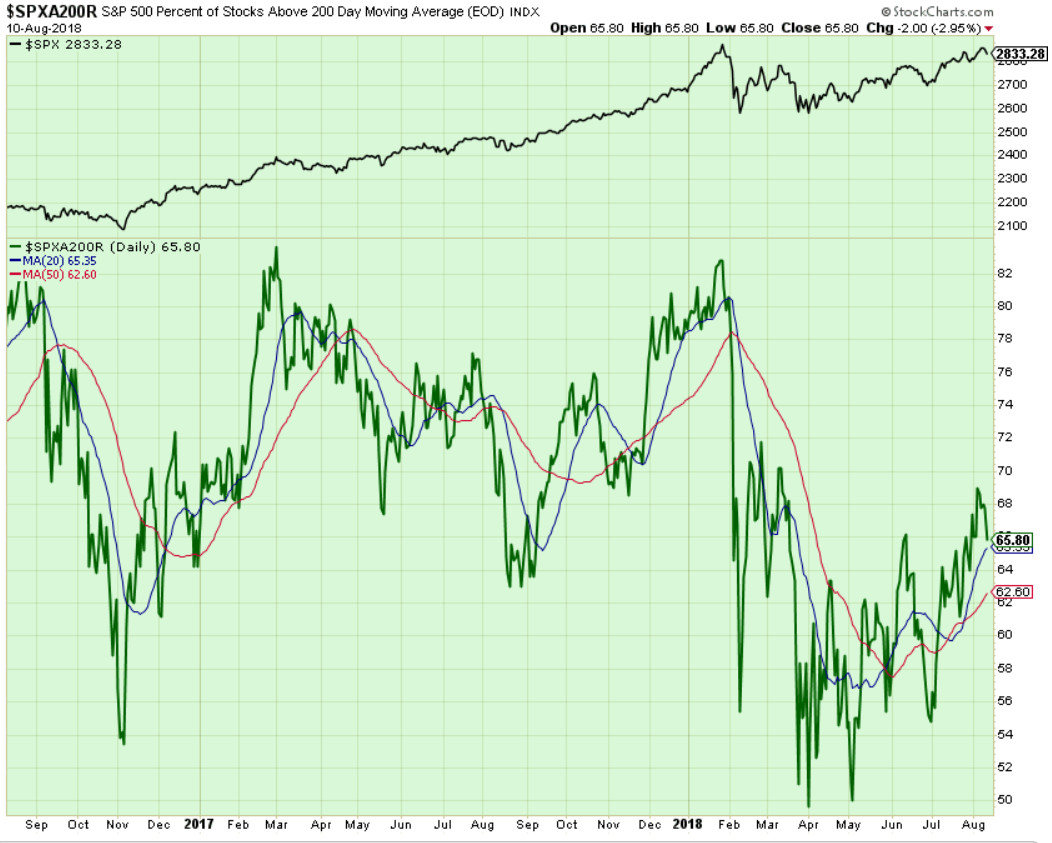
Components of SPX above their respective 200day MA Chart
This scoring indicator could not rise above 69% and ended down to 66% by the close of Friday. If 65 level is broken, then the next stop is 62-60 area.
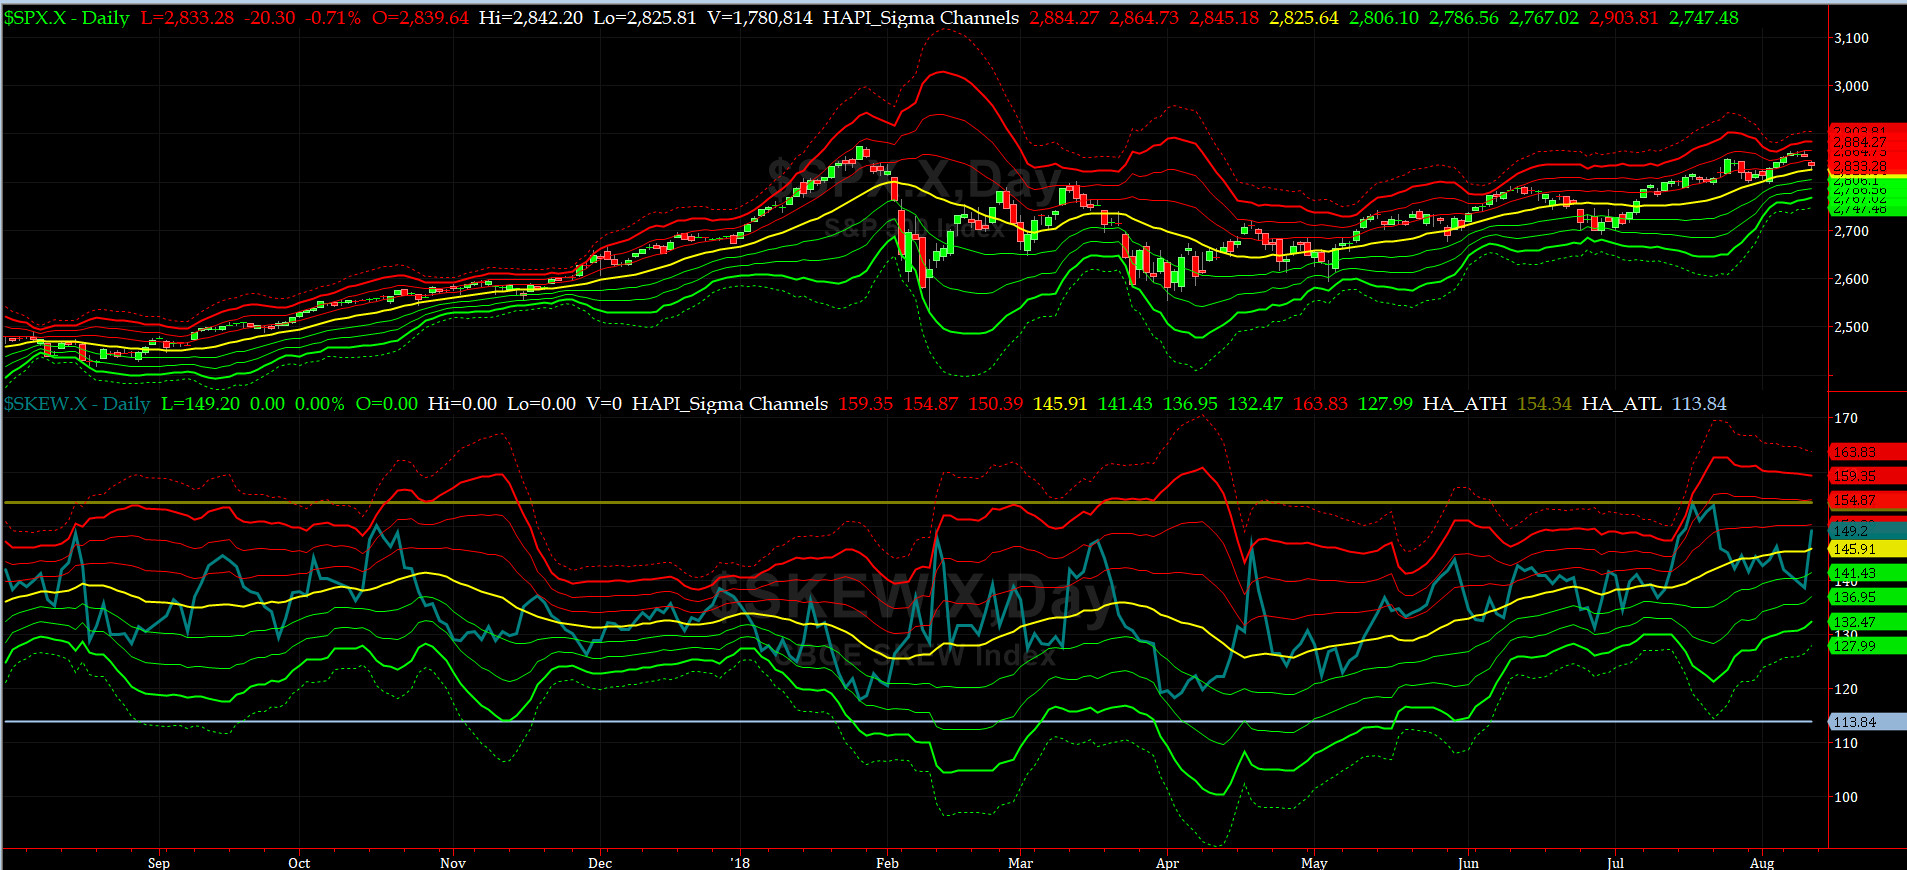
SPX SKEW (Tail Risk) Chart
On Friday, SPX SKEW (Tail Risk) closed near 149.2, right about its +1 sigma (normal = 120-125, range 100-150).
Is all quiet on the Eastern & Mid-Western Fronts? Our beloved @Capt_Tiko says NO.
How to interpret the value of SPX SKEW? (from CBOE white paper on SKEW)


3-month VIX Futures Spread(VX) Chart
This popular timing indicator, (long AUG, & short NOV VIX Futures) is at -1.98, closing in its NEUTRAL zone.
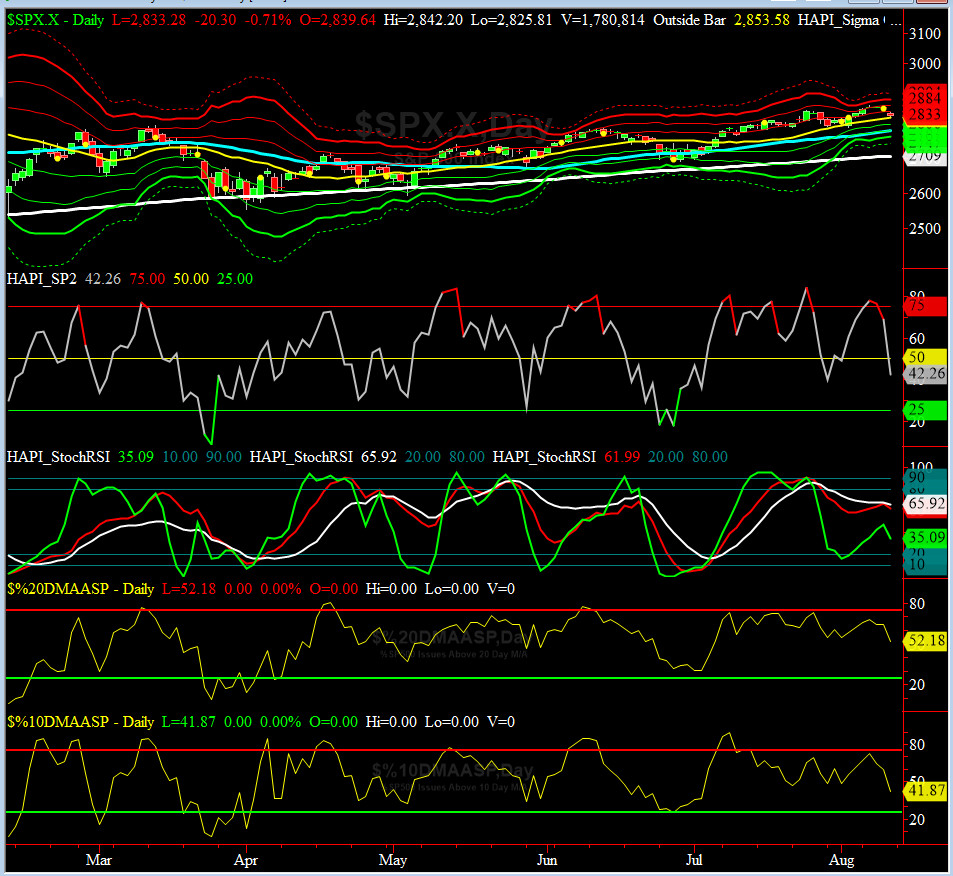
HA_SP2 Chart
HA_SP2 = 42.3 (Buy signal <= 25, Sell Signal >= 75)
Our coveted SP2 prop indicator rose to 78.1 on Tuesday and then dropped all the way down to 42.3 by Friday close. Next level to watch is 25.

US Treasury T-Notes & T-Bonds Yields Chart
During this past week, the YTMs for the Notes & Bonds, had a very dull market till Friday morning when the Flight-To-Quality Trades showed up and YTMs gave back precious ground. No shopping on Rodeo Dr this weekend for our beloved Maury & Mrs. Maury.
Fari Hamzei
|


 Proactive Market Timing