|
Sunday, August 19th, 2018, 1445ET
Market Timing Charts, Analysis & Commentary for Issue #254
Timer Charts of S&P-500 Cash Index (SPX) + NASDAQ-100 Cash Index (NDX)
Most recent S&P-500 Cash Index (SPX): 2850 up +17 (up +0.6%) for the week ending on Friday, August 17, 2018, which closed about its +1 sigma.
DJIA ALL TIME INTRADAY HIGH = 26617 (reached on Friday, January 26, 2018)
TRAN ALL TIME INTRADAY HIGH = 11424 (reached on Tuesday, January 16, 2018)
SPX ALL TIME INTRADAY HIGH = 2873 (reached on Friday, January 26, 2018)
NDX ALL TIME INTRADAY HIGH = 7511 (reached on Wednesday, July 25, 2018)
RUT ALL TIME INTRADAY HIGH = 1708 (reached on Tuesday, July 10, 2018)
Current DAILY +2 Sigma SPX = 2866 with WEEKLY +2 Sigma = 2880
Current DAILY 0 Sigma SPX = 2833 with WEEKLY 0 Sigma = 2745
Current DAILY -2 Sigma SPX = 2799 with WEEKLY -2 Sigma = 2610
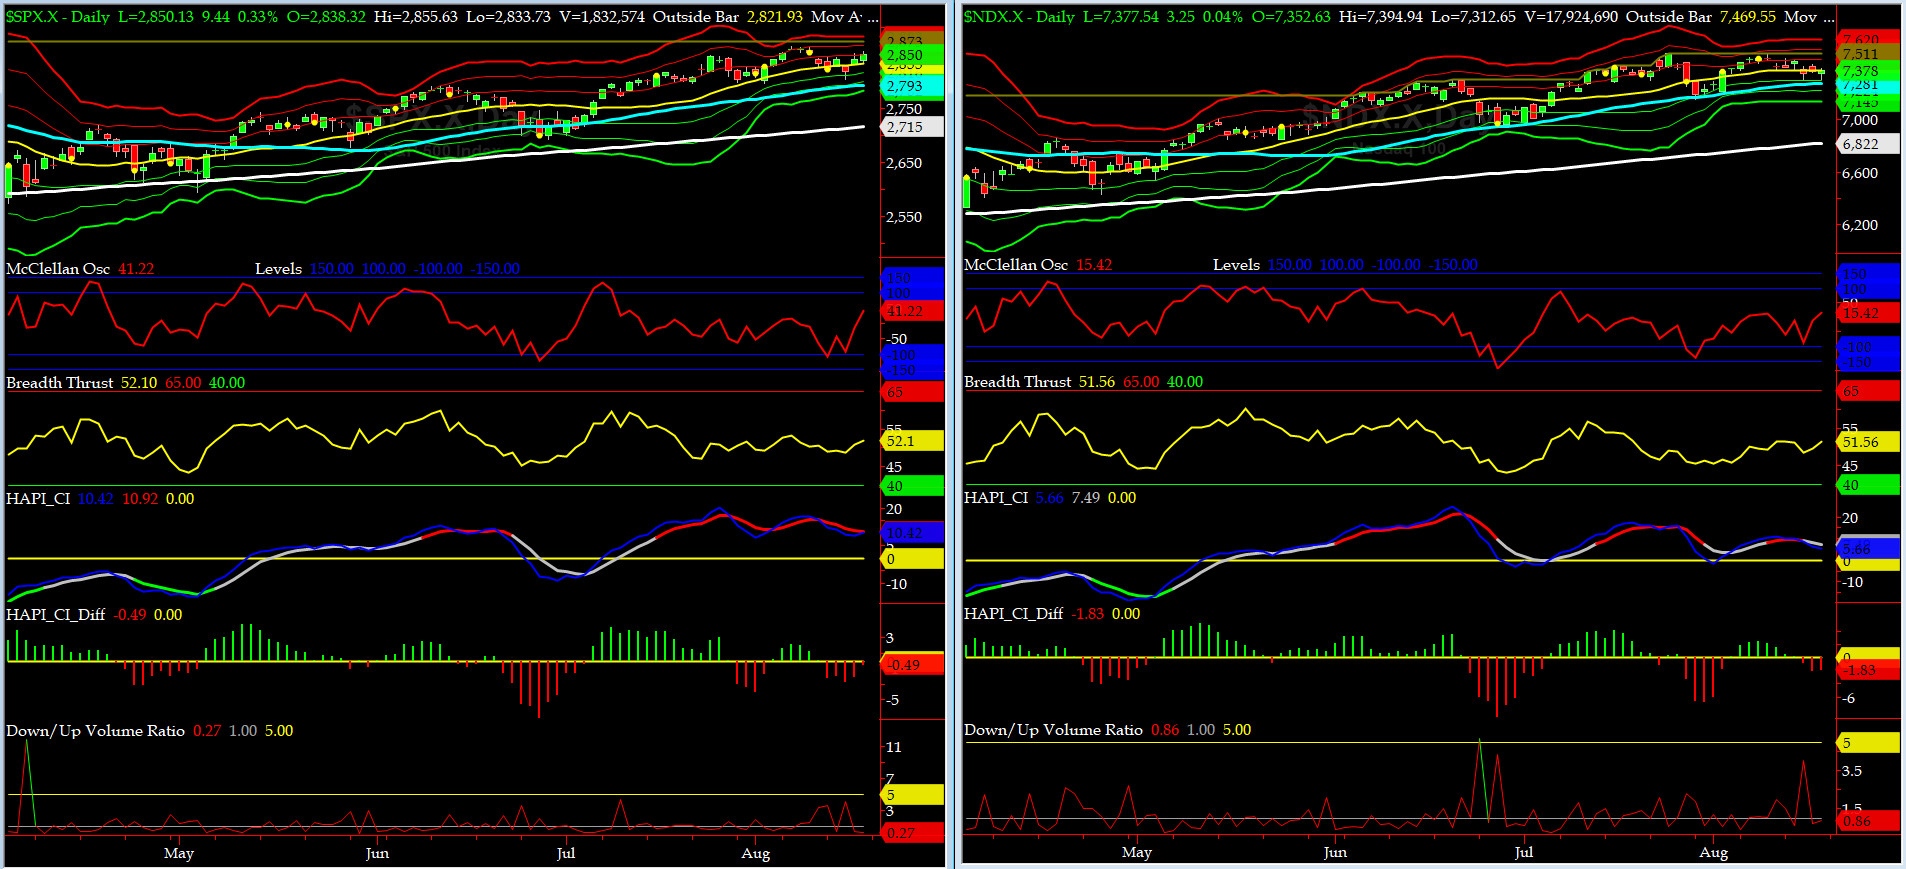
NYSE McClellan Oscillator = +41 (-150 is start of the O/S area; around -275 to -300 area or lower, we go into the �launch-pad� mode; over +150, we are in O/B area)
NYSE Breadth Thrust = 52.1 (40 is considered as oversold and 65 as overbought)
SPX had a key reversal on Wednesday night and we were blessed by @Capt_Tiko for issuing the launch command and we are now up a tad over 50 SPX handles from that low.
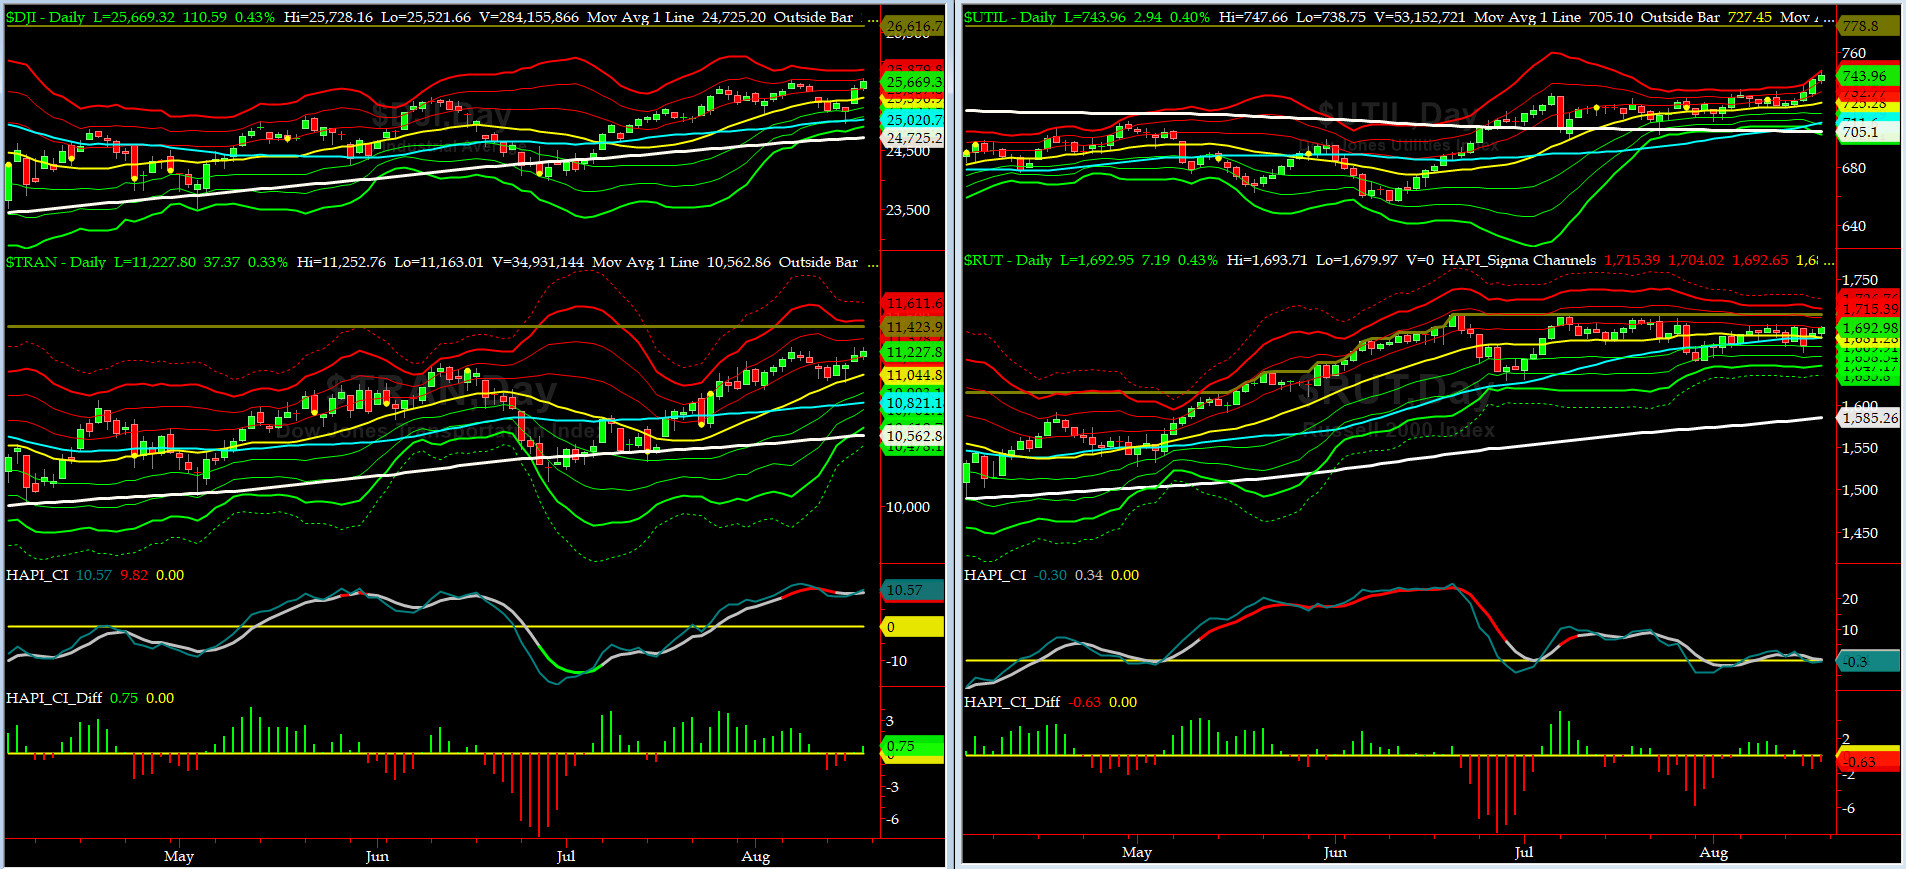
Canaries [in the Coal Mine] Chart for DJ TRAN & RUT Indices
200-Day MA DJ TRAN = 10,562 or 6.3% below DJ TRAN (max observed in last 7 yrs = 20.2%, min = -20.3%)
200-Day MA RUT = 1585 or 6.8% below RUT (max observed in last 7 yrs = 21.3%, min = -22.6%)
DJ Transportation Index (proxy for economic conditions 6 to 9 months hence) is approaching a "breakout" mode, if that comes to fruitarian, then new ATHs are next....stay tuned, sailors.
Russell 2000 Small Caps Index (proxy for Risk ON/OFF) had another week of "sausage ops" near its elevated 50 day MA. RISK is still ON and gunning for its new ATHs....so stay tuned.
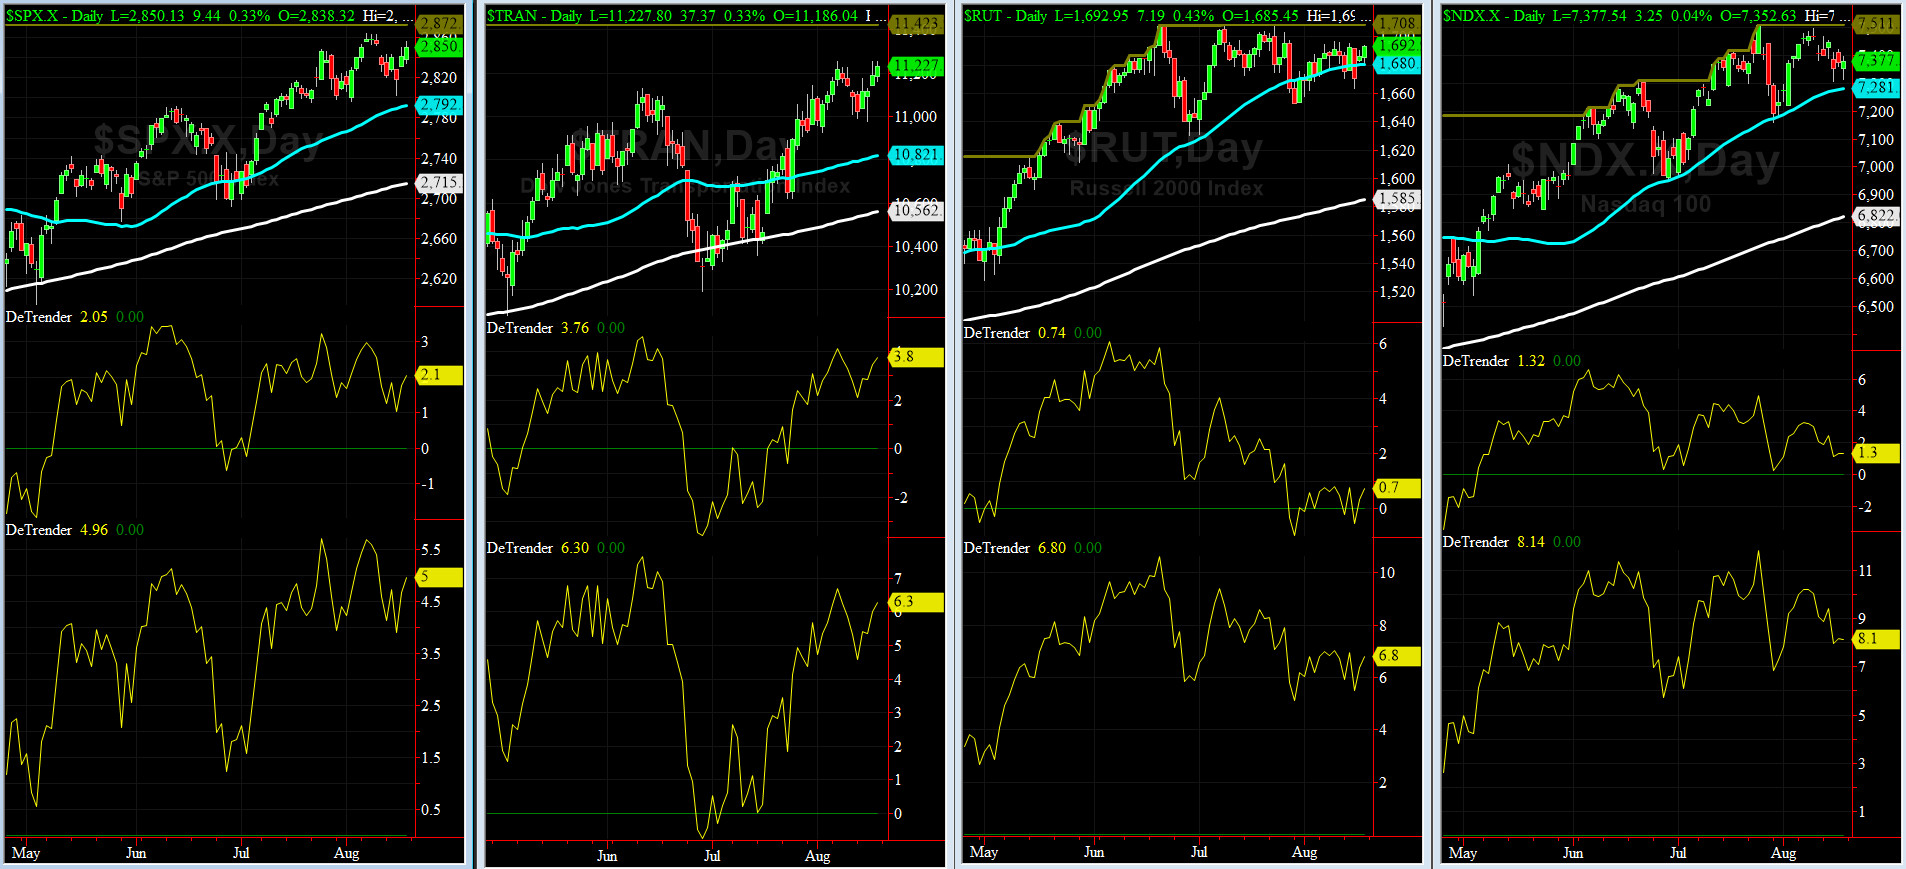
DeTrenders Charts for SPX, NDX, TRAN & RUT Indices
50-Day MA SPX = 2792 or 2.1% below SPX (max observed in last 7 yrs = +8.6%, min = -9.3%)
200-Day MA SPX = 2715 or 5% below SPX (max observed in last 7 yrs = 15.2%, min = -14%)
ALL of our EIGHT DeTrenders are in POSITIVE territory. The DeTrenders for DJ Tran & RUT will continue to be harbingers of future price behavior in broad indices.

HA_SP1_Momo Chart
WEEKLY Timing Model = on a BUY Signal since Friday, June 15, 2018 CLOSE at 2779
DAILY Timing Model = on a SELL Signal since Monday, August 14, 2018 CLOSE at 2818
Max SPX 52wk-highs reading last week = 38 (over 120-140, the local maxima is in)
Max SPX 52wk-Lows reading last week = 13 (over 40-60, the local minima is in)
HA_SP1 closed just above its +2 sigma channels
HA_Momo = +3.2 (reversals most likely occur above +10 or below -10)
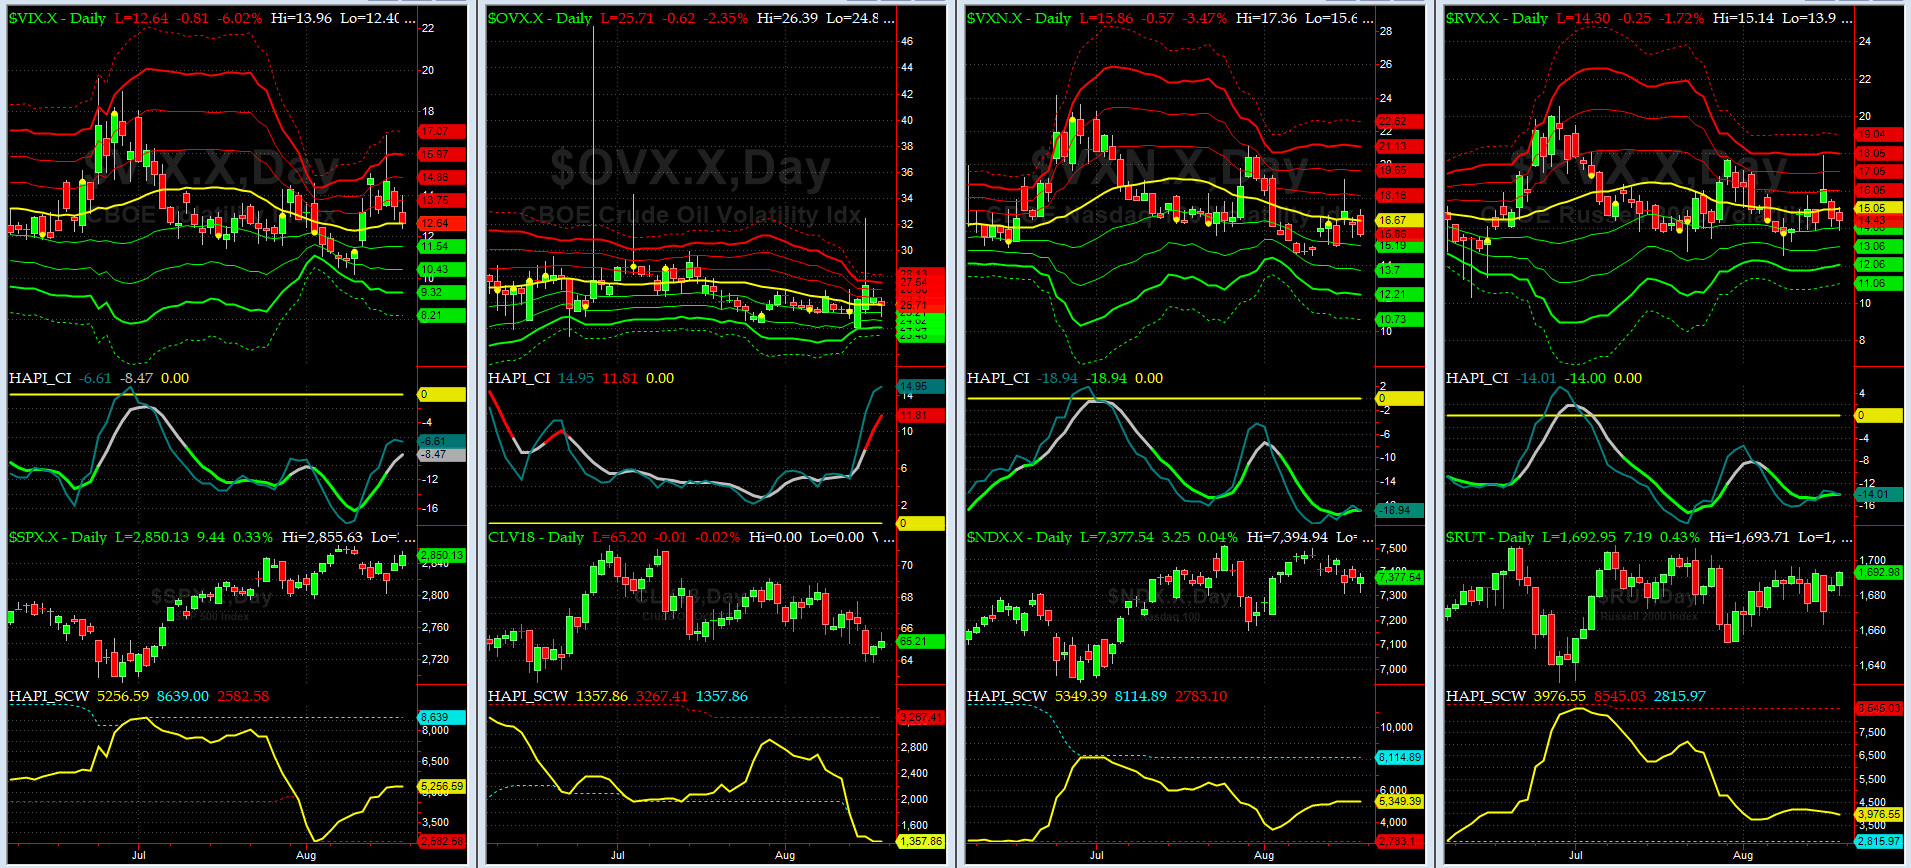
Vol of the Vols Chart
Spot VIX currently stands at 12.64, right about its +1 sigma (remember it's the VIX volatility pattern aka "its sigma channels" that matters, and not the level of VIX itself (this is per Dr. Robert Whaley, a great mentor and inventor of original VIX, now called VXO). VIX usually peaks around a test of its +4 sigma).
VIX hit 16.86 on Wednesday which corresponds to +4 sigma channels (as you recall from Issue #253, our target was over 15) and then rotated down. Over all it was a small shockwave. More to come? ubetcha (in Palingo) as we approach post Labor Day active markets.
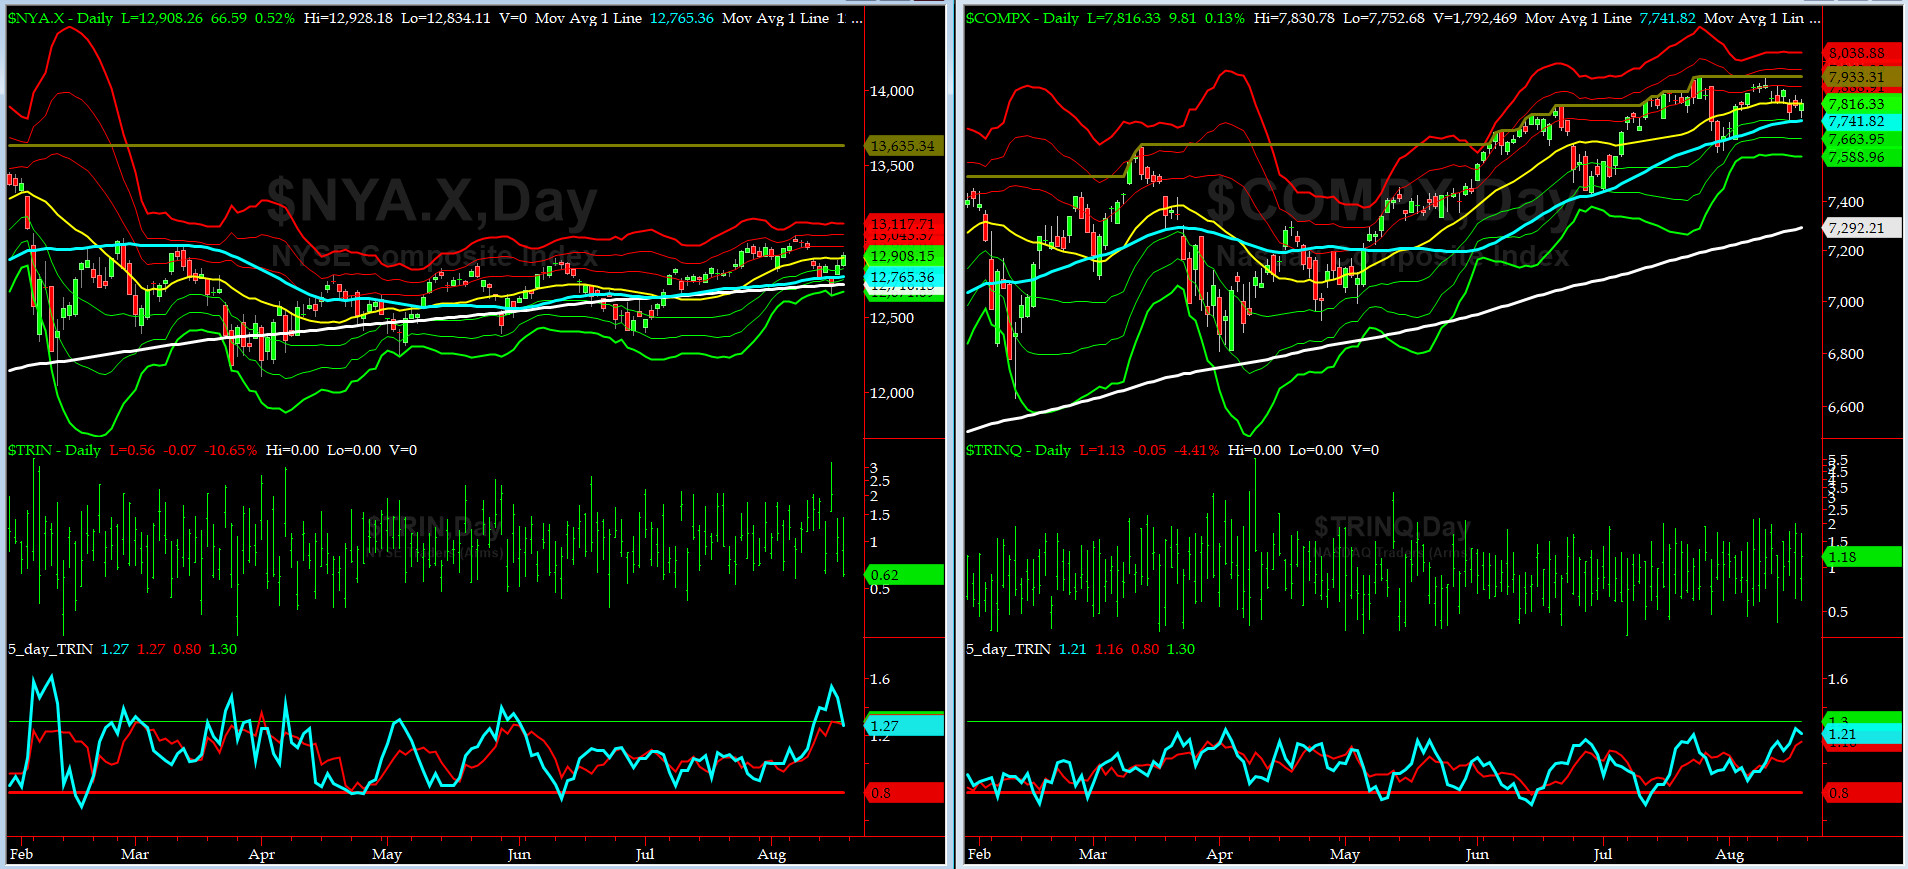
5-day TRIN & TRINQ Charts
Both NYSE & NASDAQ 5-day TRINs are both in BUY zones now.
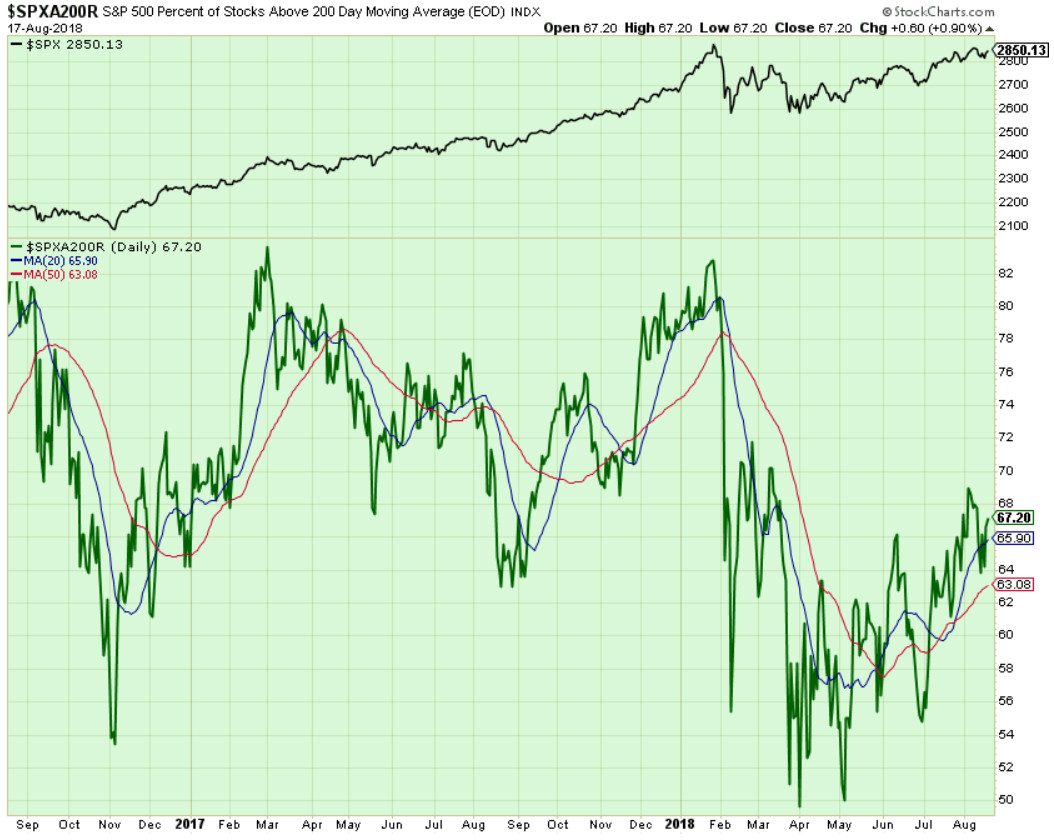
Components of SPX above their respective 200day MA Chart
This scoring indicator still has not risen above 69% and but we think it has a positive retest failure around 64% area mid-week. If 69 level is punched thru, then the next stop is 72 area.
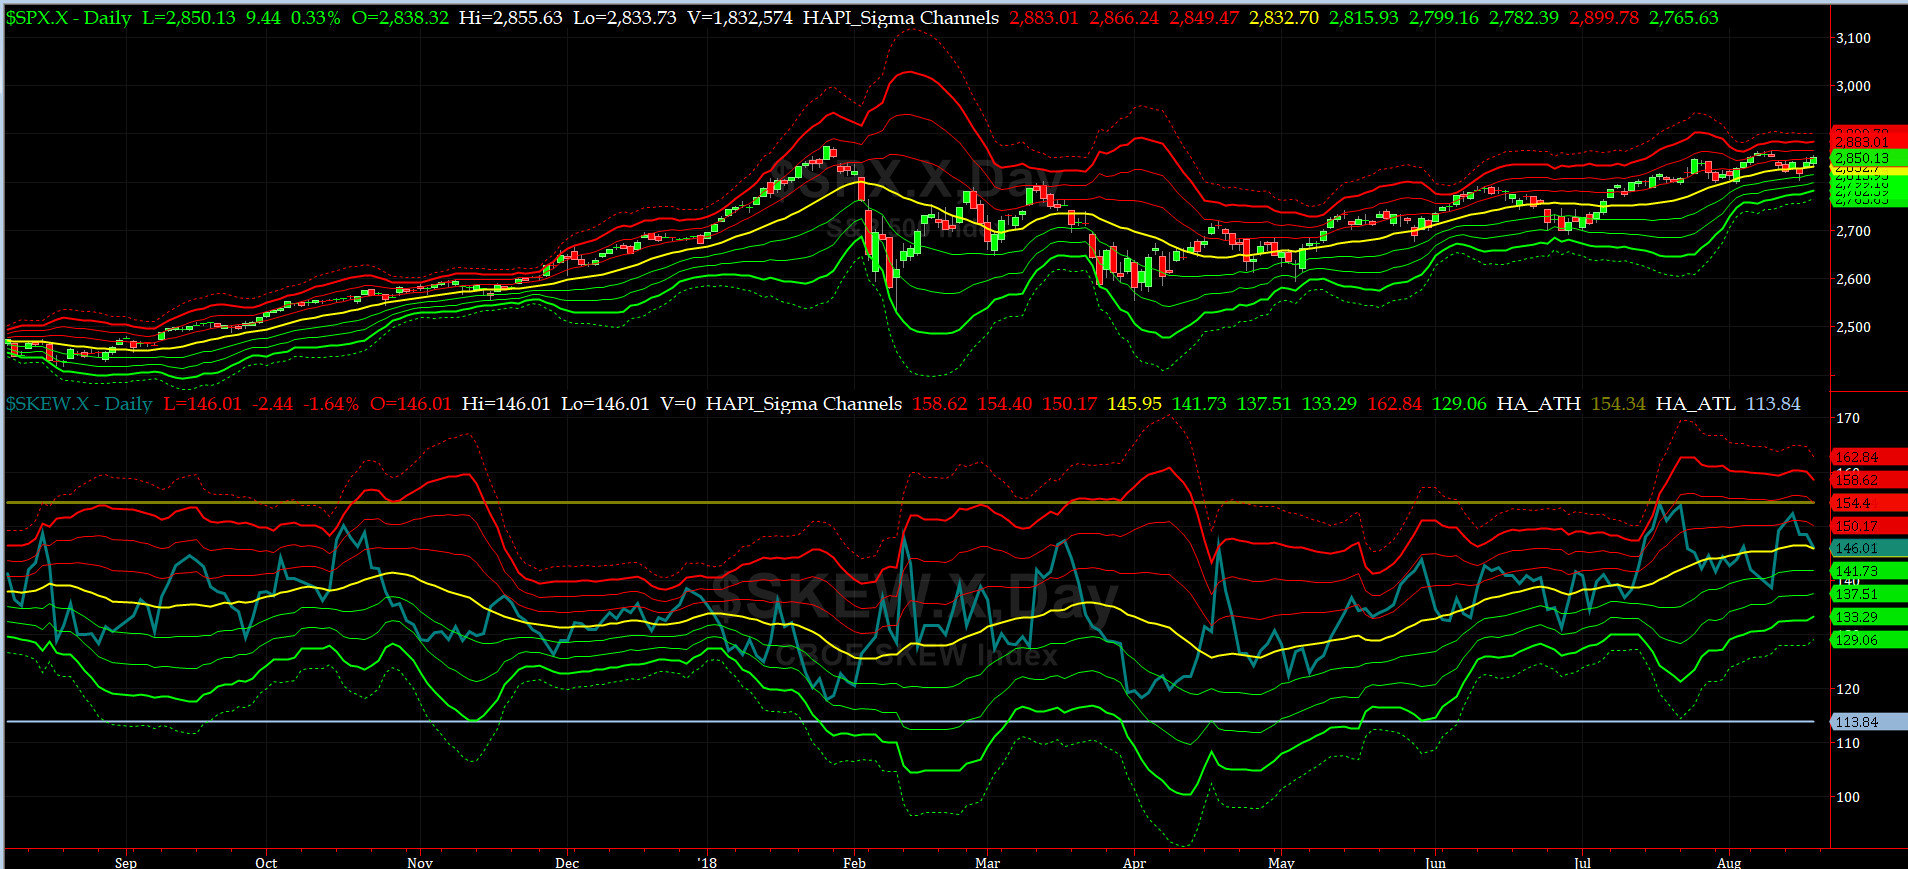
SPX SKEW (Tail Risk) Chart
On Friday, SPX SKEW (Tail Risk) closed near 146, right about its zero sigma (normal = 120-125, range 100-150).
Is all quiet on the Eastern & Mid-Western Fronts? Our beloved @Capt_Tiko says "maybe."
How to interpret the value of SPX SKEW? (from CBOE white paper on SKEW)

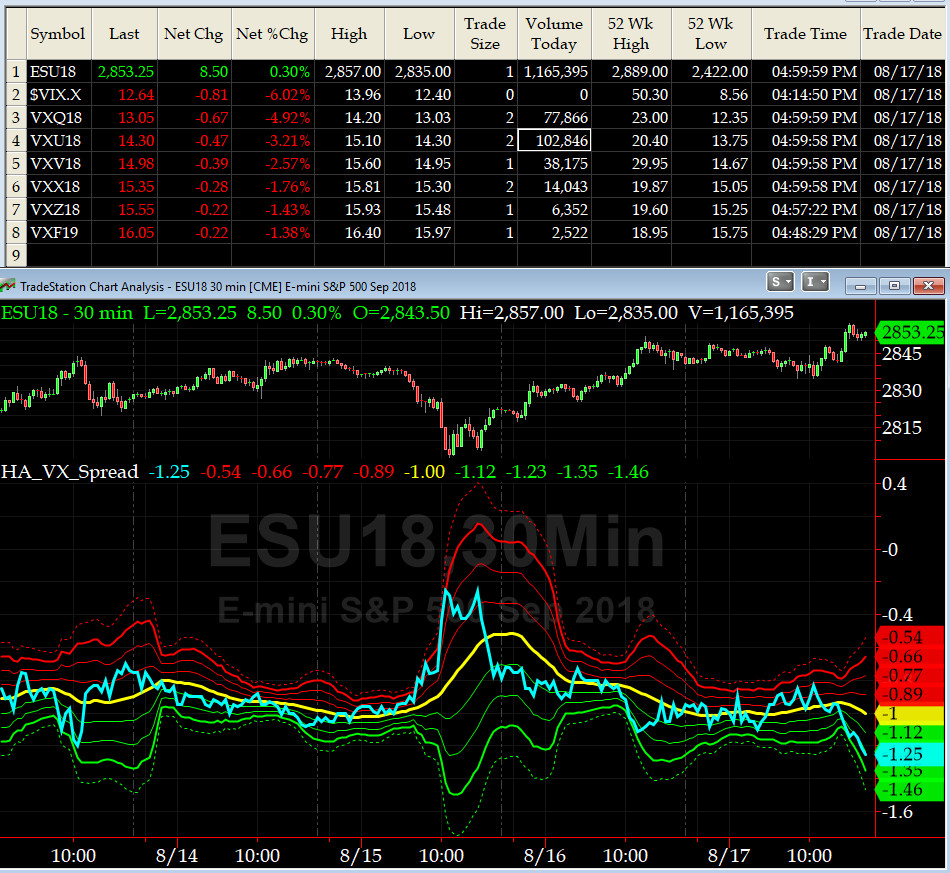
3-month VIX Futures Spread(VX) Chart
This popular timing indicator, (long Sep, & short Deez VIX Futures) is at -1.25, closing in its slightly bullish zone.
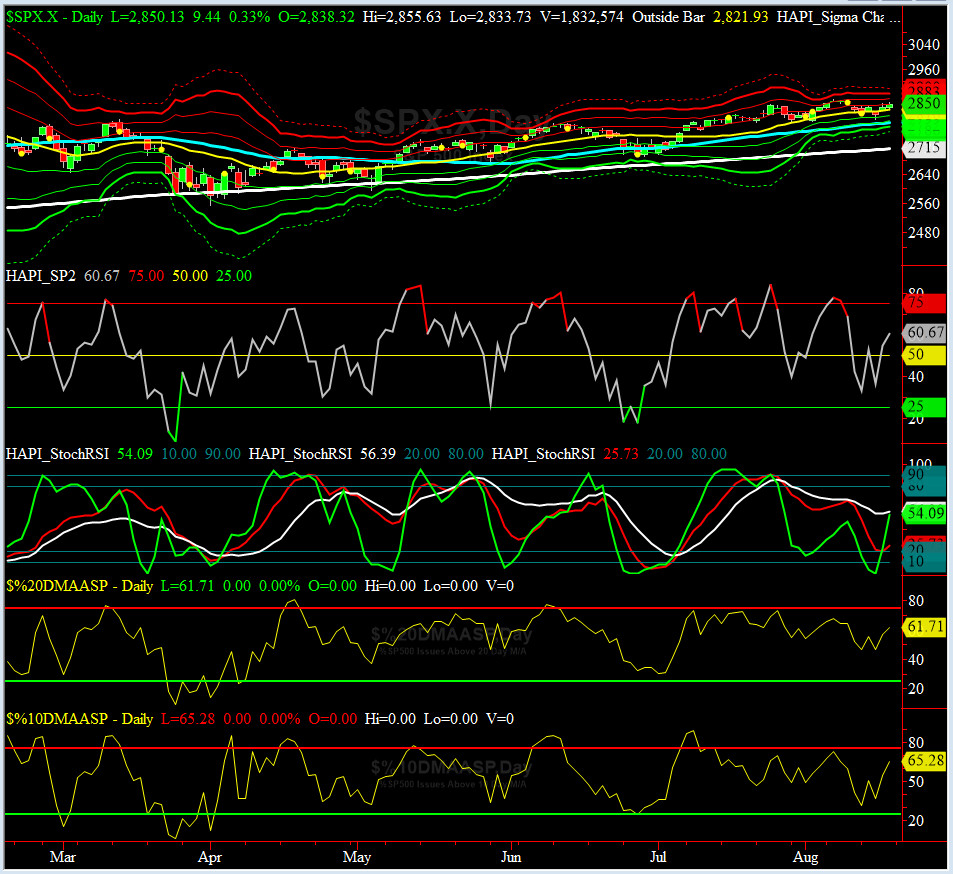
HA_SP2 Chart
HA_SP2 = 60.7 (Buy signal <= 25, Sell Signal >= 75)
Our coveted SP2 prop indicator dropped to 36 and put in bullish divergence on Wednesday. And as you would have guessed, Capt_Tiko, right there and then, inserted his missile key. Rest is history!!
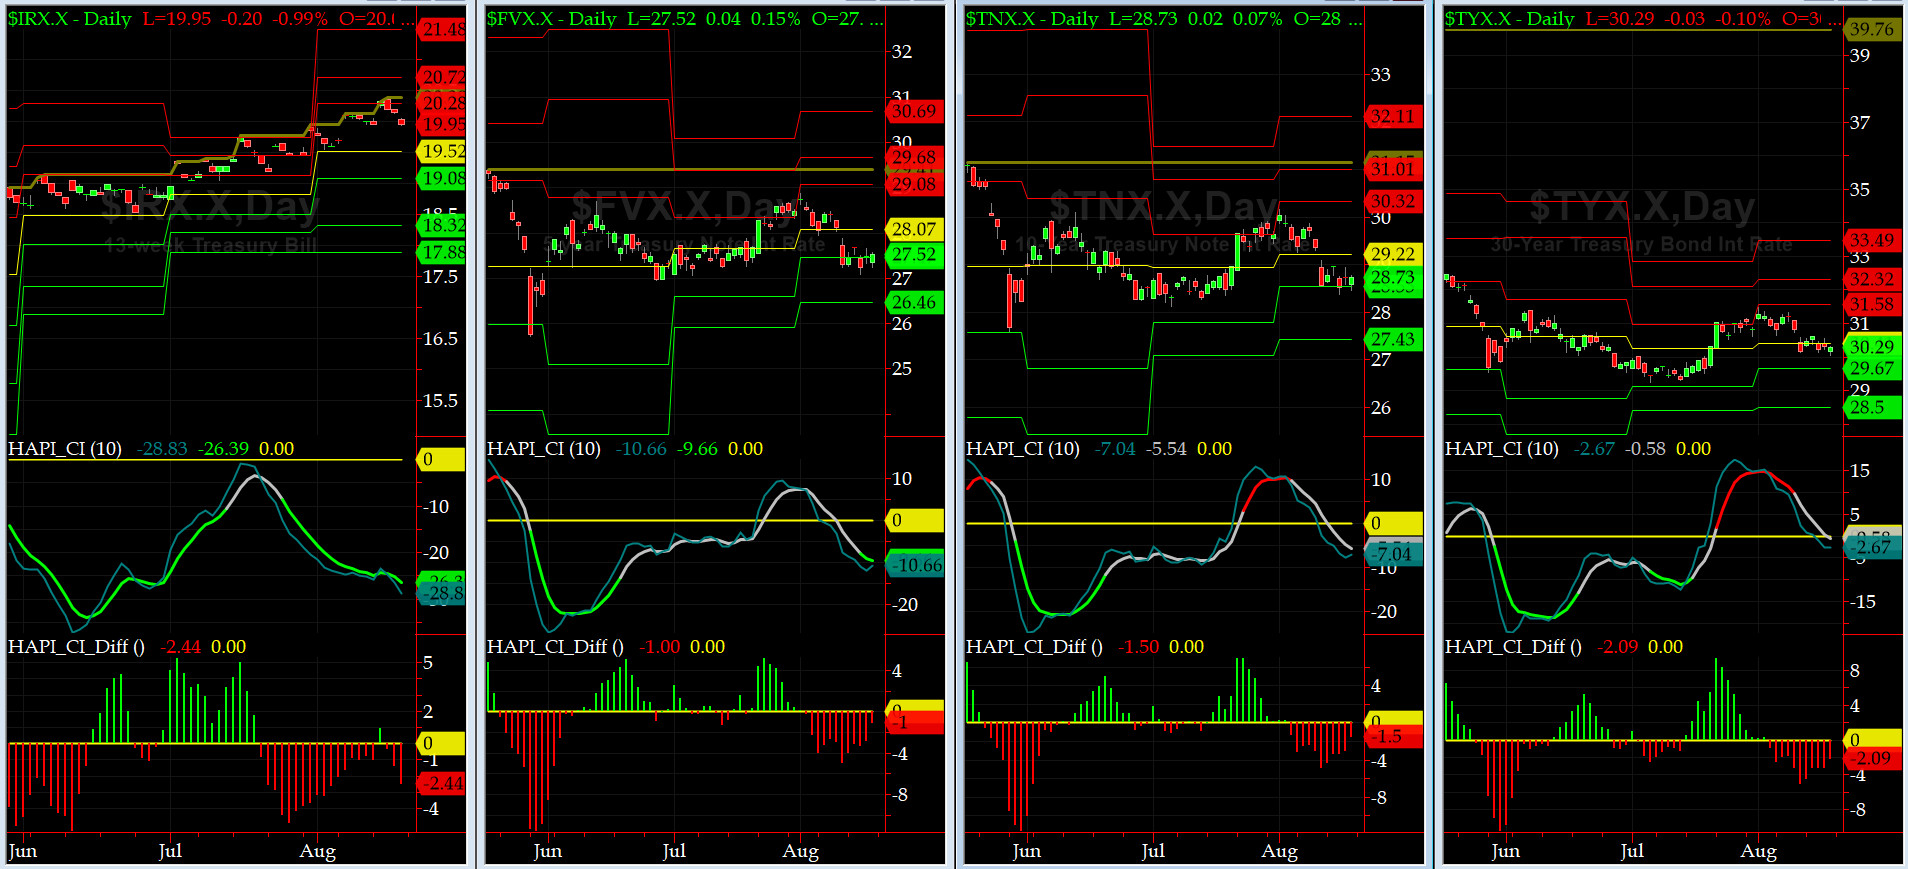
US Treasury T-Notes & T-Bonds Yields Chart
During this past week, the YTMs for the Notes & Bonds, had another very quiet market. No new shopping on Rodeo Dr this weekend for our beloved Maury & Mrs. Maury.
Fari Hamzei
|


 Proactive Market Timing


