|
Sunday, August 26th, 2018, 2130ET
Market Timing Charts, Analysis & Commentary for Issue #255
Timer Charts of S&P-500 Cash Index (SPX) + NASDAQ-100 Cash Index (NDX)
Most recent S&P-500 Cash Index (SPX): 2874 up +24 (up +0.84%) for the week ending on Friday, August 24, 2018, which closed about its +2 sigma.
DJIA ALL TIME INTRADAY HIGH = 26617 (reached on Friday, January 26, 2018)
TRAN ALL TIME INTRADAY HIGH = 11475 (reached on Tuesday, August 21, 2018)
SPX ALL TIME INTRADAY HIGH = 2874 (reached on Friday, August 24, 2018)
NDX ALL TIME INTRADAY HIGH = 7511 (reached on Wednesday, July 25, 2018)
RUT ALL TIME INTRADAY HIGH = 1727 (reached on Tuesday, August 24, 2018)
Current DAILY +2 Sigma SPX = 2880 with WEEKLY +2 Sigma = 2888
Current DAILY 0 Sigma SPX = 2842 with WEEKLY 0 Sigma = 2758
Current DAILY -2 Sigma SPX = 2803 with WEEKLY -2 Sigma = 2629
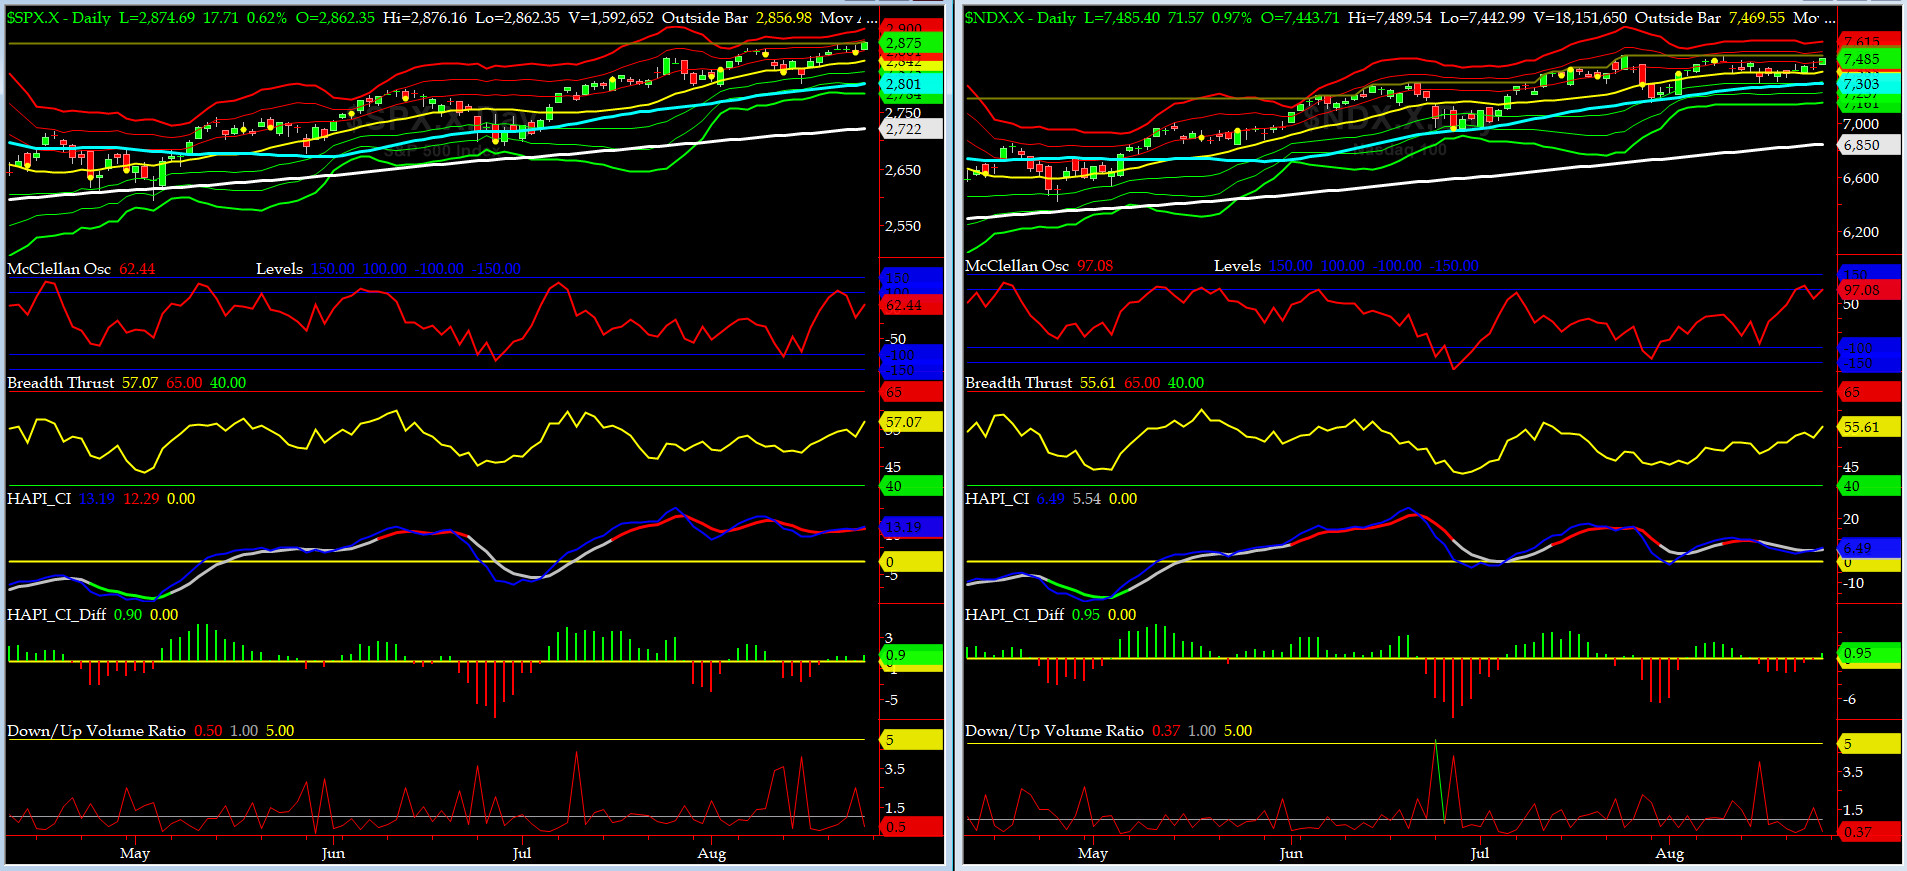
NYSE McClellan Oscillator = +62 (-150 is start of the O/S area; around -275 to -300 area or lower, we go into the �launch-pad� mode; over +150, we are in O/B area)
NYSE Breadth Thrust = 57.1 (40 is considered as oversold and 65 as overbought)
SPX, TAN & RUT made new ATHs this past week. NDX and then DJIA should be next.
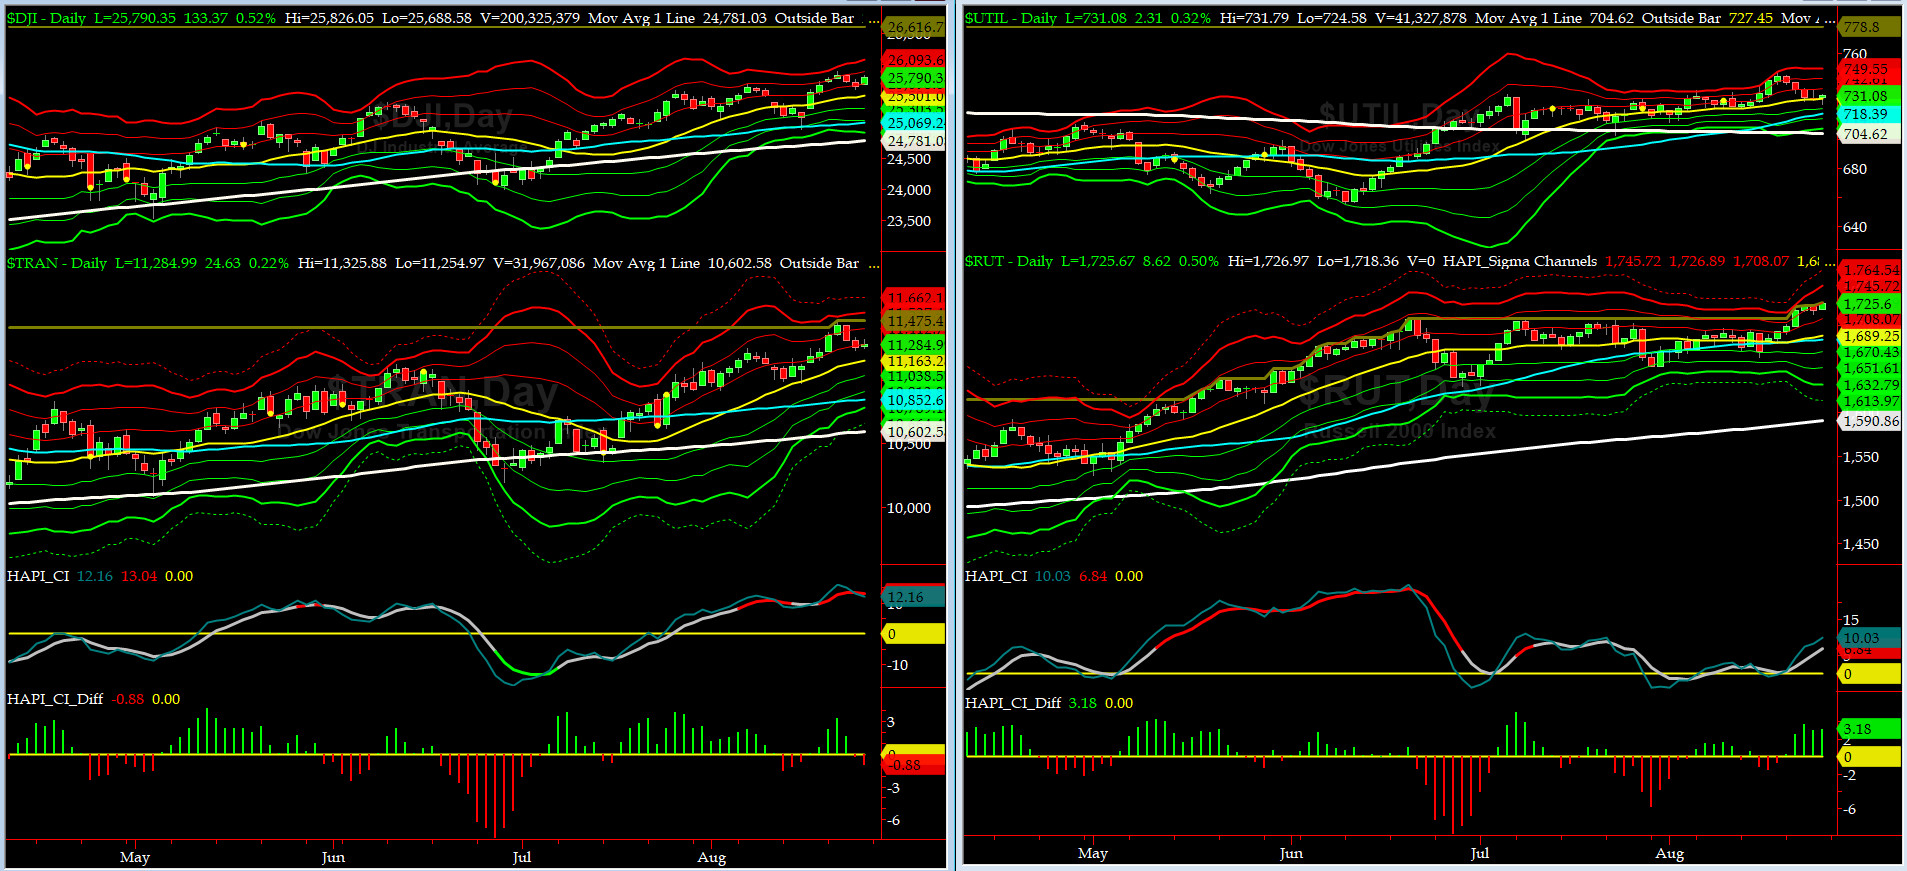
Canaries [in the Coal Mine] Chart for DJ TRAN & RUT Indices
200-Day MA DJ TRAN = 10,602 or 6.4% below DJ TRAN (max observed in last 7 yrs = 20.2%, min = -20.3%)
200-Day MA RUT = 1590 or 8.5% below RUT (max observed in last 7 yrs = 21.3%, min = -22.6%)
DJ Transportation Index (proxy for economic conditions 6 to 9 months hence) finally made a new high on Tuesday but sold for the rest of the week.
Russell 2000 Small Caps Index (proxy for Risk ON/OFF) also made a new ATH 4 times last week (Tuesday onward) and closed near 1726. RISK is ON big time.
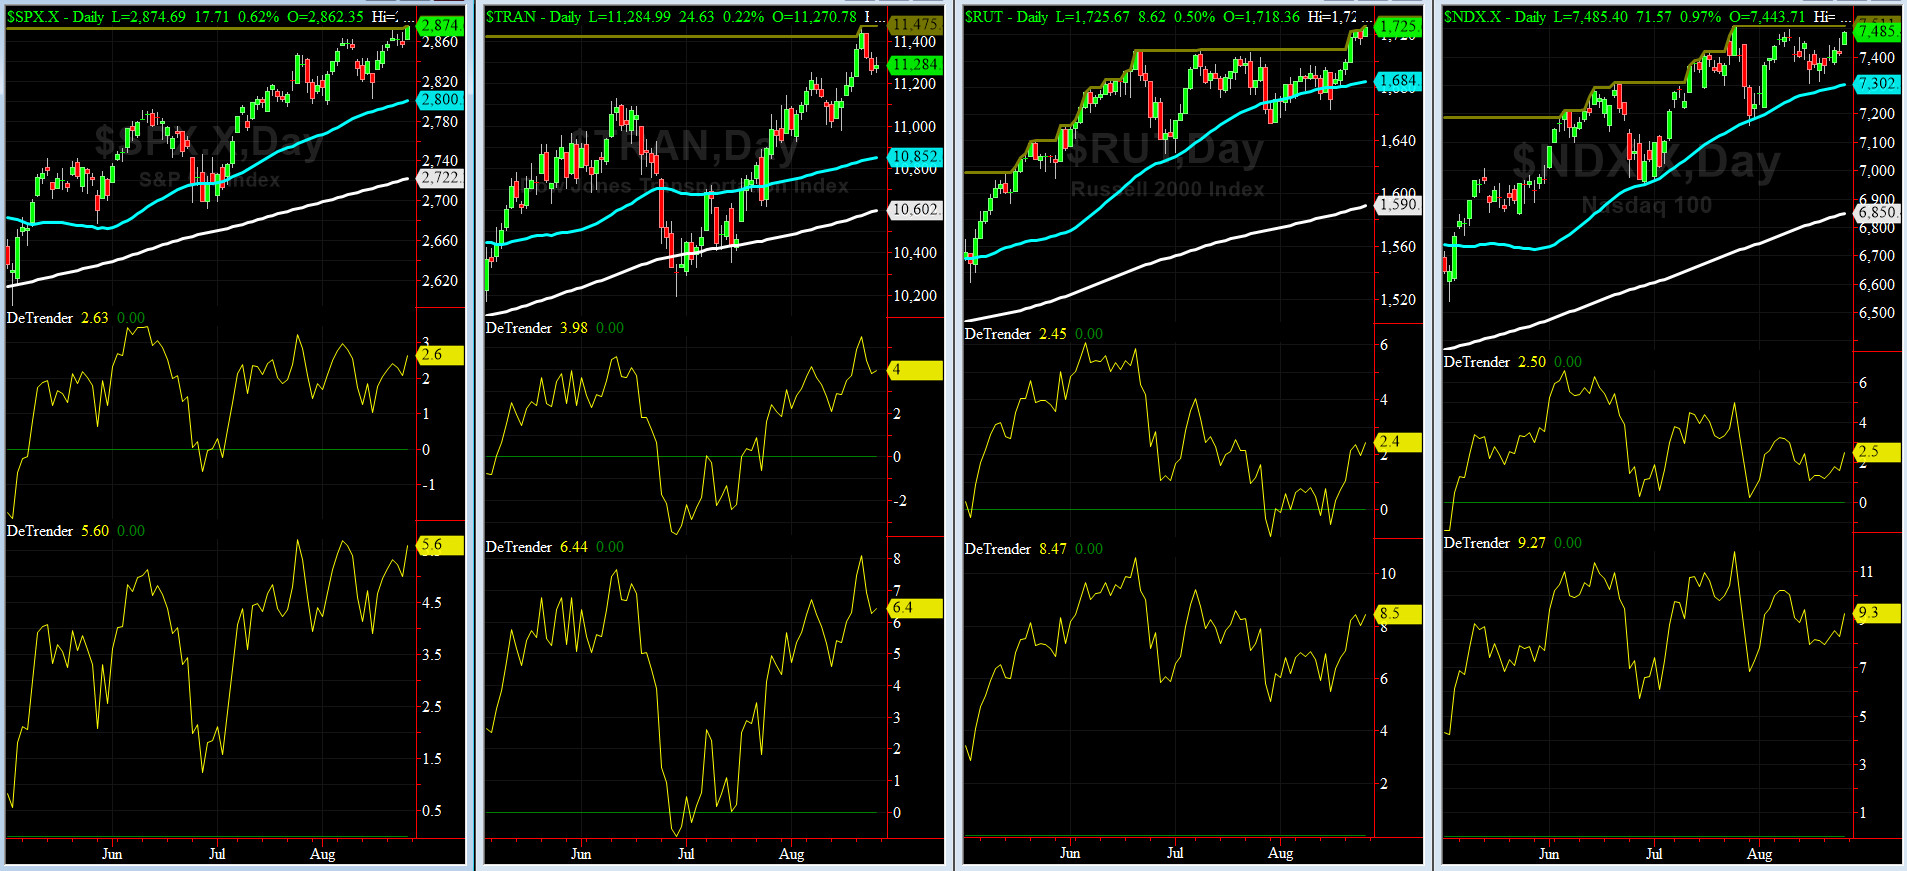
DeTrenders Charts for SPX, NDX, TRAN & RUT Indices
50-Day MA SPX = 2800 or 2.6% below SPX (max observed in last 7 yrs = +8.6%, min = -9.3%)
200-Day MA SPX = 2722 or 5.6% below SPX (max observed in last 7 yrs = 15.2%, min = -14%)
ALL of our EIGHT DeTrenders are in POSITIVE territory. The DeTrenders for DJ Tran & RUT will continue to be harbingers of future price behavior in broad indices.
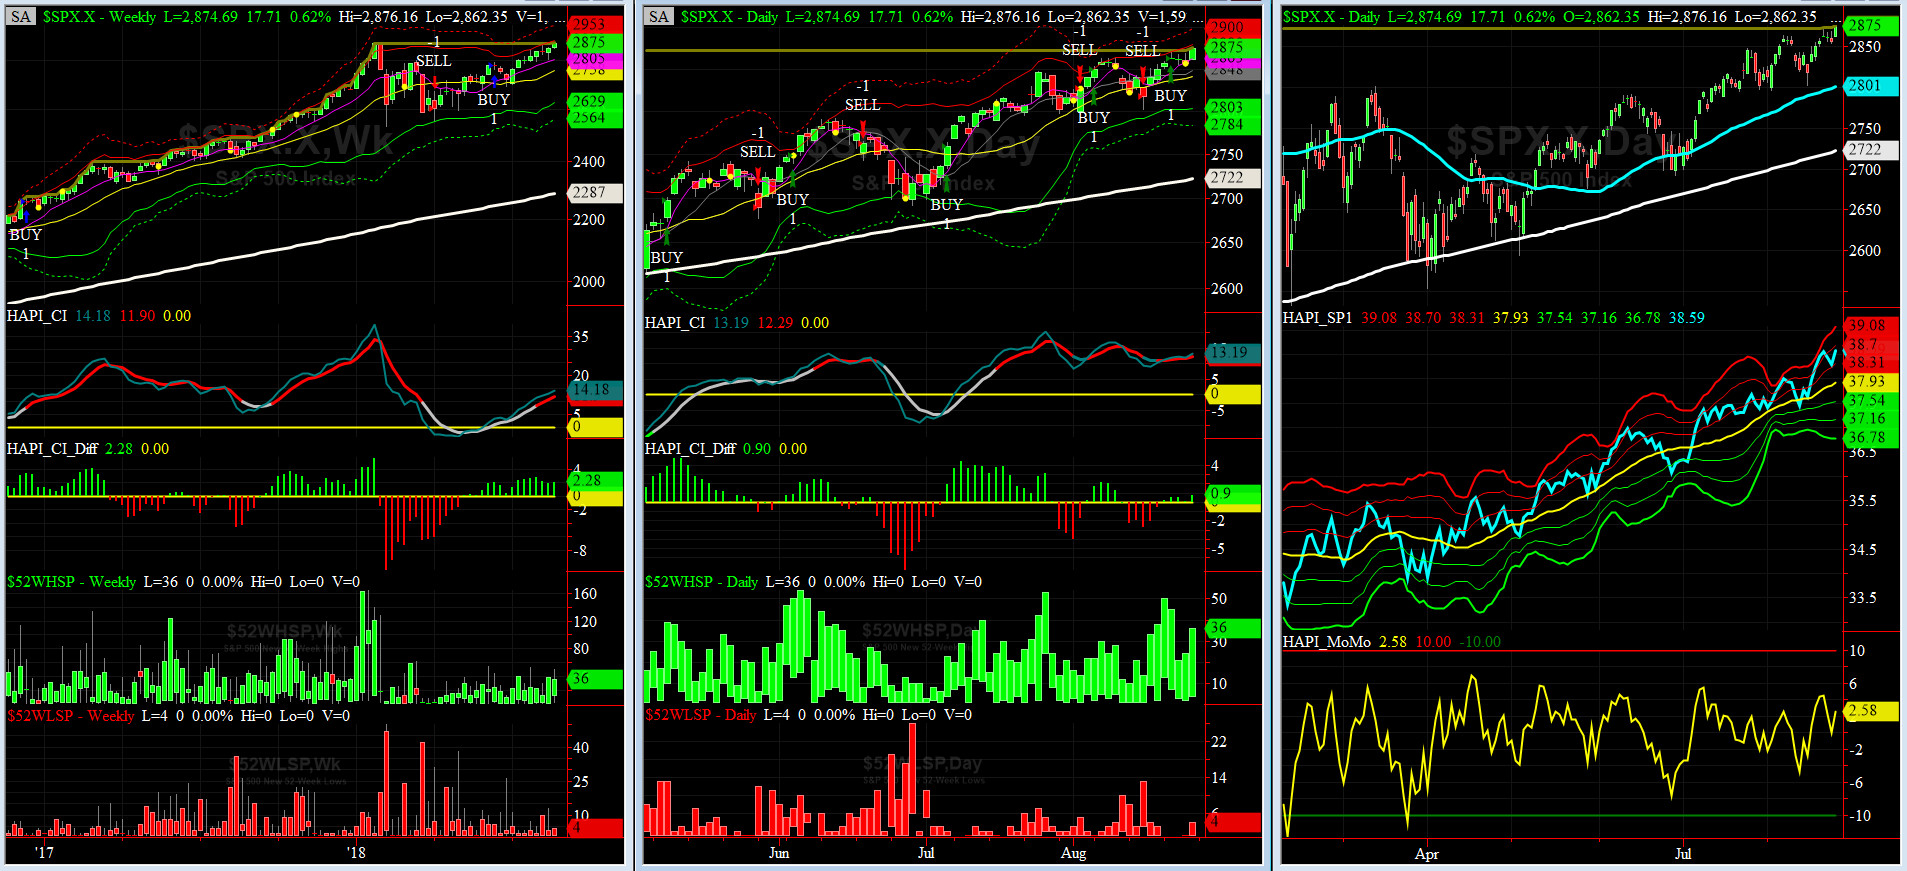
HA_SP1_Momo Chart
WEEKLY Timing Model = on a BUY Signal since Friday, June 15, 2018 CLOSE at 2779
DAILY Timing Model = on a BUY Signal since Tuesday, August 21, 2018 CLOSE at 2863
Max SPX 52wk-highs reading last week = 50 (over 120-140, the local maxima is in)
Max SPX 52wk-Lows reading last week = 4 (over 40-60, the local minima is in)
HA_SP1 closed just below its +2 sigma channels
HA_Momo = +2.6 (reversals most likely occur above +10 or below -10)
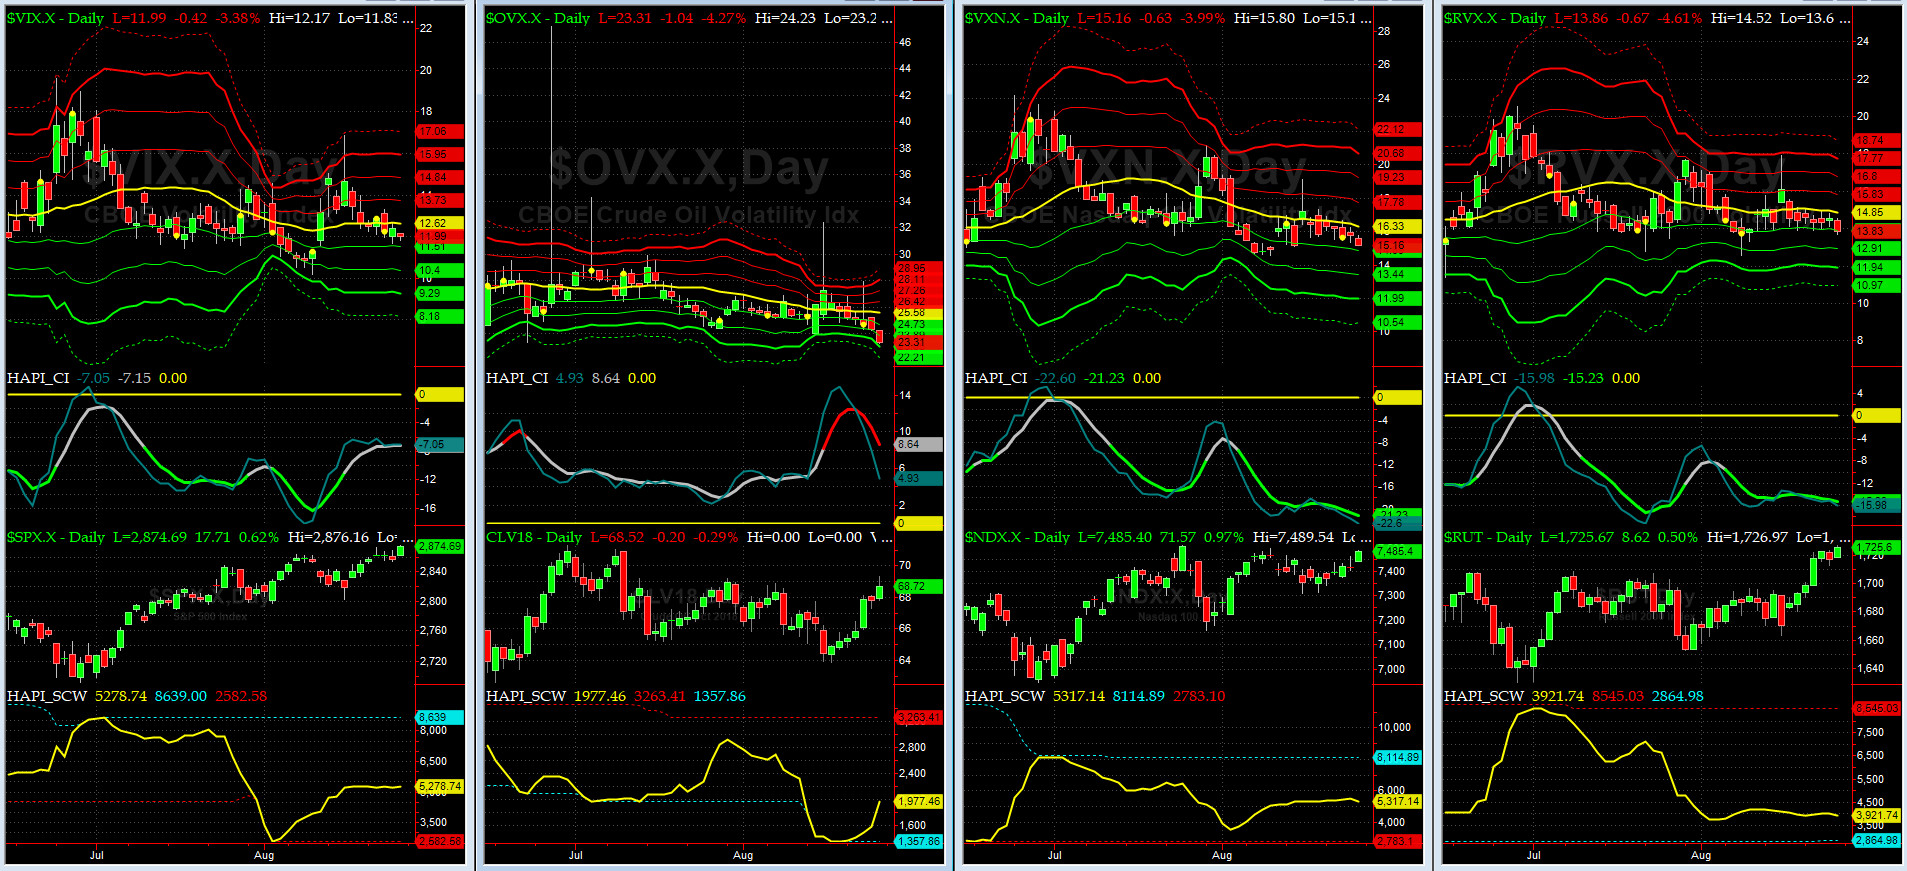
Vol of the Vols Chart
Spot VIX currently stands at 11.99, right about its -0.5 sigma (remember it's the VIX volatility pattern aka "its sigma channels" that matters, and not the level of VIX itself (this is per Dr. Robert Whaley, a great mentor and inventor of original VIX, now called VXO). VIX usually peaks around a test of its +4 sigma).
VIX was uber quiet this past week.
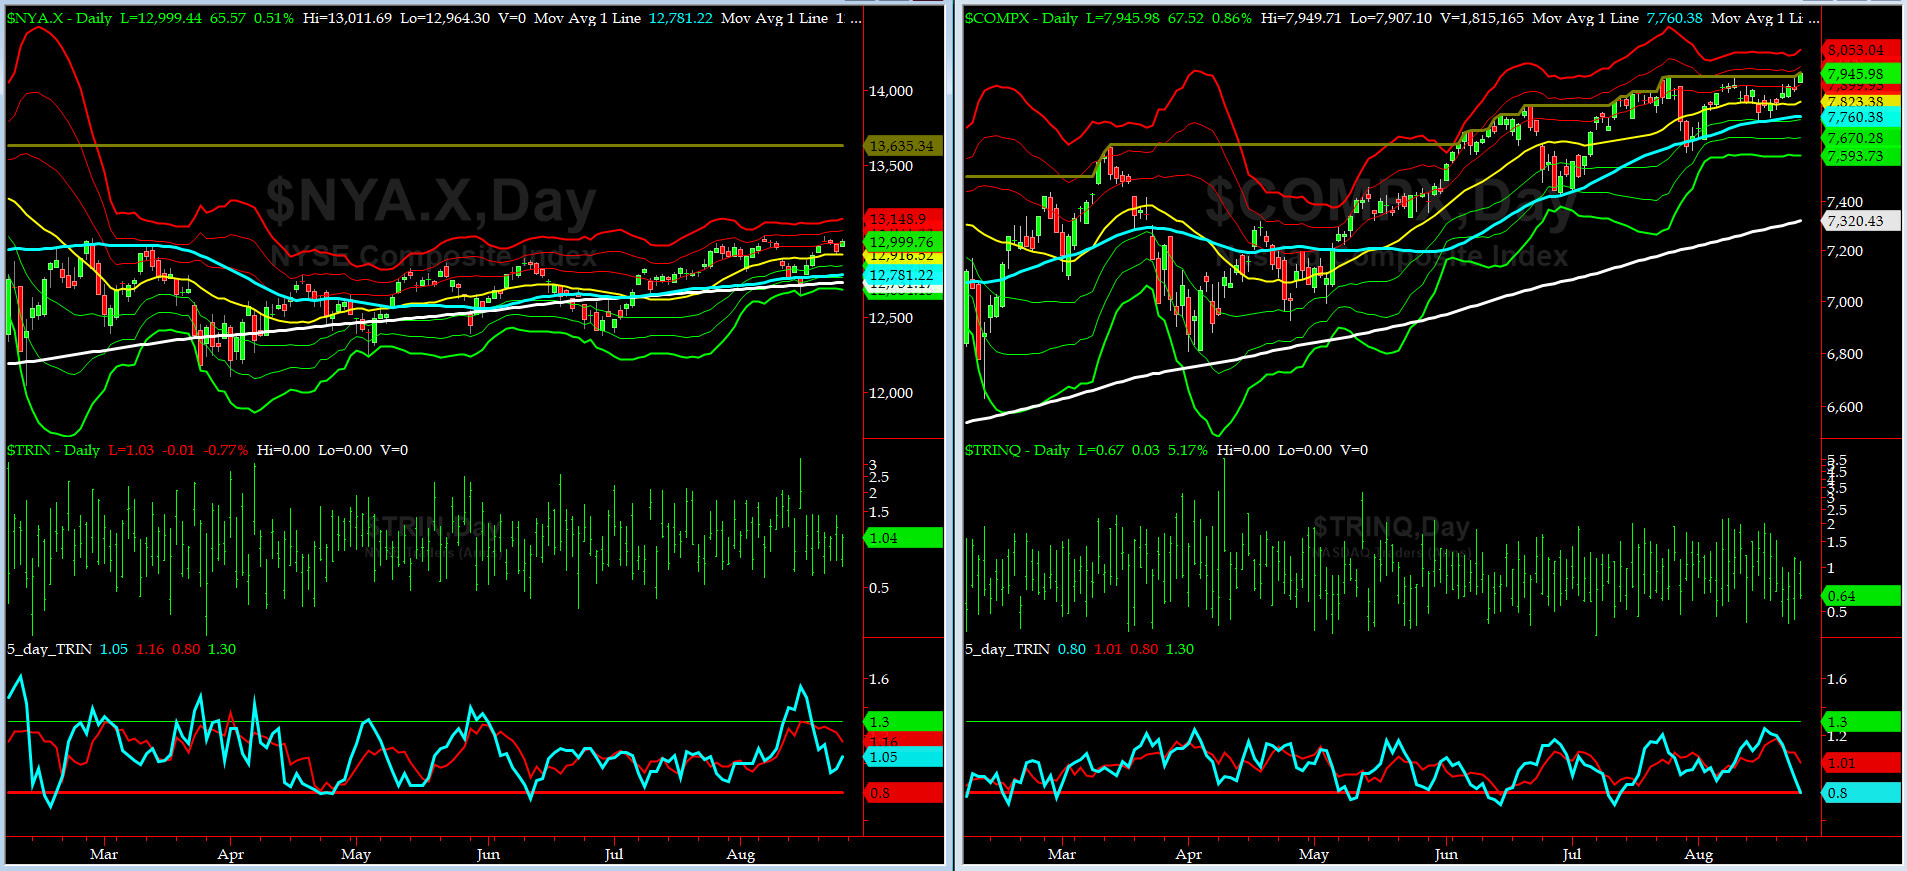
5-day TRIN & TRINQ Charts
NYSE 5-day TRIN is in NEUTRAL zone while NASDAQ is in the SELL zone.
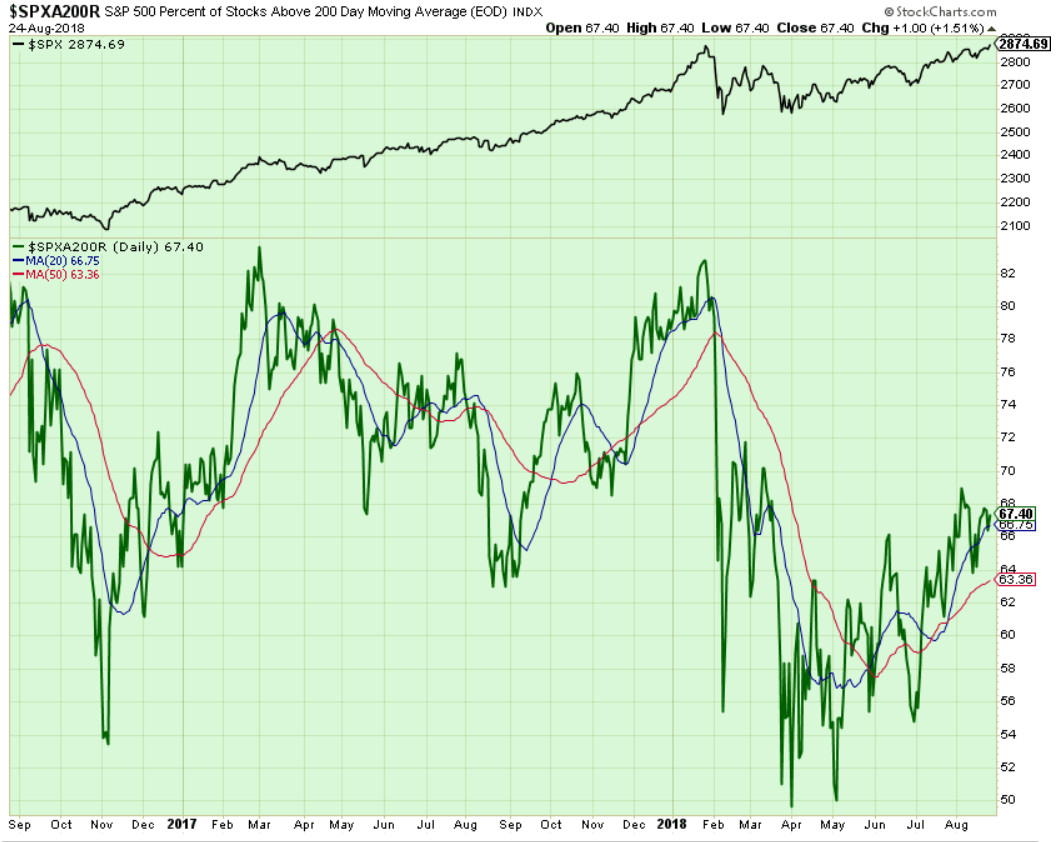
Components of SPX above their respective 200day MA Chart
This scoring indicator faltered down to 67% while SPX has made a new ATH, first in last 7 months. This is bearish divergence, but normally it takes many divergences to move the market lower.... so stay tuned.
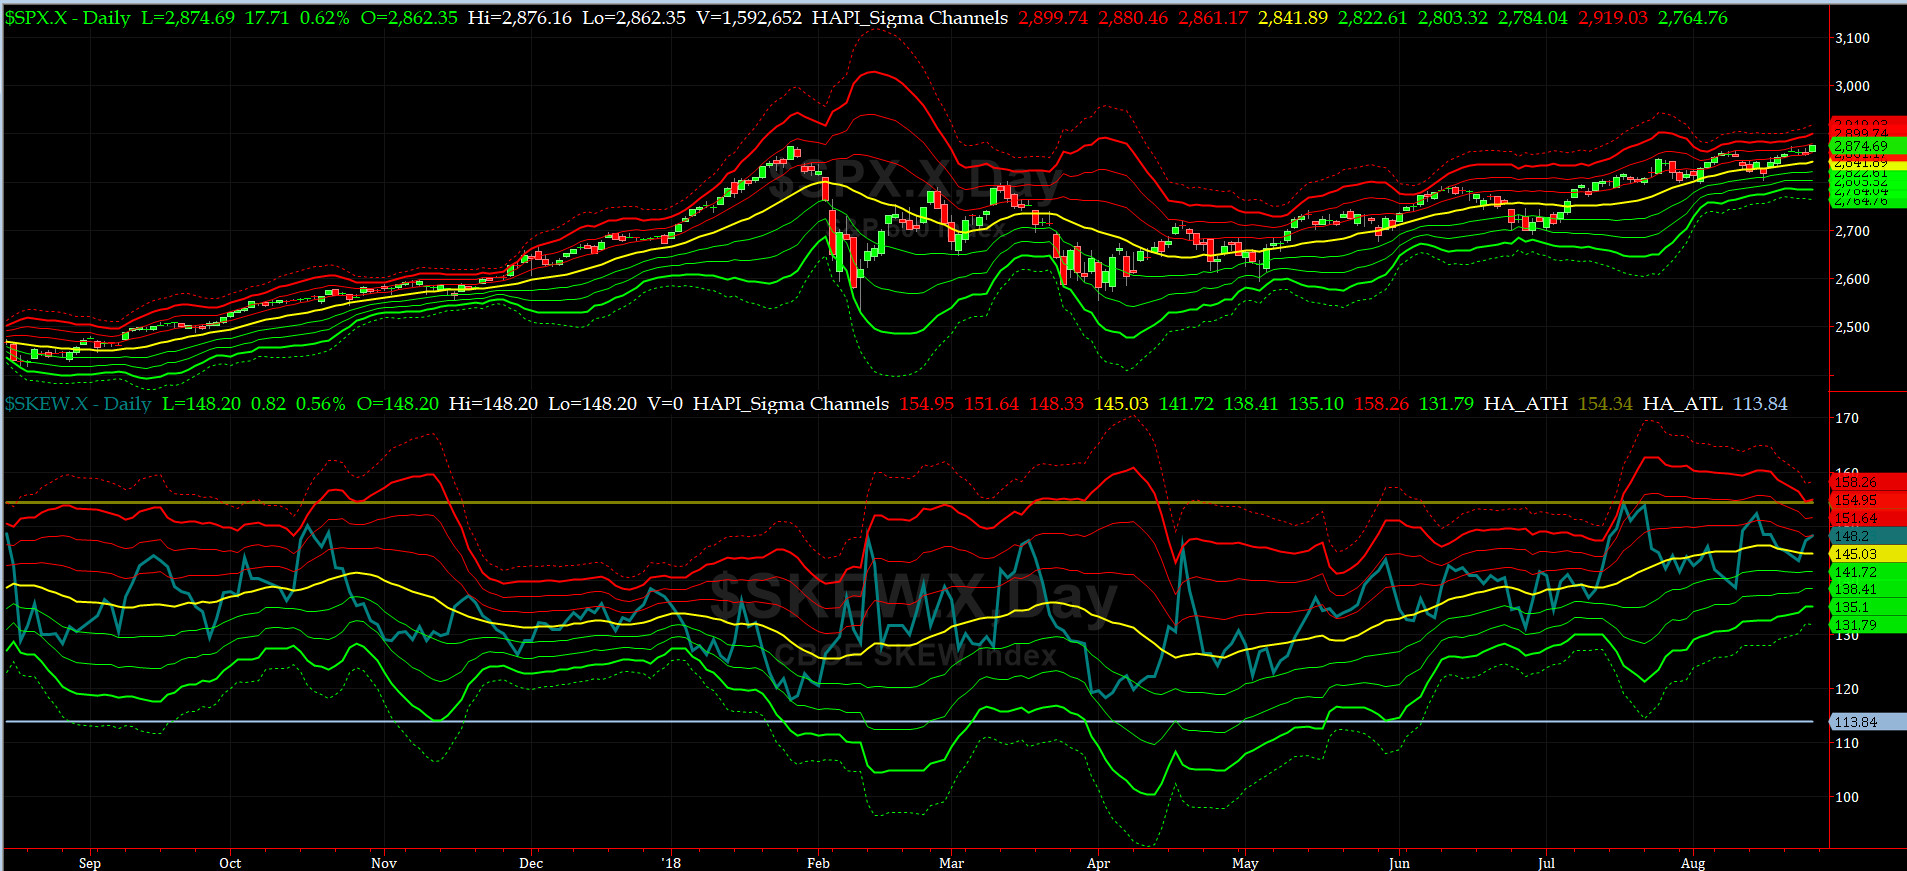
SPX SKEW (Tail Risk) Chart
On Friday, SPX SKEW (Tail Risk) closed near 148, right about its +1 sigma (normal = 120-125, range 100-150).
Is all quiet on the Eastern & Mid-Western Fronts? Our beloved @Capt_Tiko still says "maybe."
How to interpret the value of SPX SKEW? (from CBOE white paper on SKEW)

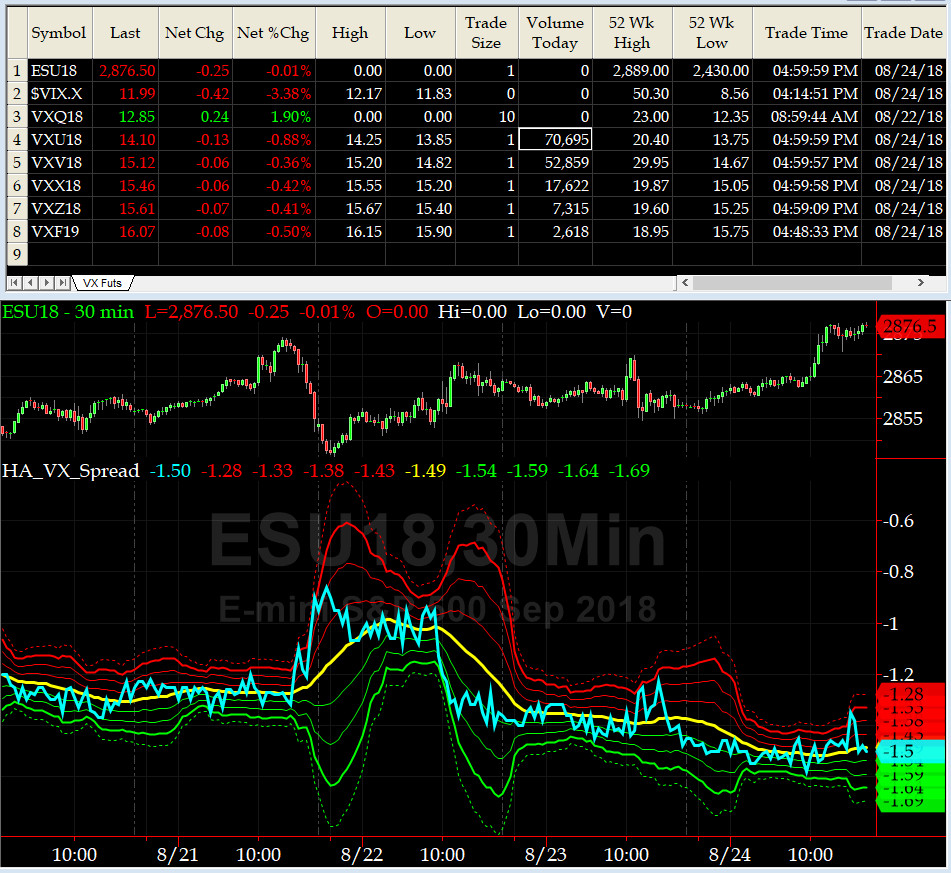
3-month VIX Futures Spread(VX) Chart
This popular timing indicator, (long Sep, & short Deez VIX Futures) is at -1.5. This reading is NEUTRAL.
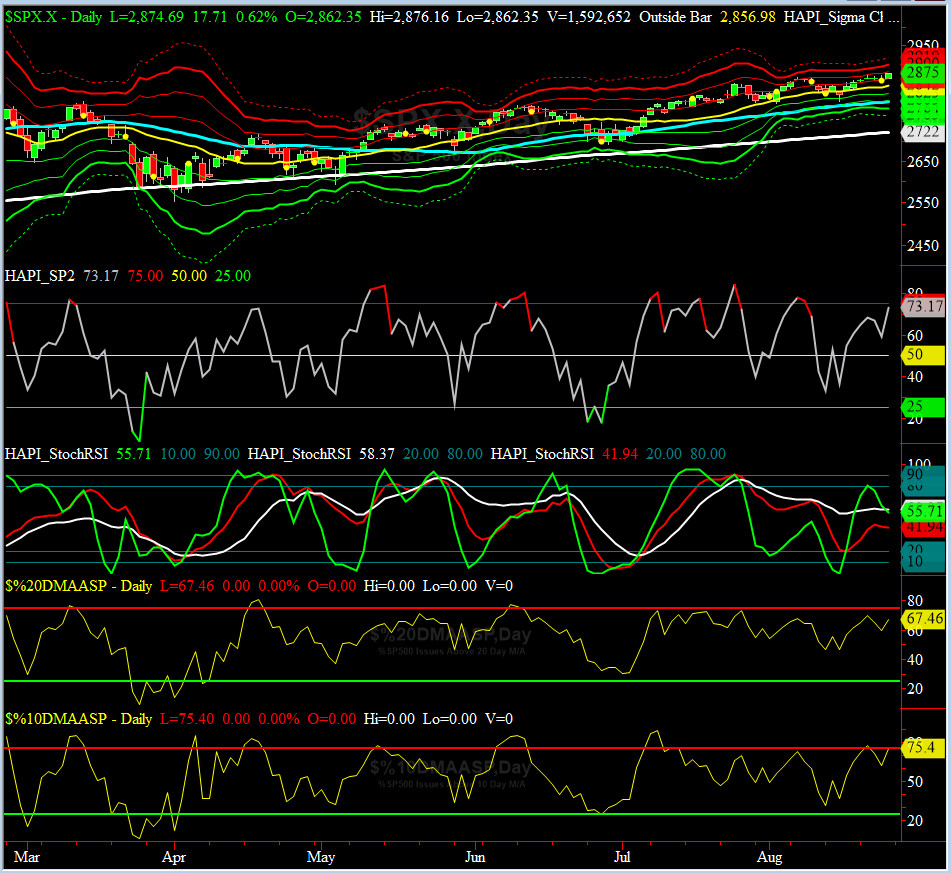
HA_SP2 Chart
HA_SP2 = 73 (Buy signal <= 25, Sell Signal >= 75)
Our coveted SP2 prop indicator rallied on Friday to near overbought after meandering for most of the week.
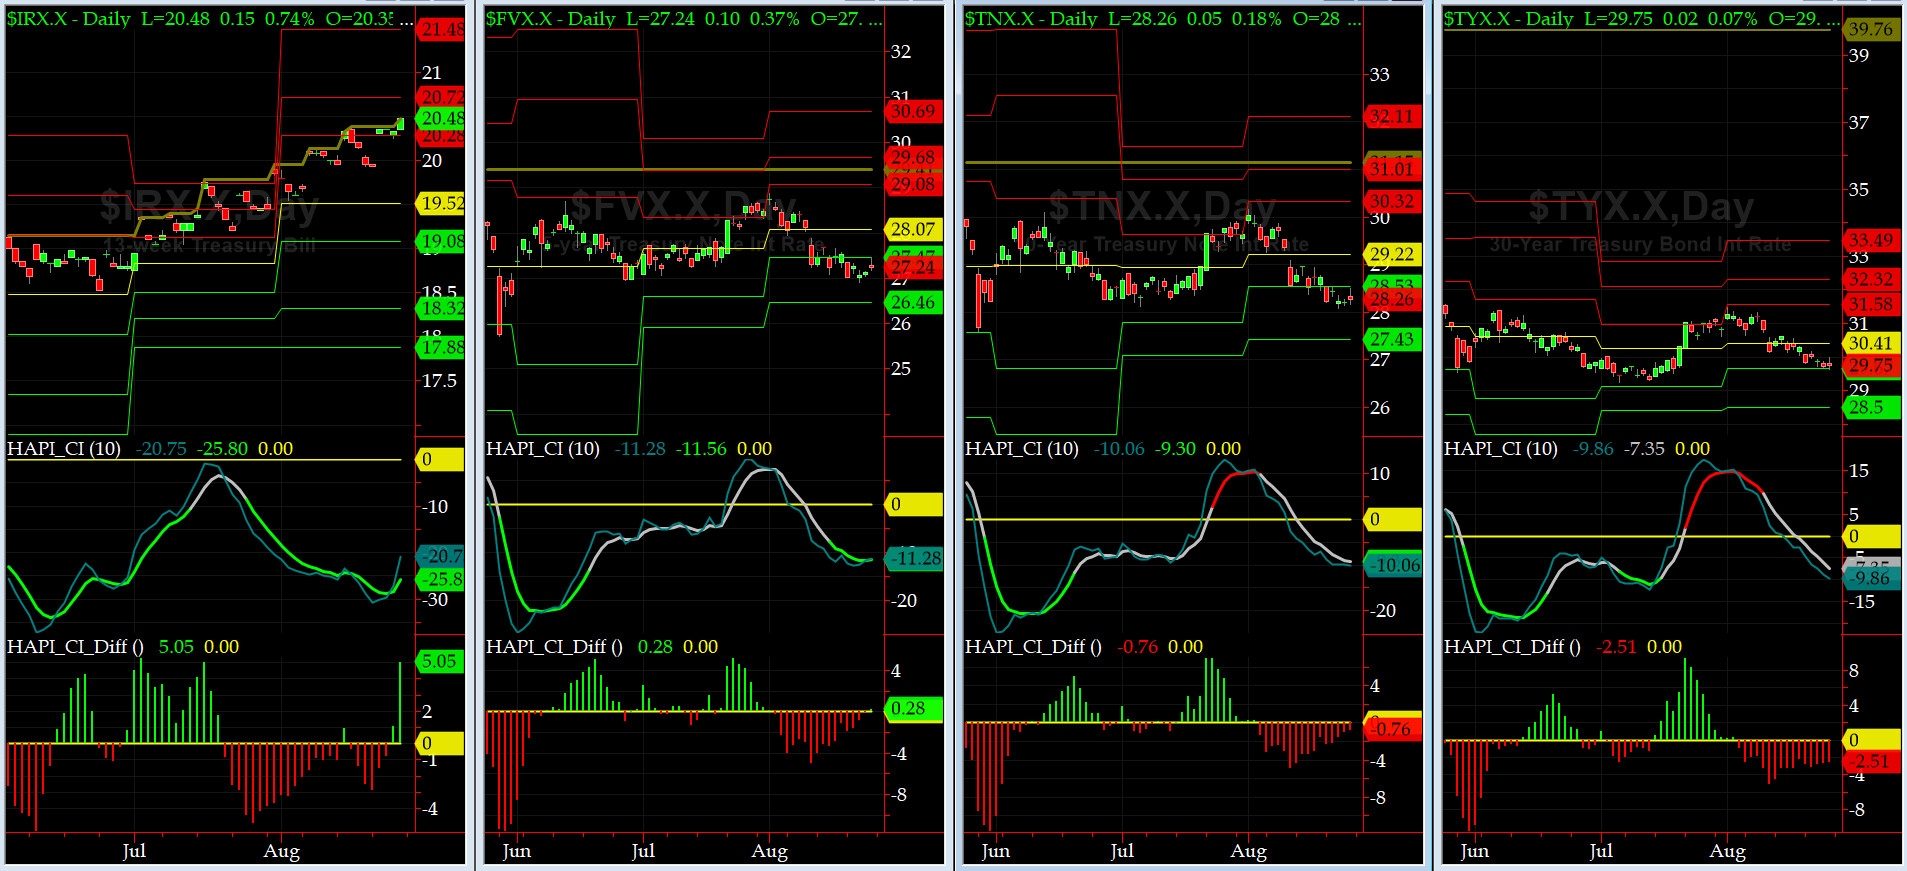
US Treasury T-Notes & T-Bonds Yields Chart
During this past week, the YTMs for the Notes & Bonds, ticked down a tad in an otherwise quiet market while the front end ticked up on Fed Chair Powell comments from Jackson Hole Retreat.
Fari Hamzei
|


 Proactive Market Timing


