|
Saturday, September 8th, 2018, 1800ET
Market Timing Charts, Analysis & Commentary for Issue #257
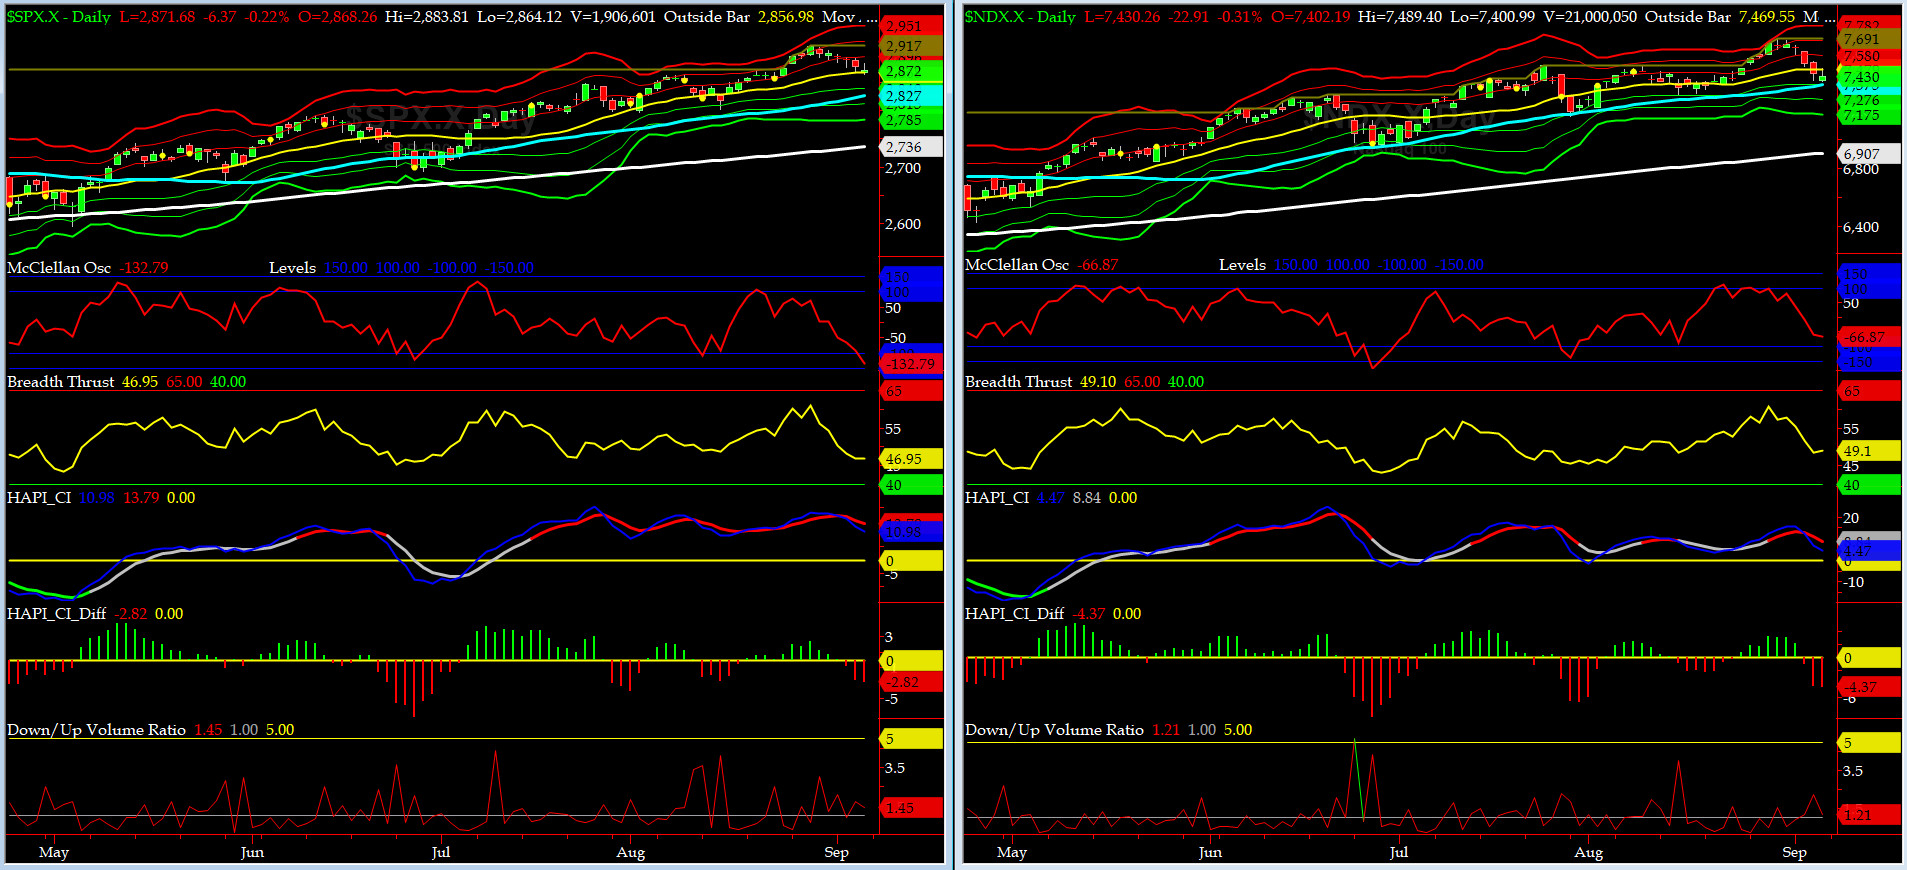
Timer Charts of S&P-500 Cash Index (SPX) + NASDAQ-100 Cash Index (NDX)
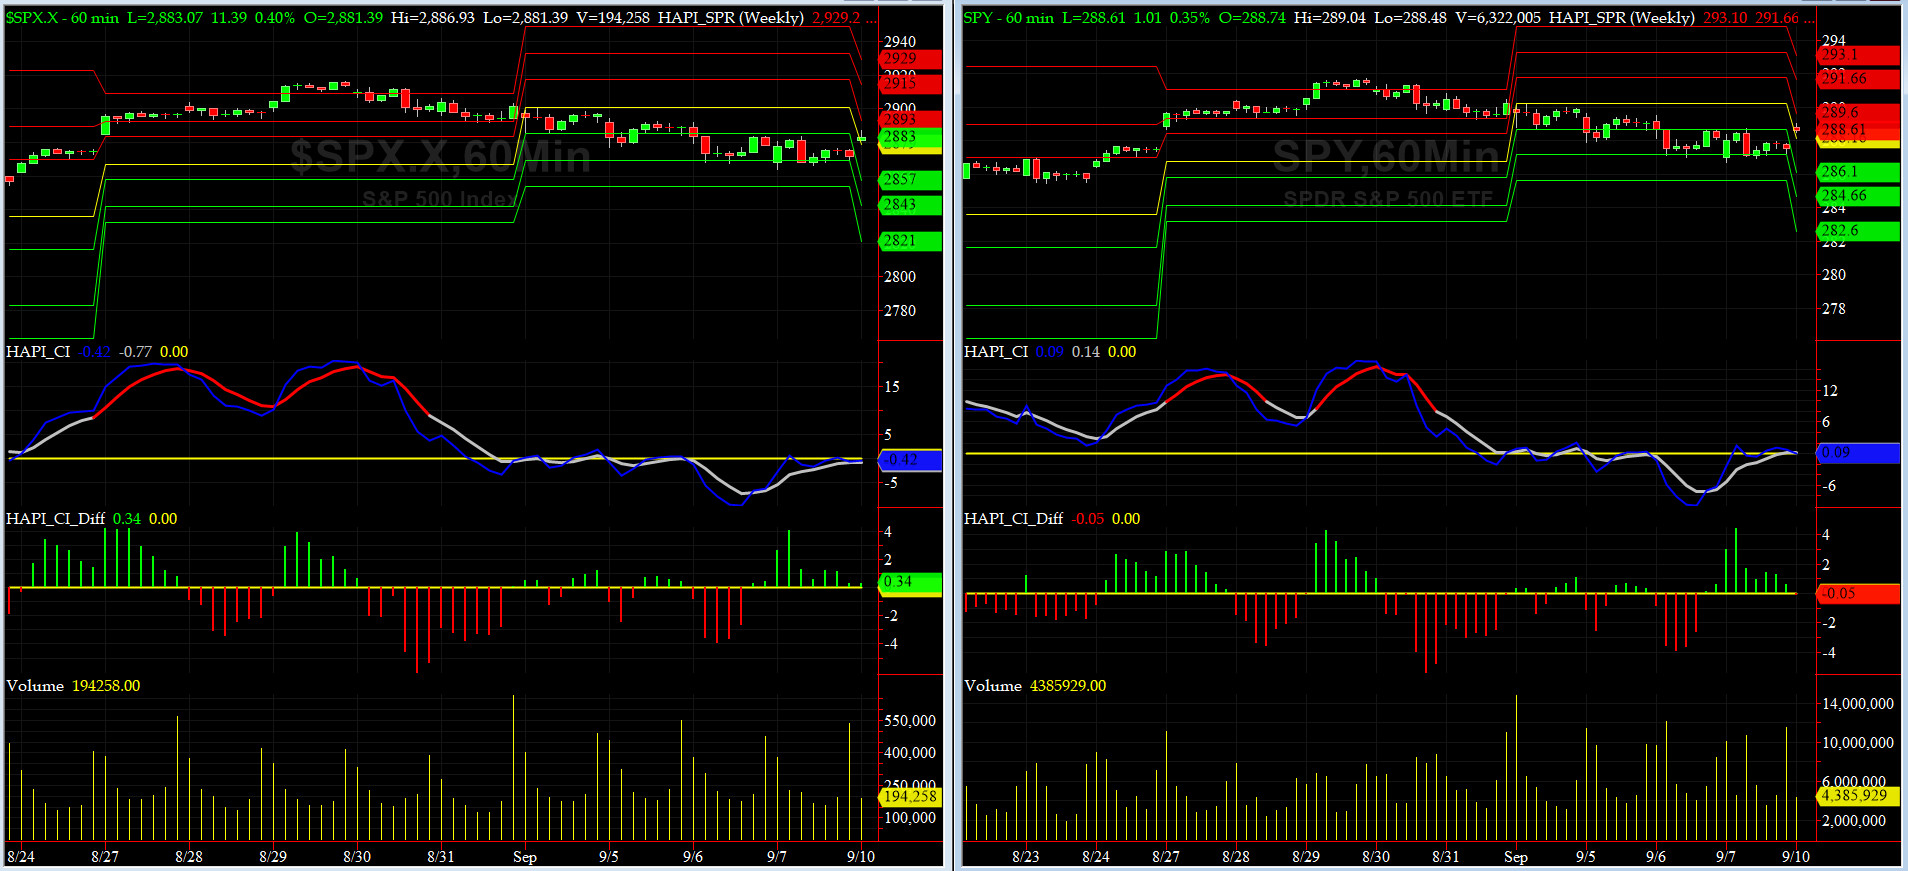
Most recent S&P-500 Cash Index (SPX): 2872 down -30 (down -1%) for the week ending on Friday, September 7, 2018, which closed about its zero sigma.
DJIA ALL TIME INTRADAY HIGH = 26617 (reached on Friday, January 26, 2018)
TRAN ALL TIME INTRADAY HIGH = 11475 (reached on Tuesday, August 28, 2018)
SPX ALL TIME INTRADAY HIGH = 2916 (reached on Wednesday, August 29, 2018)
NDX ALL TIME INTRADAY HIGH = 7691 (reached on Thursday, August 30, 2018)
RUT ALL TIME INTRADAY HIGH = 1742 (reached on Friday, August 31, 2018)
Current DAILY +2 Sigma SPX = 2924 with WEEKLY +2 Sigma = 2914
Current DAILY 0 Sigma SPX = 2868 with WEEKLY 0 Sigma = 2781
Current DAILY -2 Sigma SPX = 2813 with WEEKLY -2 Sigma = 2647
NYSE McClellan Oscillator = -133 (-150 is start of the O/S area; around -275 to -300 area or lower, we go into the �launch-pad� mode; over +150, we are in O/B area)
NYSE Breadth Thrust = 46.9 (40 is considered as oversold and 65 as overbought)
First [solid] RED weekly bar for SPX in 4 weeks and 2nd RED in 10 weeks......
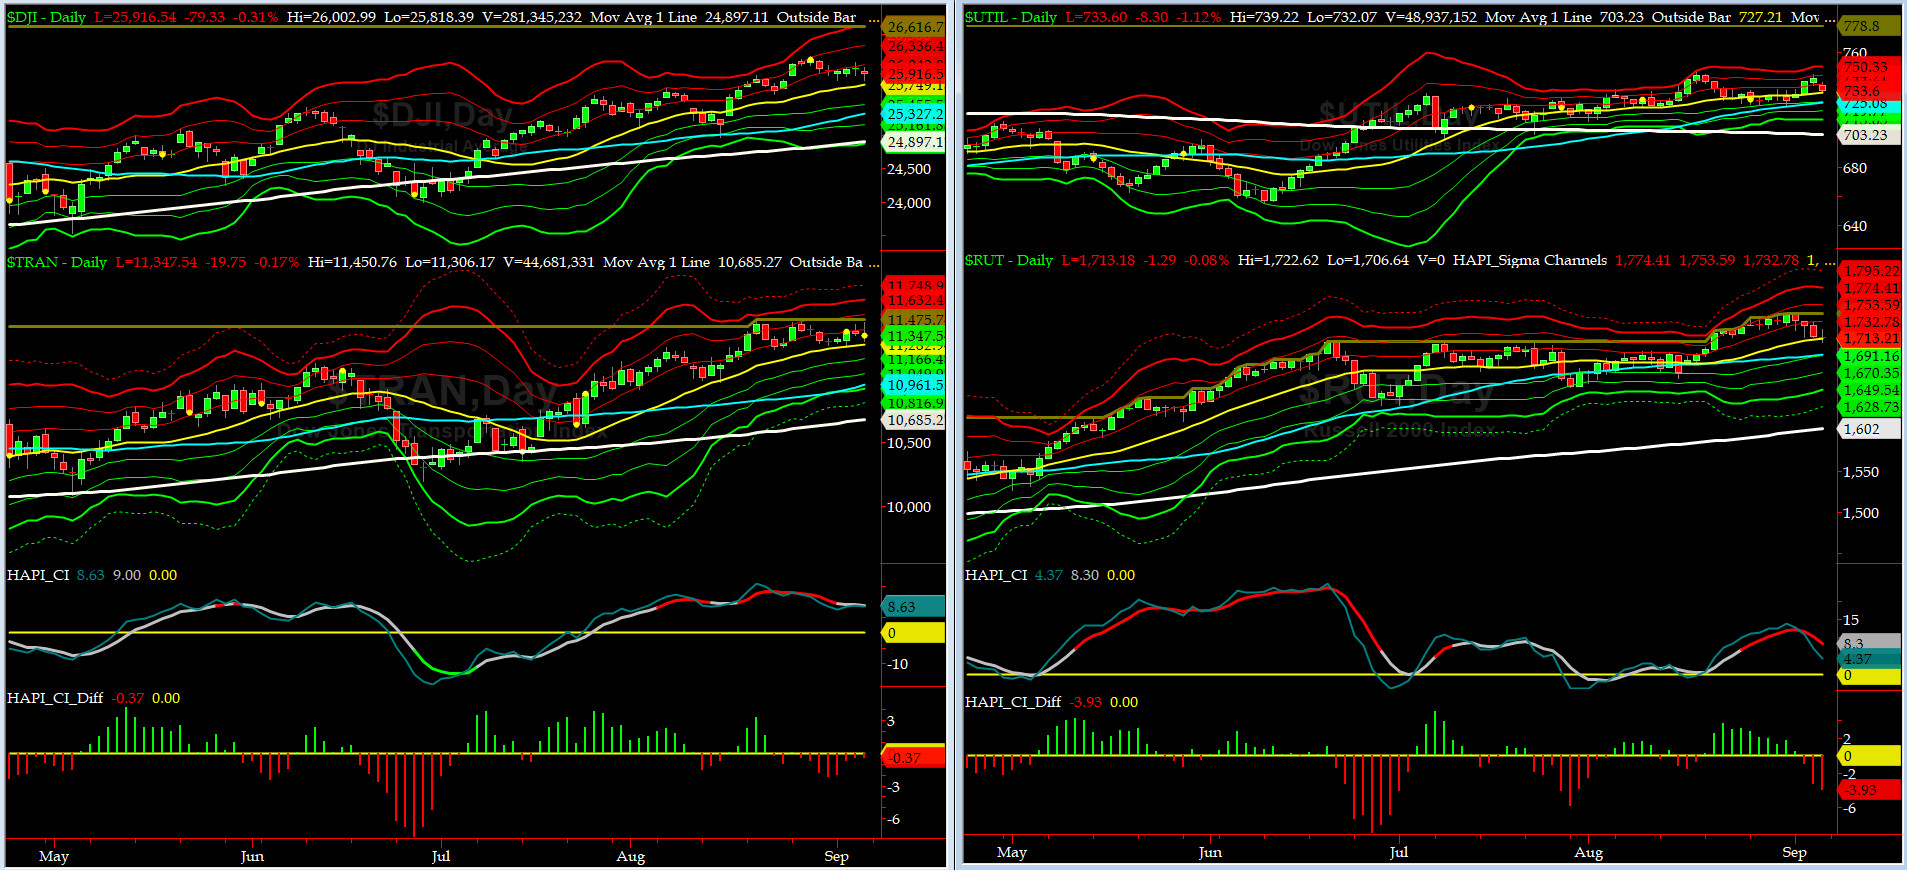
Canaries [in the Coal Mine] Chart for DJ TRAN & RUT Indices
200-Day MA DJ TRAN = 10,685 or 6.2% below DJ TRAN (max observed in last 7 yrs = 20.2%, min = -20.3%)
200-Day MA RUT = 1602 or 6.9% below RUT (max observed in last 7 yrs = 21.3%, min = -22.6%)
DJ Transportation Index (proxy for economic conditions 6 to 9 months hence) had a number of high range daily bars, but, by end of the week, ended going nowhere fast.
Russell 2000 Small Caps Index (proxy for Risk ON/OFF) sold off for most of the week, but, RISK is still ON, ioho

DeTrenders Charts for SPX, NDX, TRAN & RUT Indices
50-Day MA SPX = 2827 or 1.6% below SPX (max observed in last 7 yrs = +8.6%, min = -9.3%)
200-Day MA SPX = 2736 or 4.9% below SPX (max observed in last 7 yrs = 15.2%, min = -14%)
ALL of our EIGHT DeTrenders are in POSITIVE territory. The DeTrenders for DJ Tran & RUT will continue to be harbingers of future price behavior in broad indices.
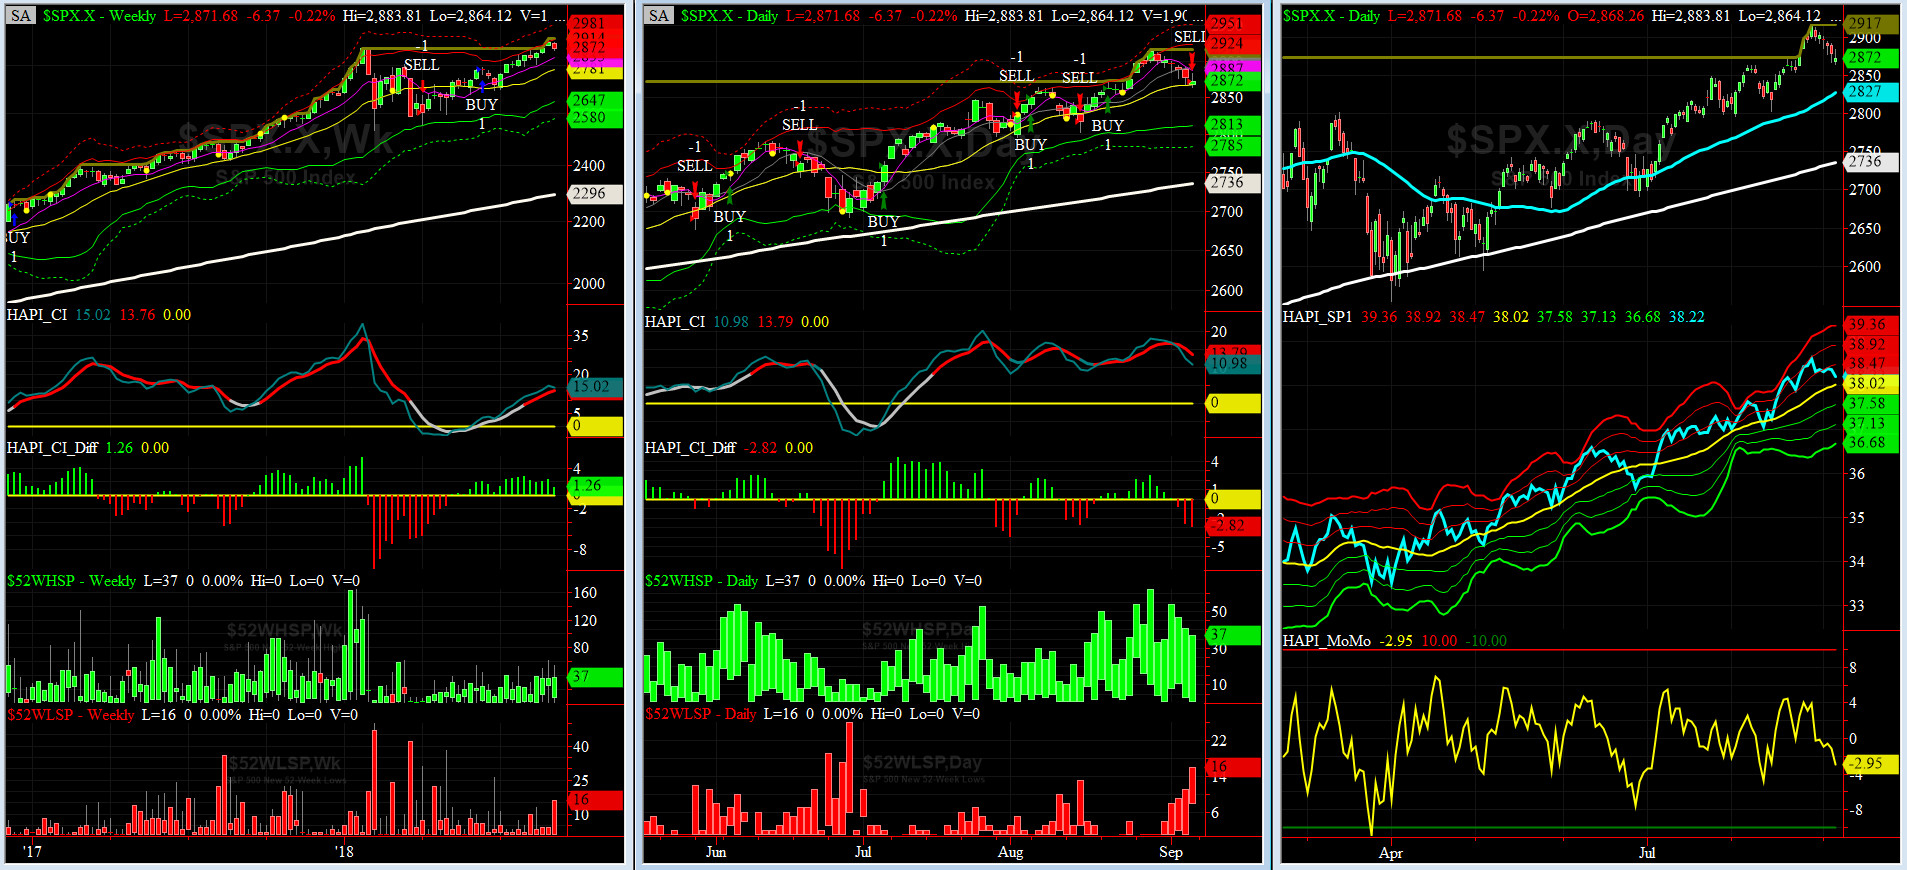
HA_SP1_Momo Chart
WEEKLY Timing Model = on a BUY Signal since Friday, June 15, 2018 CLOSE at 2779
DAILY Timing Model = on a SELL Signal since Friday, September 7, 2018 CLOSE at 2872
Max SPX 52wk-highs reading last week = 54 (over 120-140, the local maxima is in)
Max SPX 52wk-Lows reading last week = 16 (over 40-60, the local minima is in)
HA_SP1 closed just above its zero sigma channels
HA_Momo = -3 (reversals most likely occur above +10 or below -10)
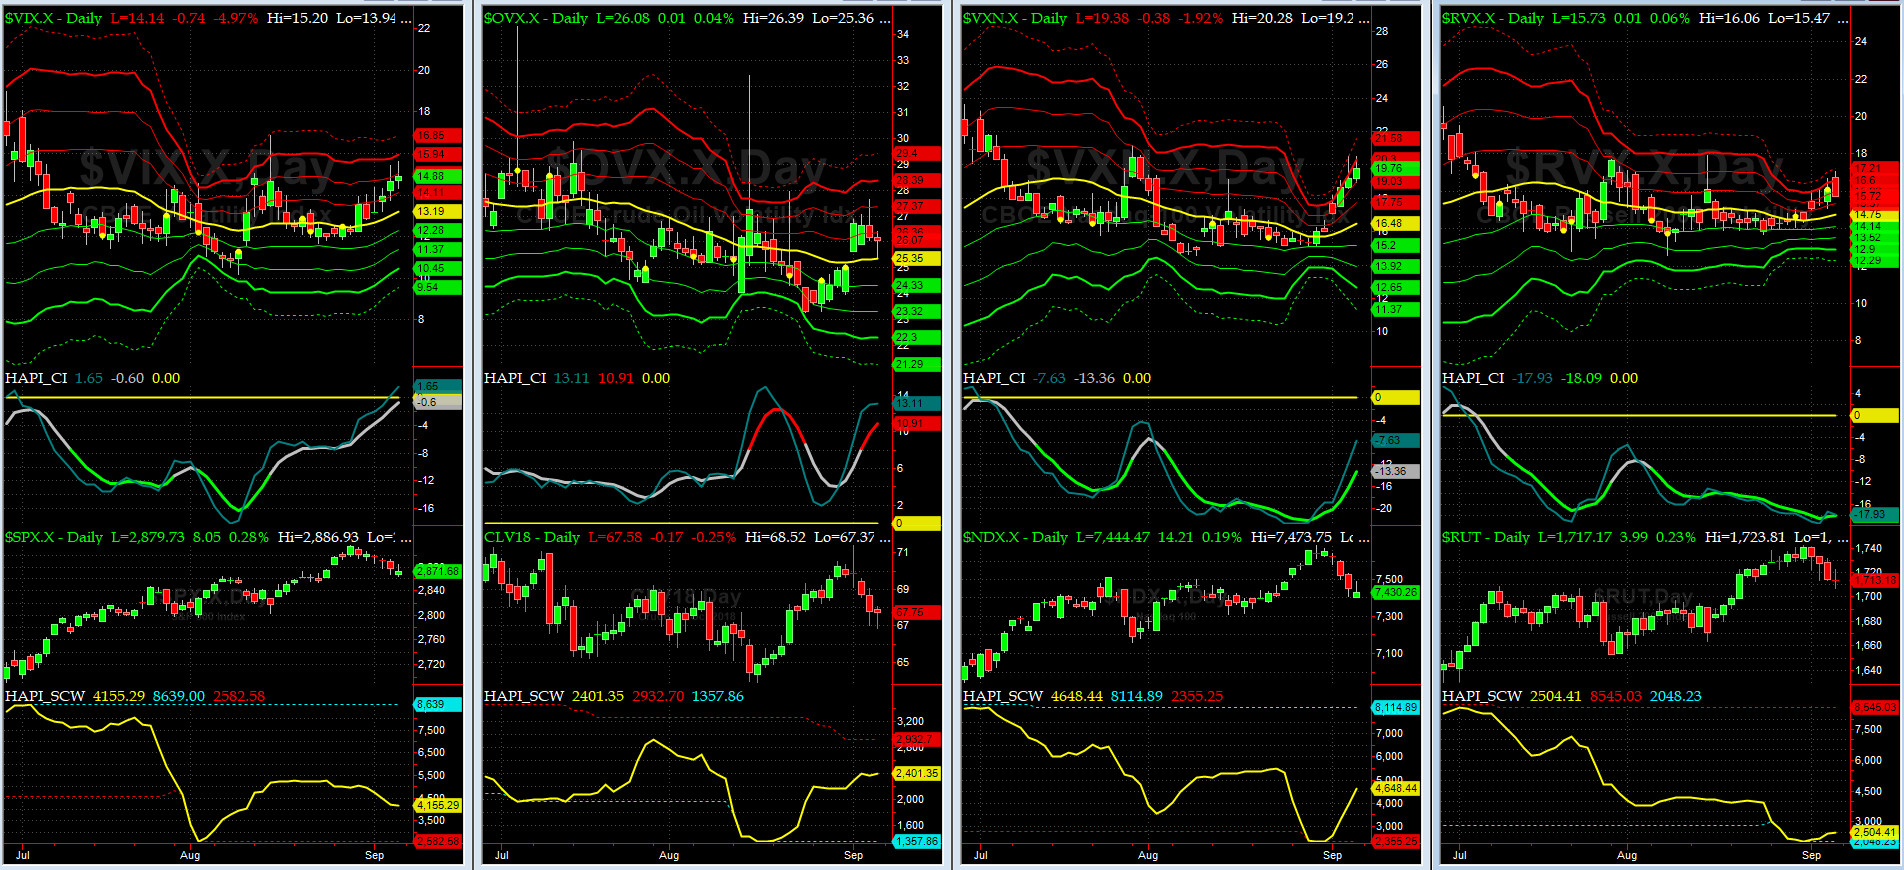
Vol of the Vols Chart
Spot VIX currently stands at 14.9, right above its +1.5 sigma (remember it's the VIX volatility pattern aka "its sigma channels" that matters, and not the level of VIX itself (this is per Dr. Robert Whaley, a great mentor and inventor of original VIX, now called VXO). VIX usually peaks around a test of its +4 sigma).
VIX has risen every day this week, but, we are yet to see contango in its VX Futures Term Structure (translation: short-term market bottom is not in, yet).
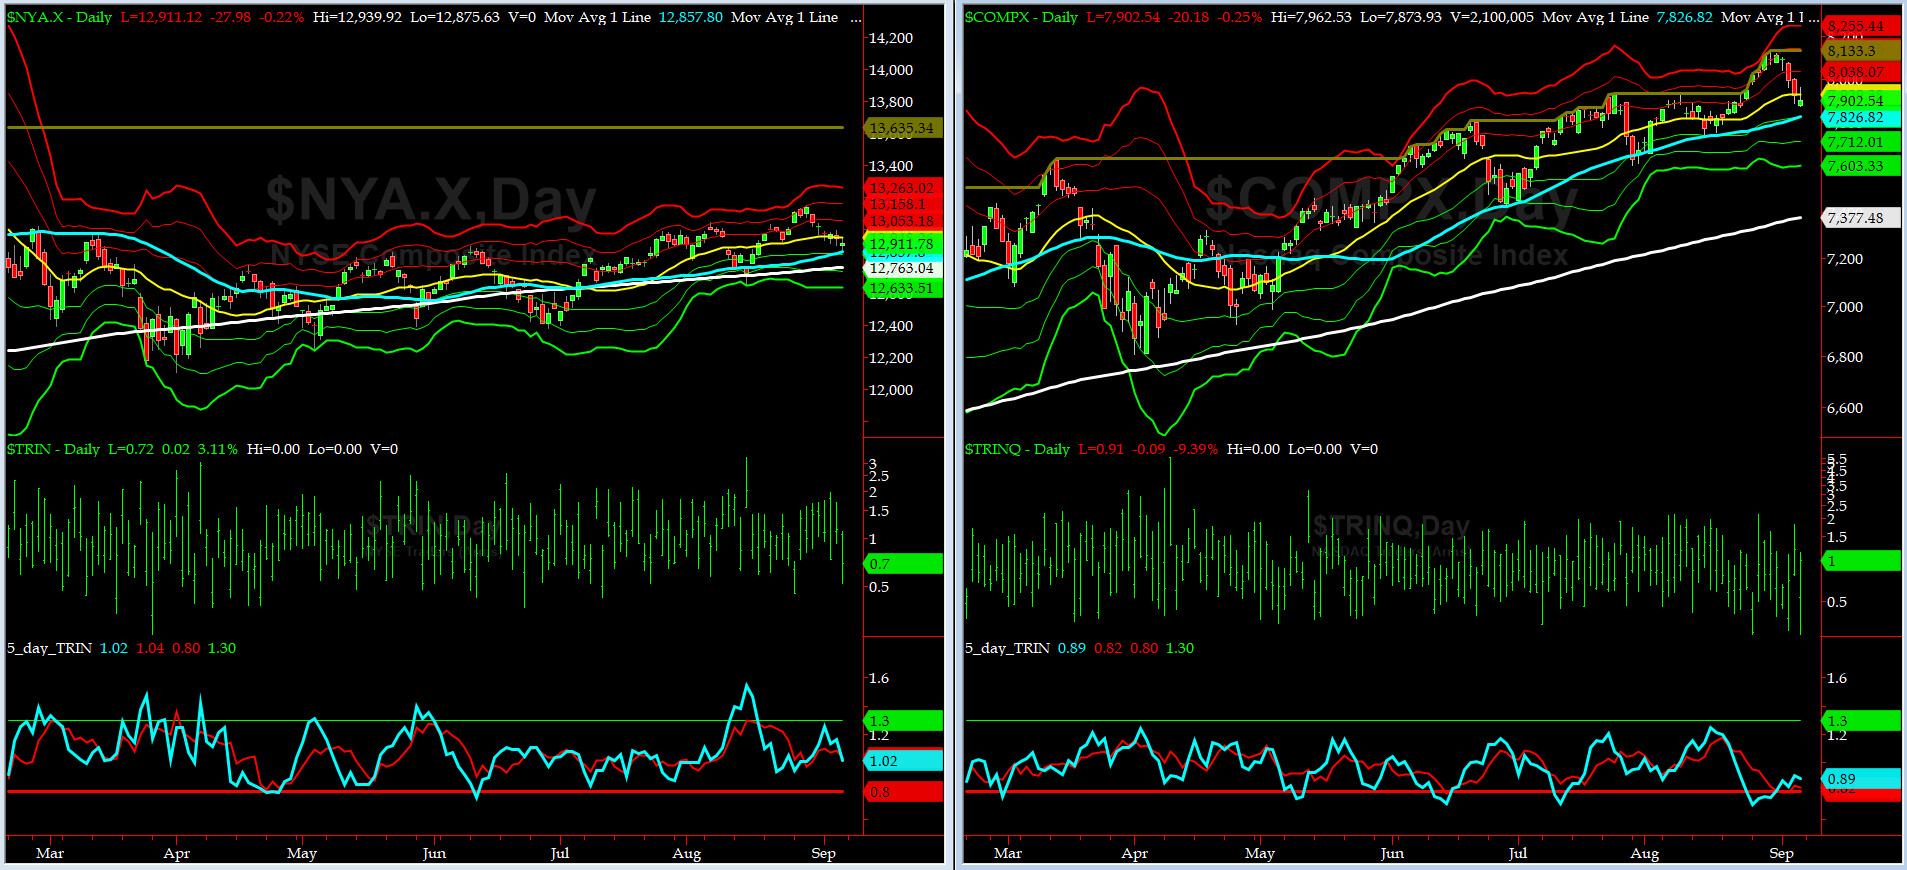
5-day TRIN & TRINQ Charts
Both NYSE 5-day TRIN & TRINQ (for NASDAQ) continue to remain in NEUTRAL & near SELL zones, respectively.
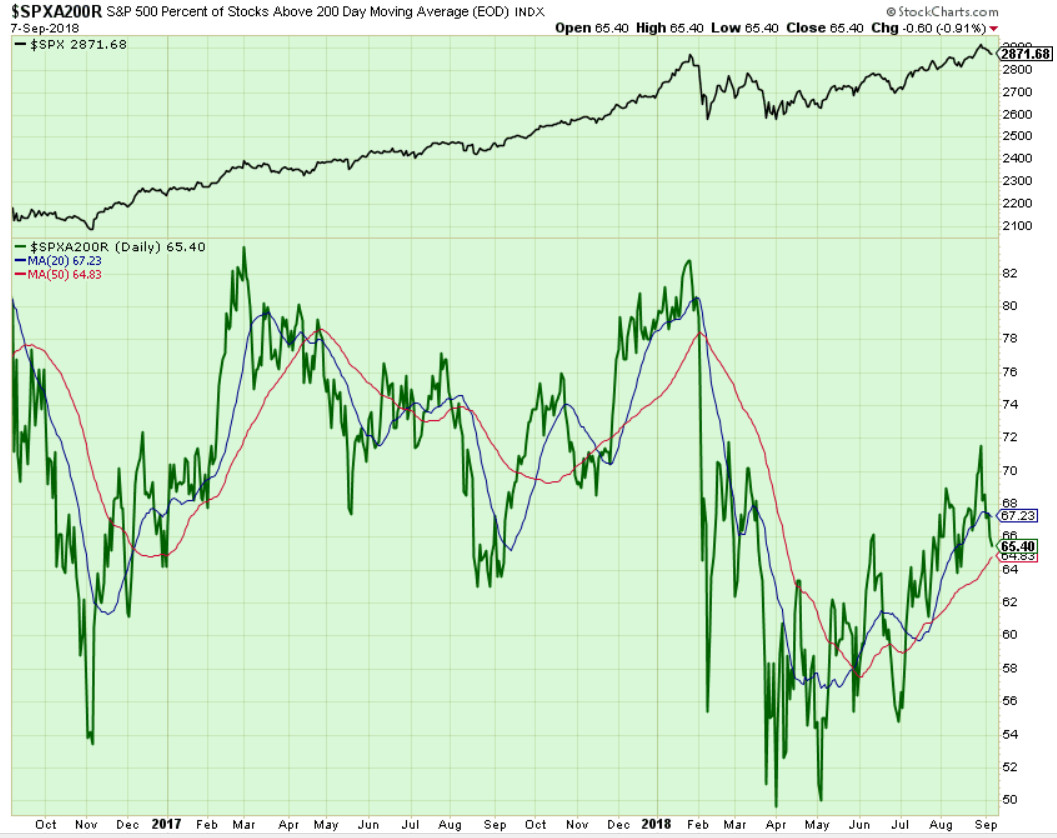
Components of SPX above their respective 200day MA Chart
On Wednesday, this scoring indicator dropped sharply this week to 65%. Next level to watch is 64. A break below that is not a good omen for this market.
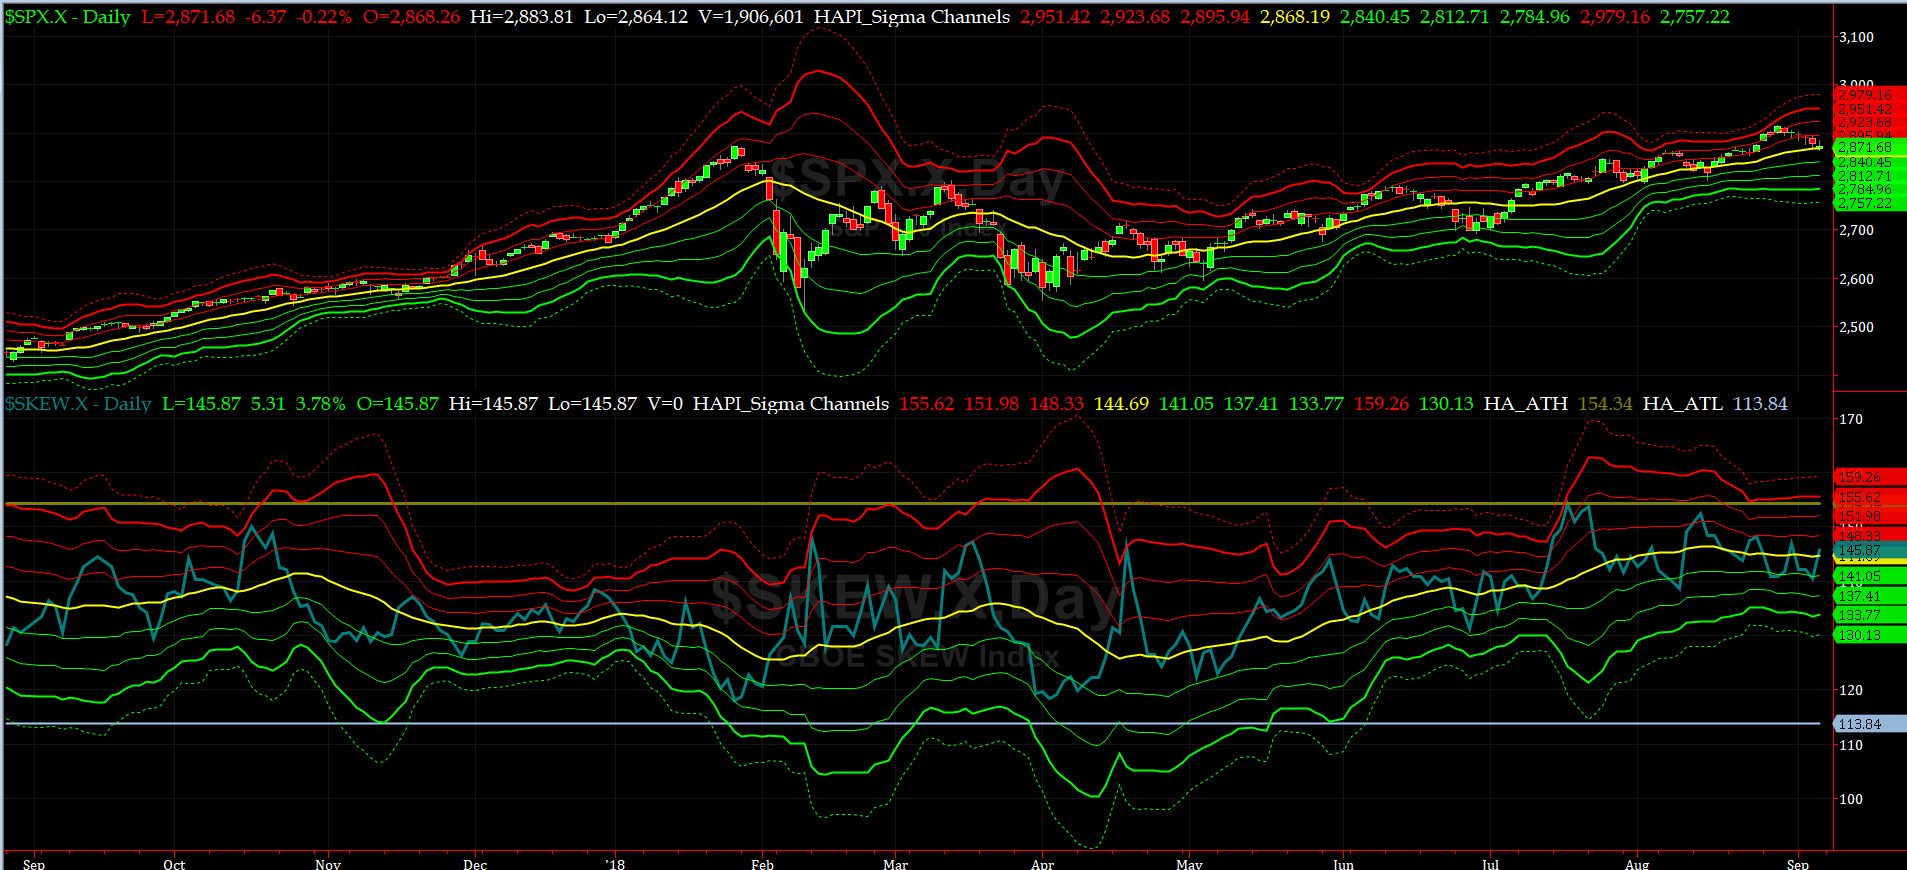
SPX SKEW (Tail Risk) Chart
On Friday, SPX SKEW (Tail Risk) closed near 146, a tad above its zero sigma (normal = 120-125, range 100-150).
Is all quiet on the Eastern & Mid-Western Fronts? Our beloved @Capt_Tiko still says "maybe."
How to interpret the value of SPX SKEW? (from CBOE white paper on SKEW)


3-month VIX Futures Spread(VX) Chart
This popular timing indicator, (long Sep, & short Deez VIX Futures) is at -1. This reading is still NEUTRAL.
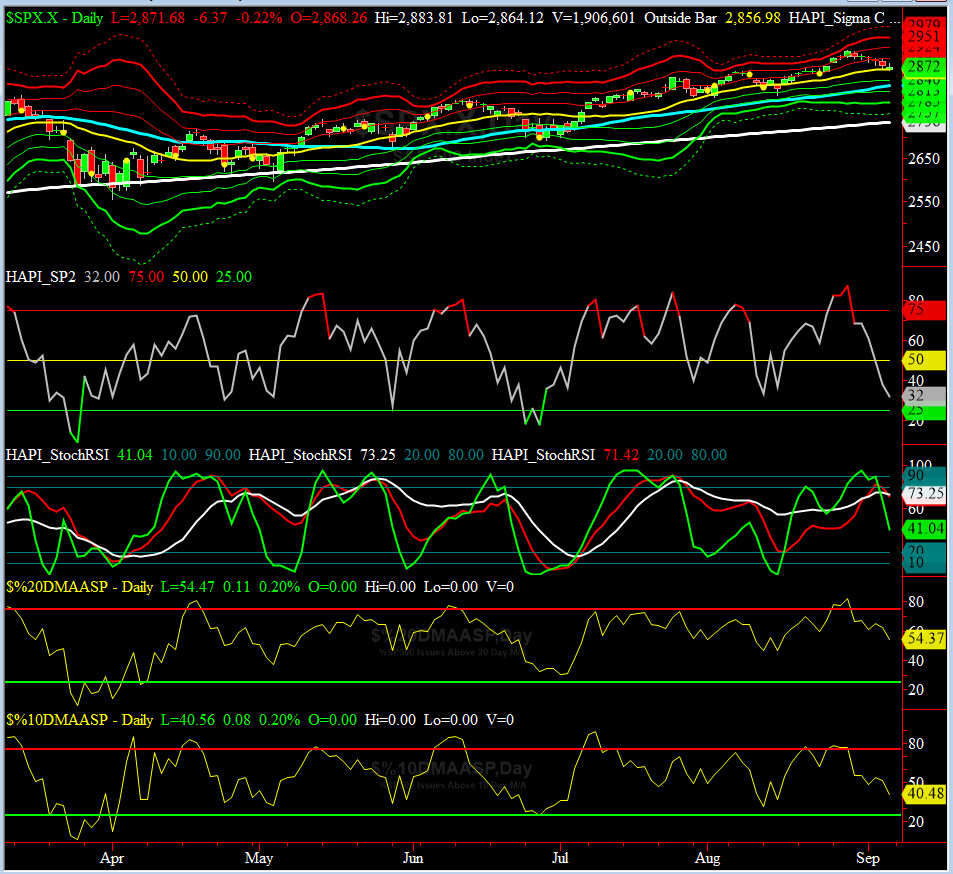
HA_SP2 Chart
HA_SP2 = 32 (Buy signal <= 25, Sell Signal >= 75)
We are so proud of our coveted SP2 prop indicator. It has dropped seven sessions in a row. We will be watching for its cross below 25 (OverSold zone).
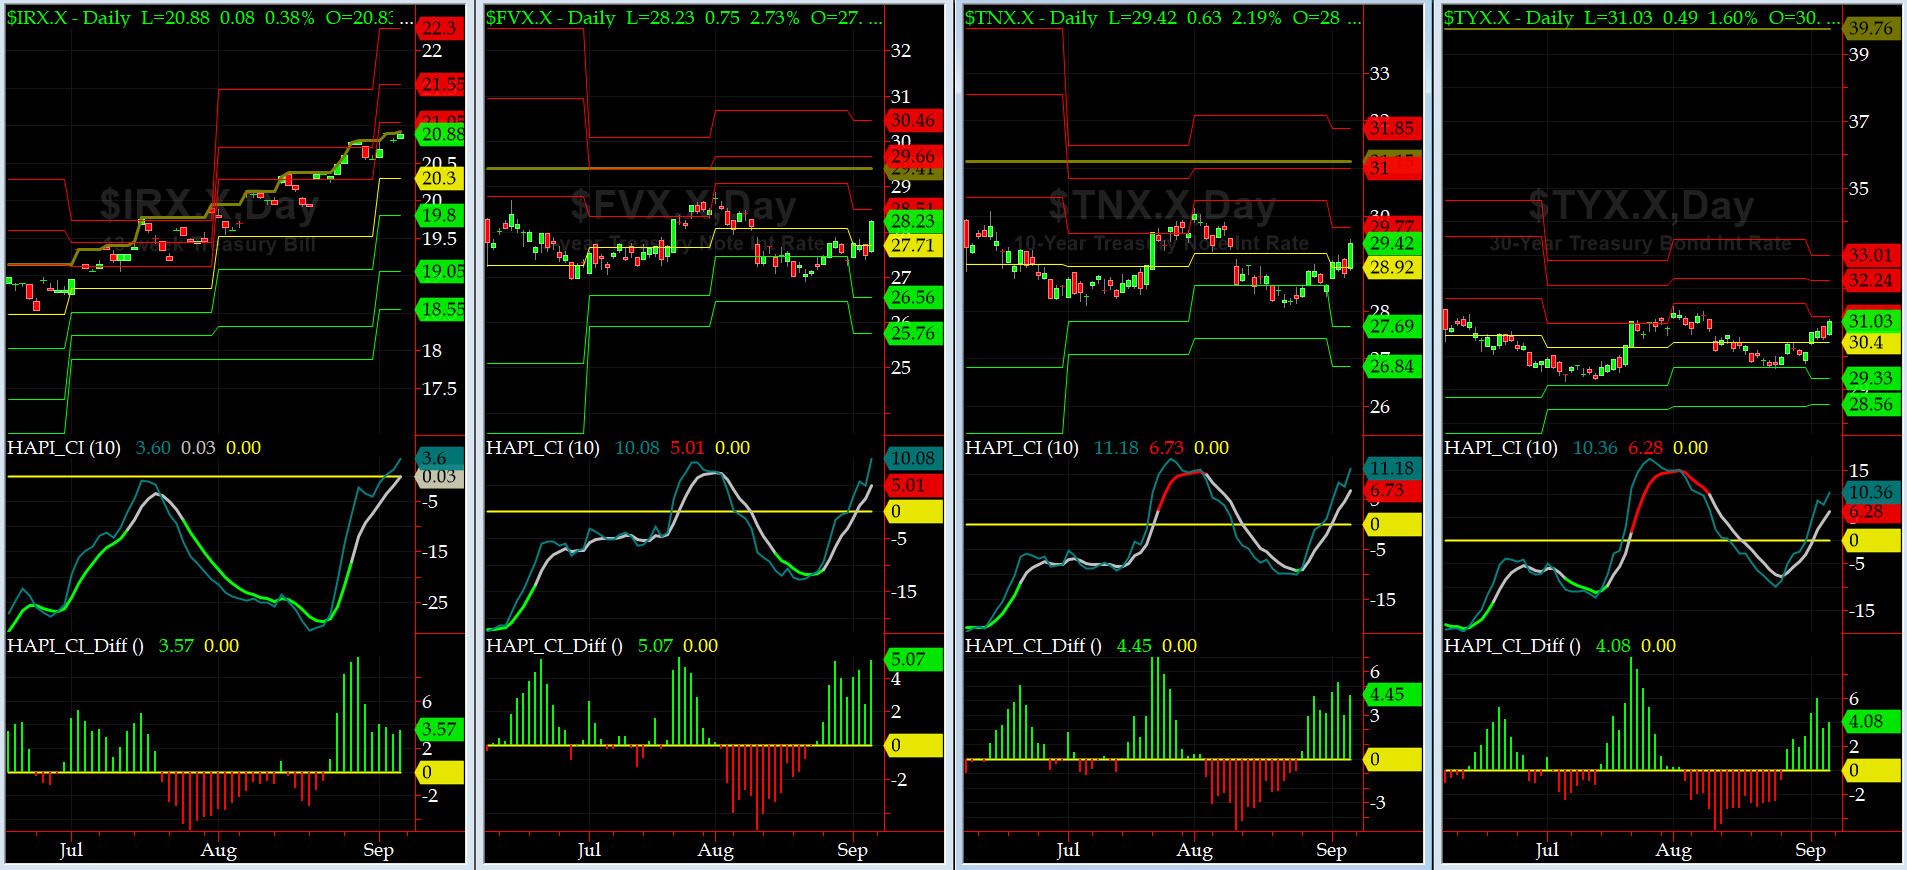
US Treasury T-Notes & T-Bonds Yields Chart
On Friday, the rapid rise in YTMs for the Notes & Bonds, [post Aug-NFP release with good AHE components) was celebrated in all corners of the Bond Market. Our beloved Mr & Mrs Maury were seen cartwheeling on Rodeo Drive (she has CapEx catching up to do LOL).
Fari Hamzei
|


 Proactive Market Timing