|
Sunday, September 16th, 2018, 2245ET
Market Timing Charts, Analysis & Commentary for Issue #258
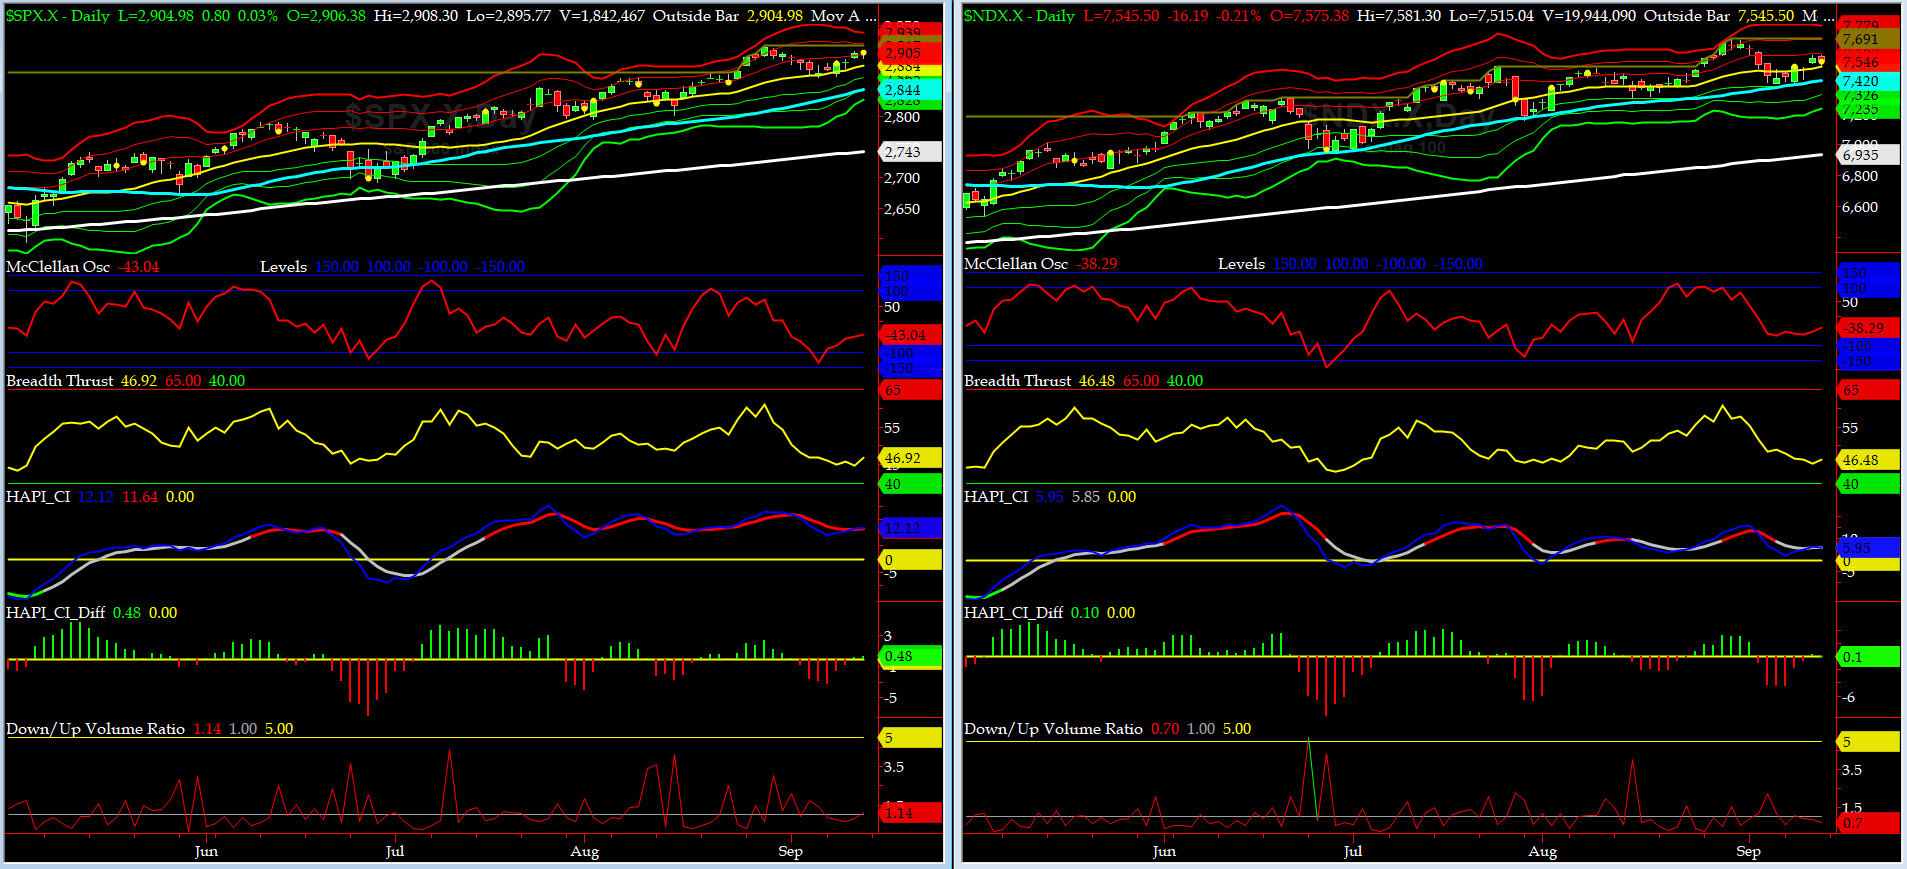
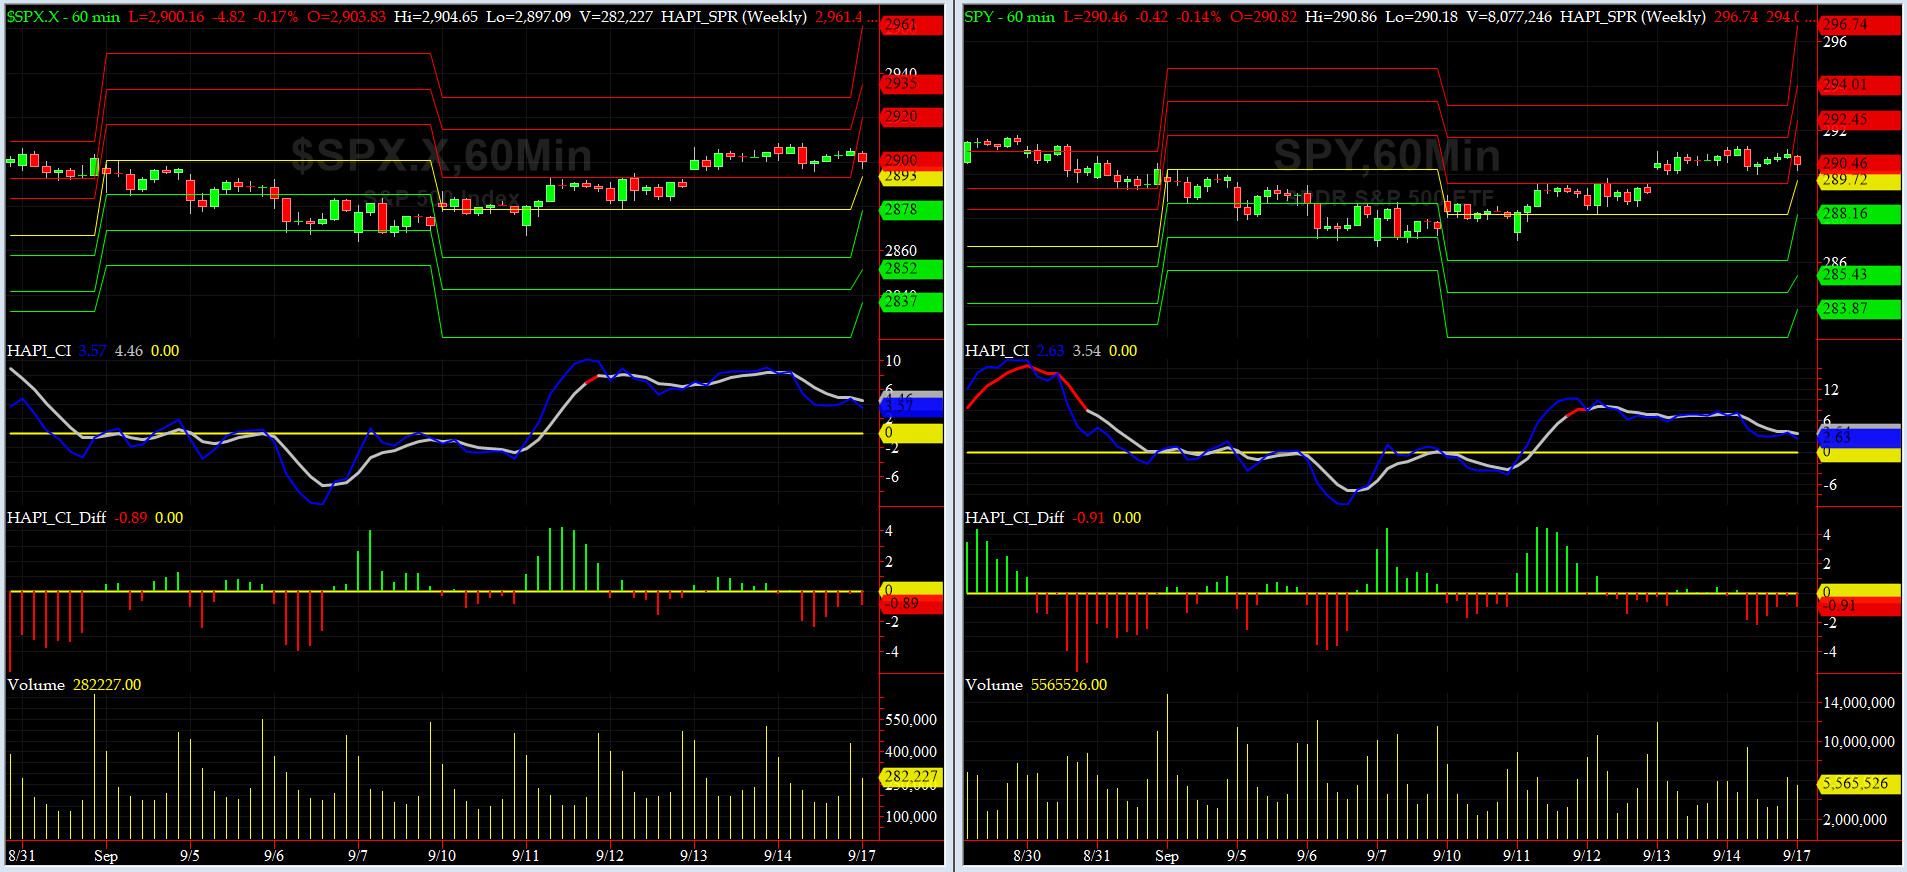
Timer Charts of S&P-500 Cash Index (SPX) + NASDAQ-100 Cash Index (NDX)
Most recent S&P-500 Cash Index (SPX): 2904 up +32 (up +1.1%) for the week ending on Friday, September 14, 2018, which closed a tad above its +1 sigma.
DJIA ALL TIME INTRADAY HIGH = 26617 (reached on Friday, January 26, 2018)
DJ TRAN ALL TIME INTRADAY HIGH = 11623 (reached on Friday, September 14, 2018)
SPX ALL TIME INTRADAY HIGH = 2916 (reached on Wednesday, August 29, 2018)
NDX ALL TIME INTRADAY HIGH = 7691 (reached on Thursday, August 30, 2018)
RUT ALL TIME INTRADAY HIGH = 1742 (reached on Friday, August 31, 2018)
Current DAILY +2 Sigma SPX = 2920 with WEEKLY +2 Sigma = 2926
Current DAILY 0 Sigma SPX = 2884 with WEEKLY 0 Sigma = 2793
Current DAILY -2 Sigma SPX = 2847 with WEEKLY -2 Sigma = 2659
NYSE McClellan Oscillator = -43 (-150 is start of the O/S area; around -275 to -300 area or lower, we go into the �launch-pad� mode; over +150, we are in O/B area)
NYSE Breadth Thrust = 46.9 (40 is considered as oversold and 65 as overbought)
With 17th Anniversary of 911 & start of Jewish High Holidays, volume was miserablely low and we slowly crept up 2 days out of 5 trading days last week.

Canaries [in the Coal Mine] Chart for DJ TRAN & RUT Indices
200-Day MA DJ TRAN = 10,732 or 7.8% below DJ TRAN (max observed in last 7 yrs = 20.2%, min = -20.3%)
200-Day MA RUT = 1606 or 7.1% below RUT (max observed in last 7 yrs = 21.3%, min = -22.6%)
DJ Transportation Index (proxy for economic conditions 6 to 9 months hence) rallied this week and made a new ATH each of trading day of last week.
Russell 2000 Small Caps Index (proxy for Risk ON/OFF) went nowhere fast this past week, but, RISK is still ON, ioho
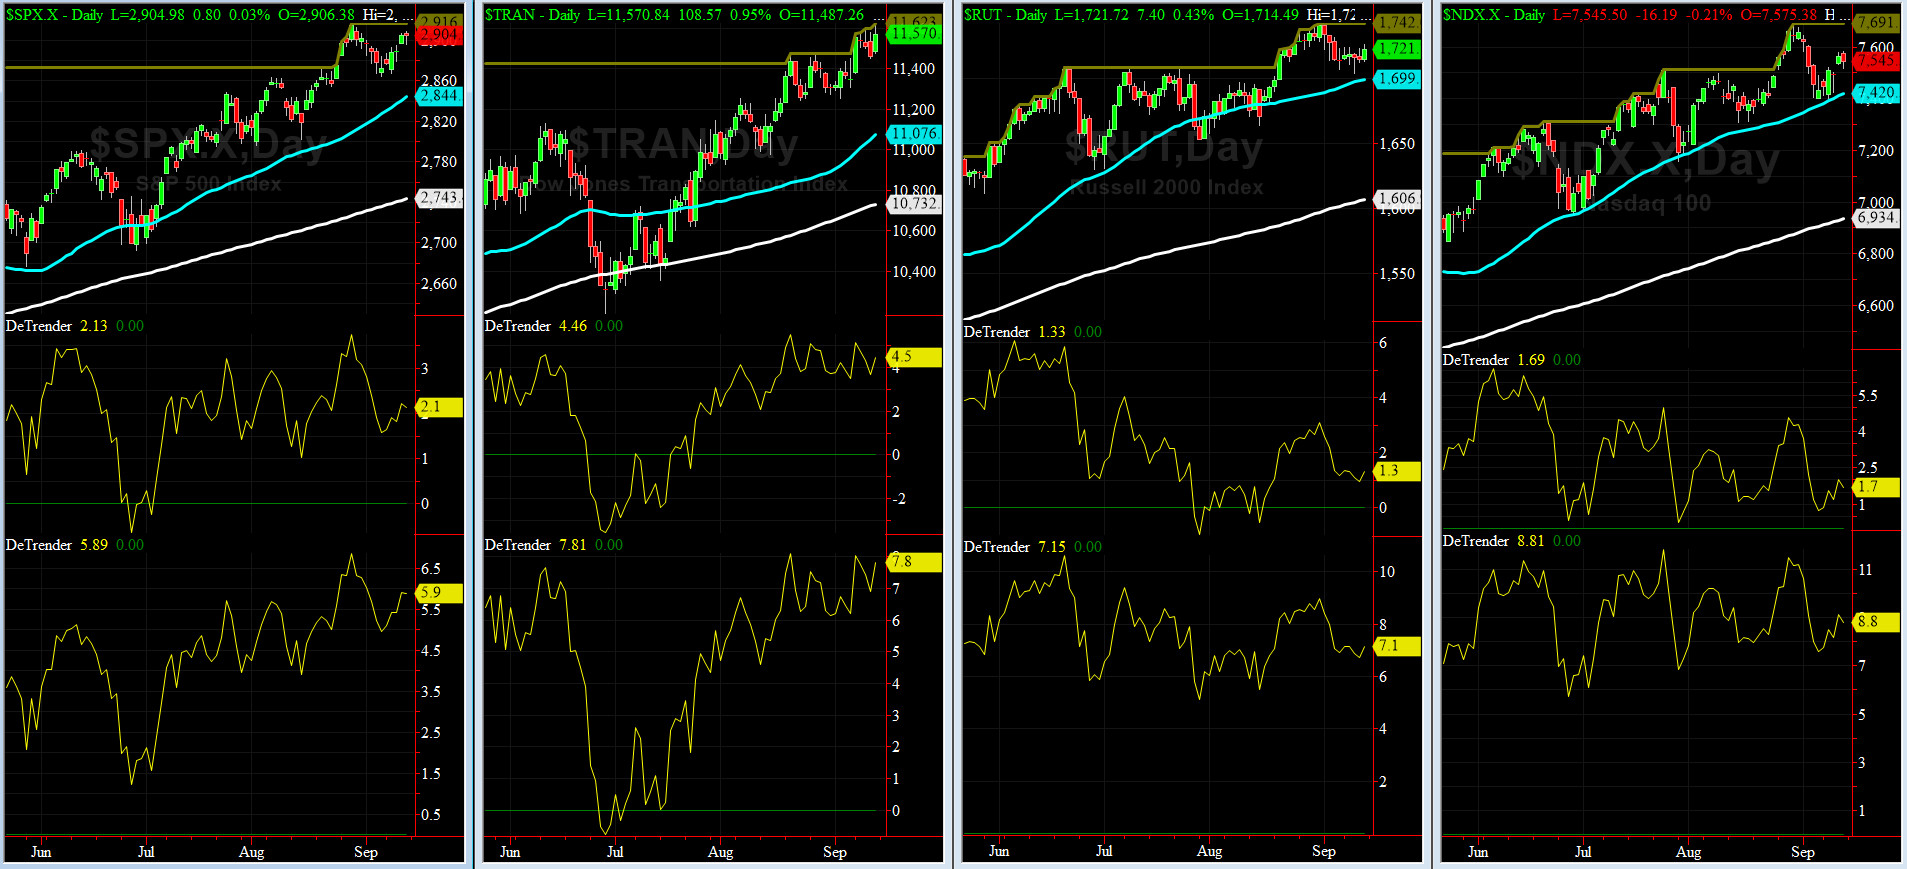
DeTrenders Charts for SPX, NDX, TRAN & RUT Indices
50-Day MA SPX = 2844 or 2.1% below SPX (max observed in last 7 yrs = +8.6%, min = -9.3%)
200-Day MA SPX = 2743 or 5.9% below SPX (max observed in last 7 yrs = 15.2%, min = -14%)
ALL of our EIGHT DeTrenders are in POSITIVE territory. The DeTrenders for DJ Tran & RUT will continue to be harbingers of future price behavior in broad indices.
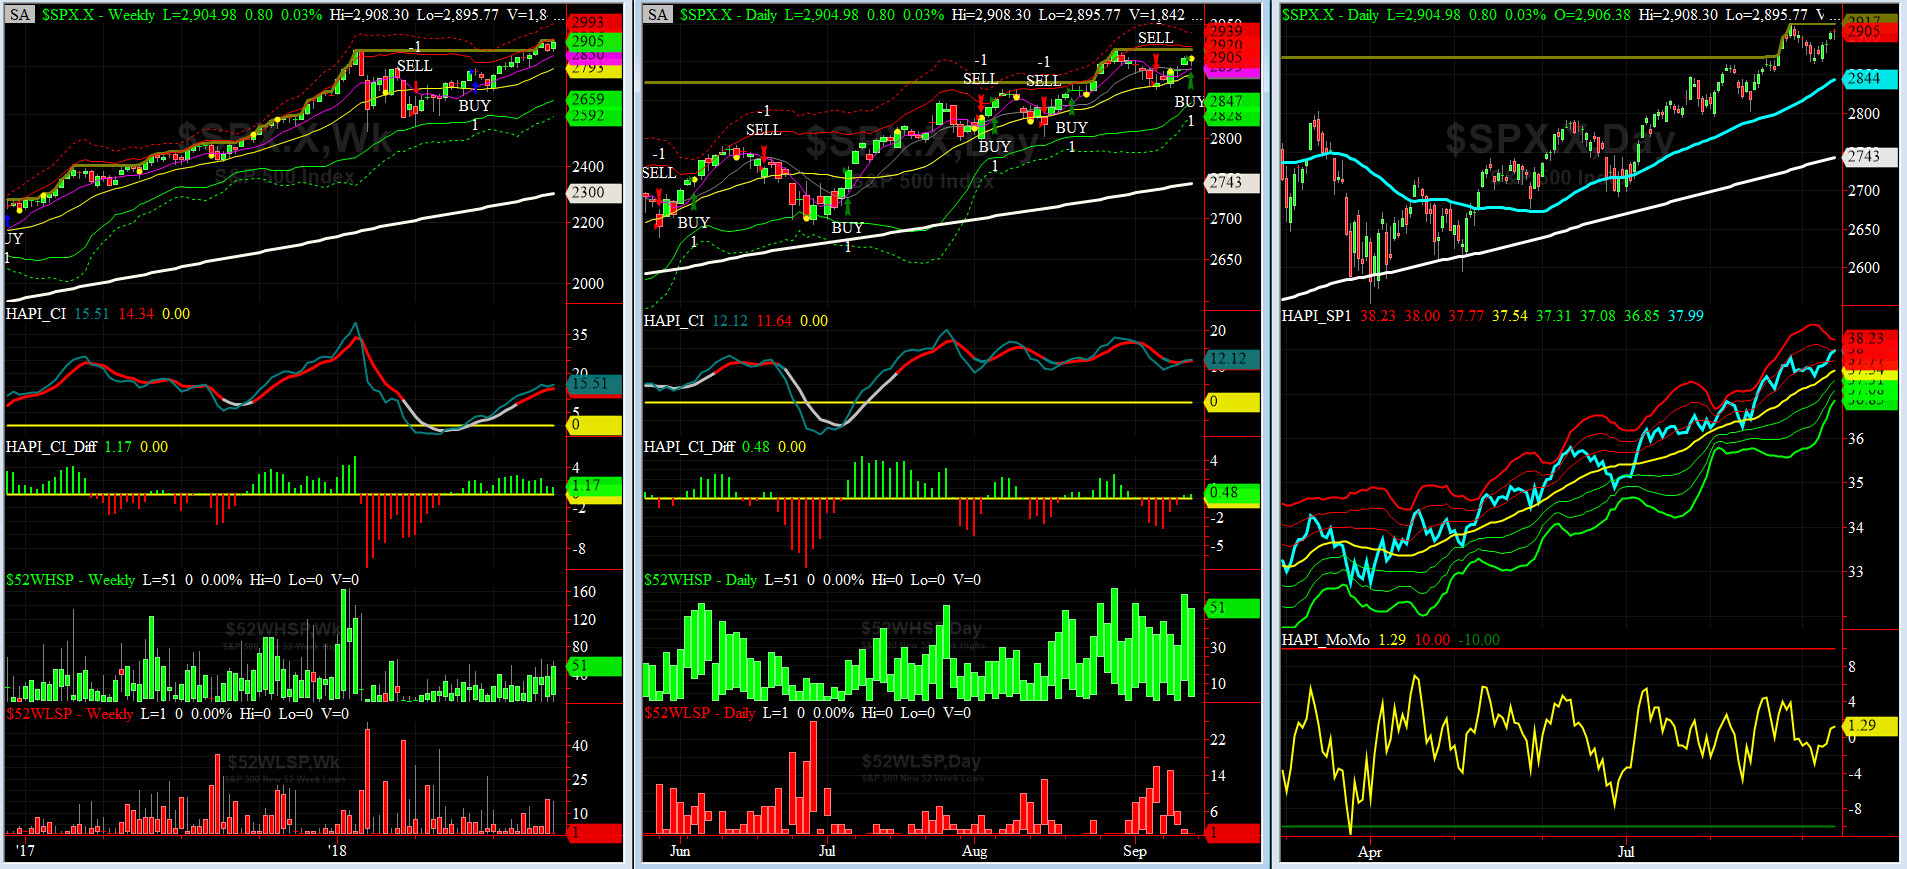
HA_SP1_Momo Chart
WEEKLY Timing Model = on a BUY Signal since Friday, June 15, 2018 CLOSE at 2779
DAILY Timing Model = on a BUY Signal since Friday, September 14, 2018 CLOSE at 2872
Max SPX 52wk-highs reading last week = 59 (over 120-140, the local maxima is in)
Max SPX 52wk-Lows reading last week = 15 (over 40-60, the local minima is in)
HA_SP1 closed just about its +2 sigma channels
HA_Momo = +1.3 (reversals most likely occur above +10 or below -10)
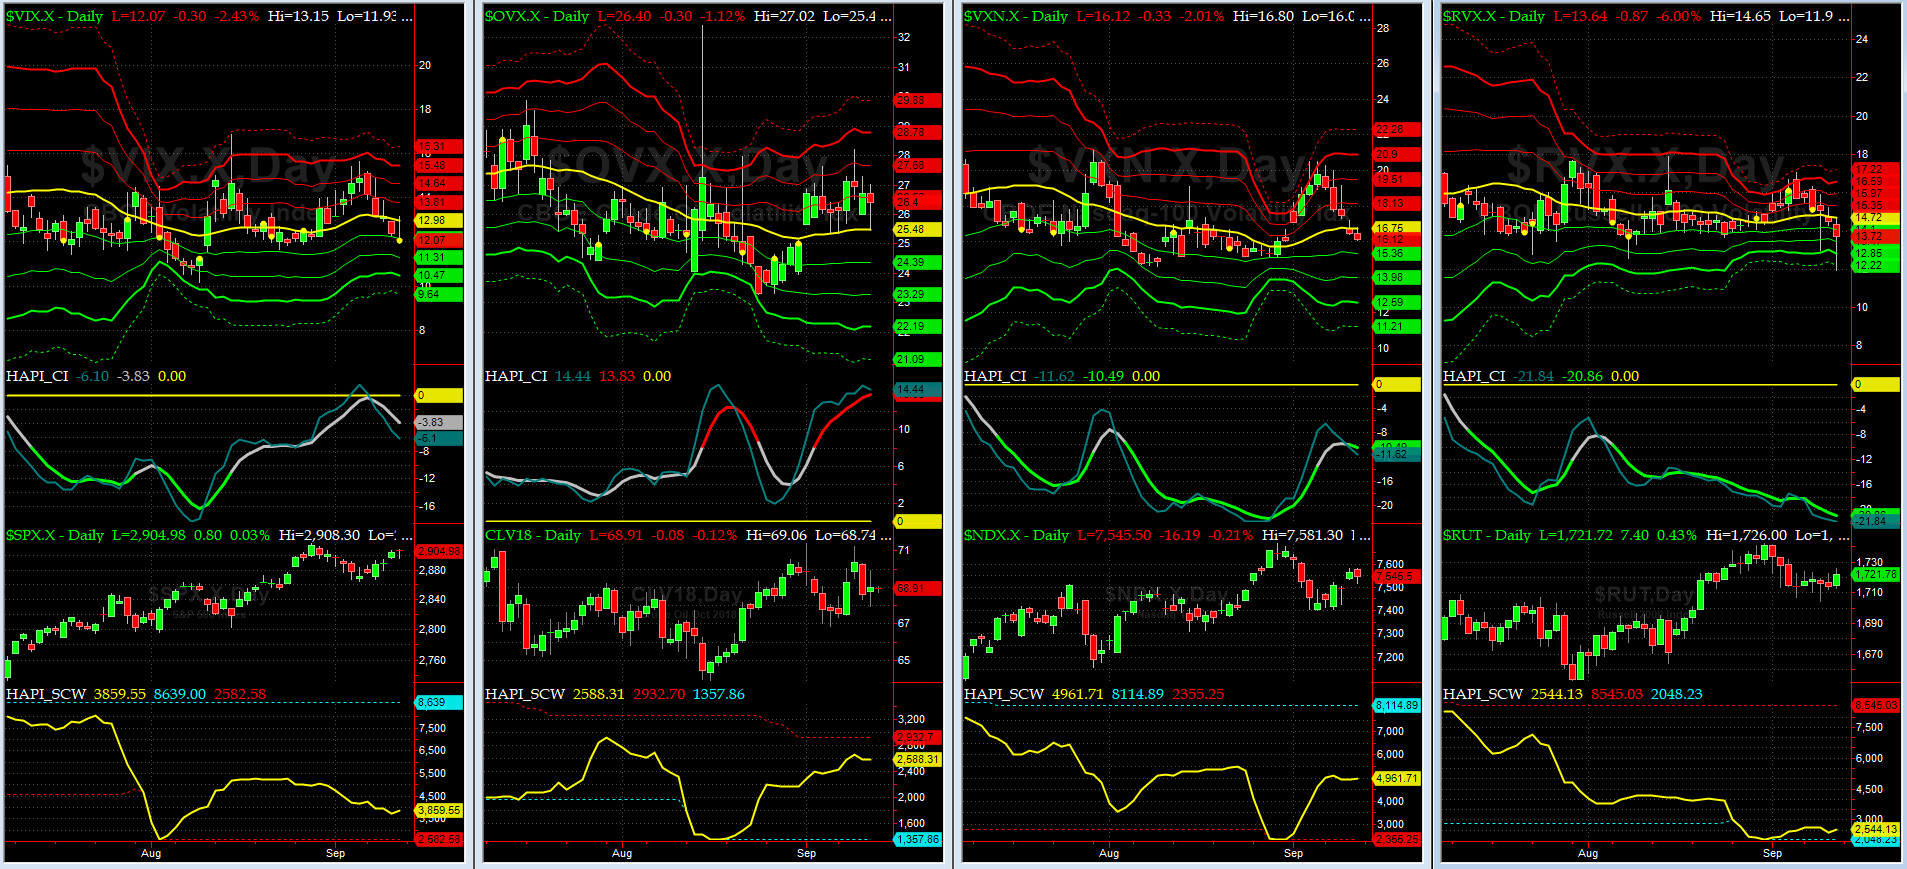
Vol of the Vols Chart
Spot VIX currently stands at 12.07, right about its -1 sigma (remember it's the VIX volatility pattern aka "its sigma channels" that matters, and not the level of VIX itself (this is per Dr. Robert Whaley, a great mentor and inventor of original VIX, now called VXO). VIX usually peaks around a test of its +4 sigma).
VIX has dropped every day this past week......
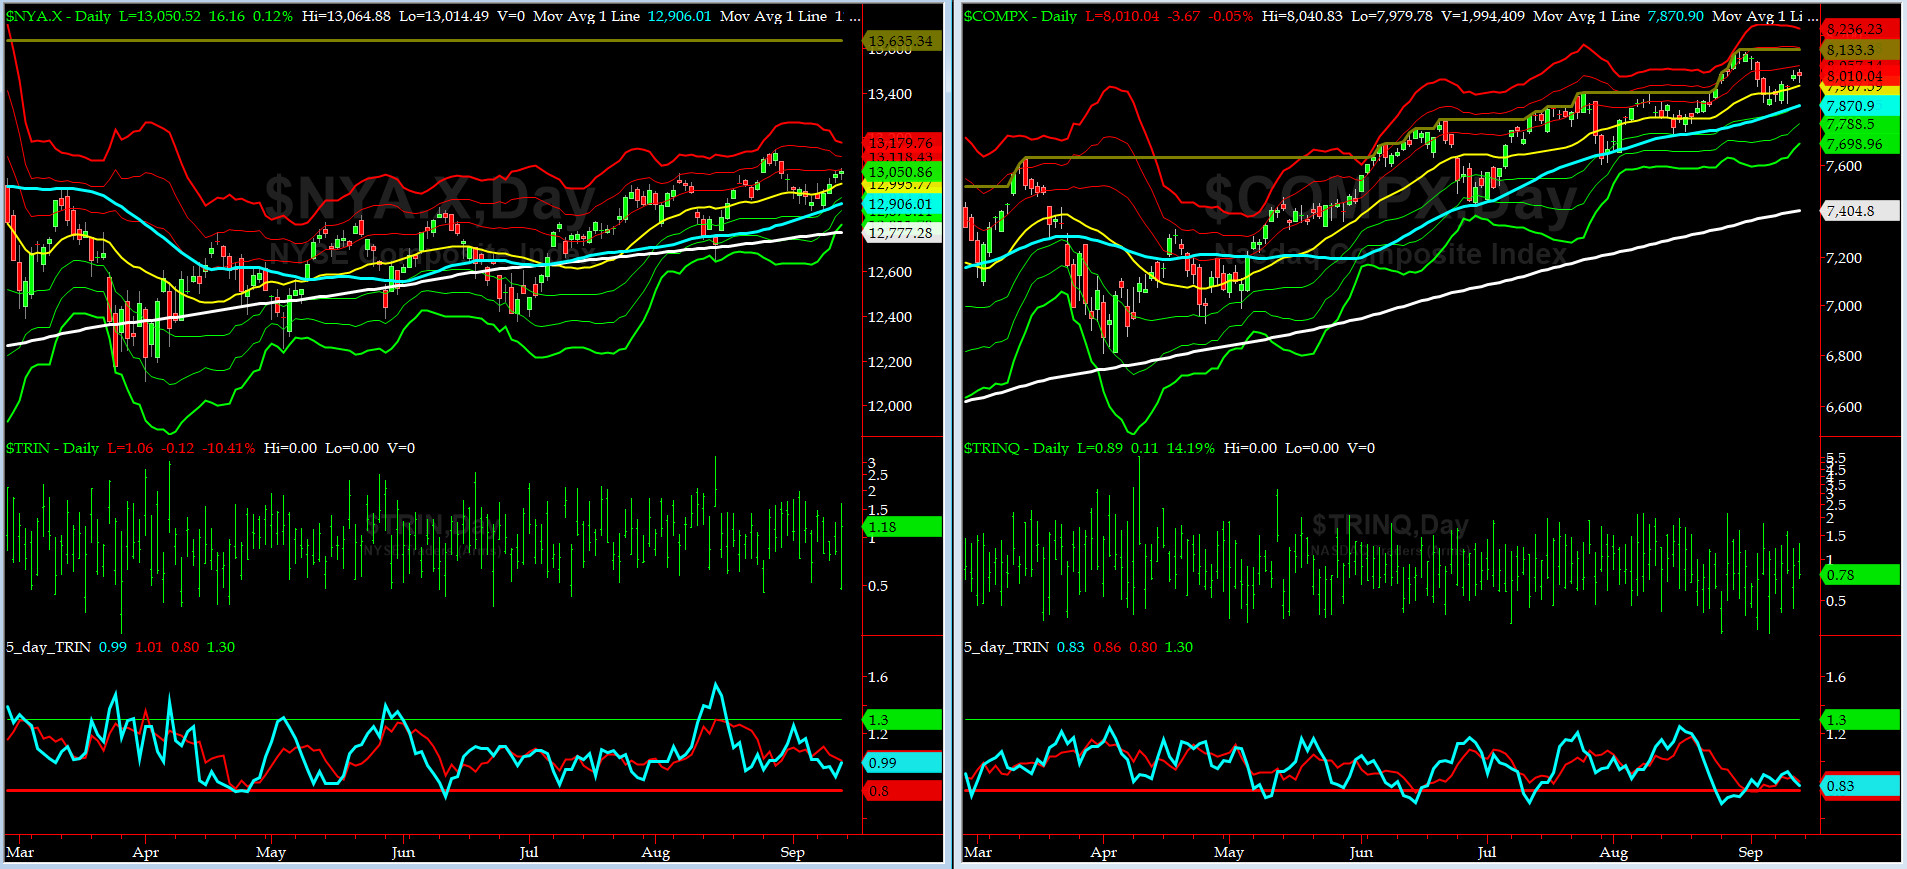
5-day TRIN & TRINQ Charts
Both NYSE 5-day TRIN & TRINQ (for NASDAQ) continue to remain in NEUTRAL & near SELL zones, respectively.
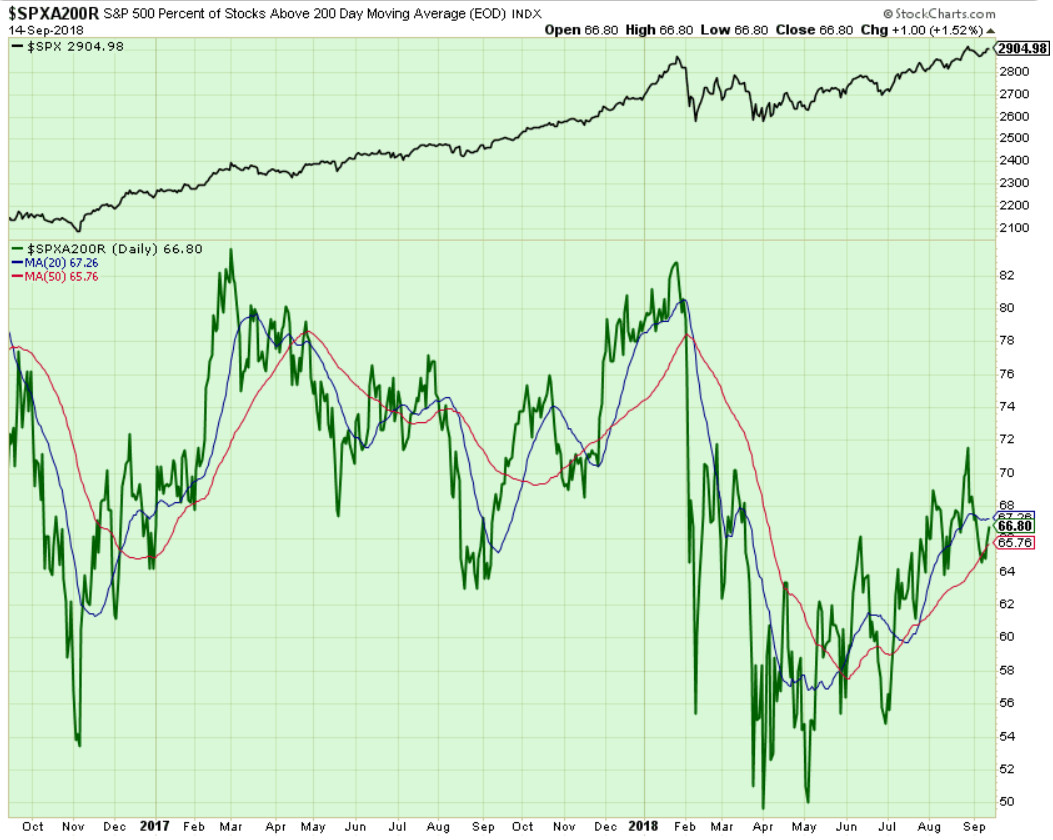
Components of SPX above their respective 200day MA Chart
On Wednesday, this scoring indicator rose to 66.8%. Next upper level to watch is 68. A break below 64 is not a good omen for this market.
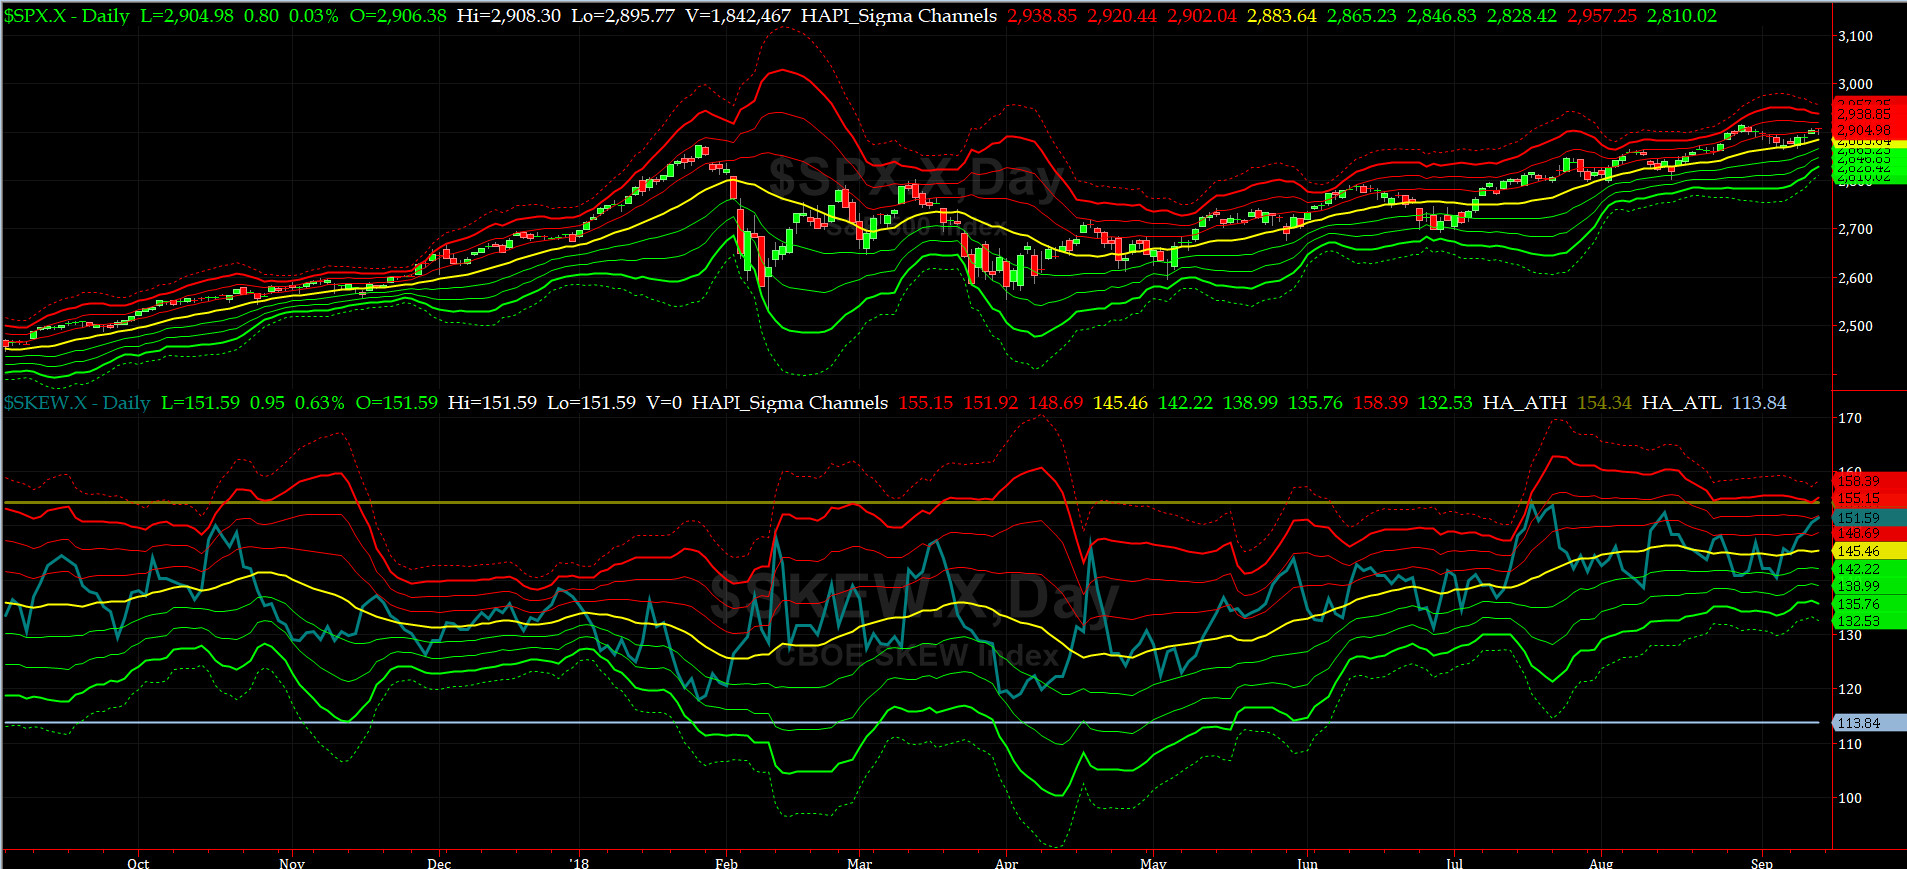
SPX SKEW (Tail Risk) Chart
On Friday, SPX SKEW (Tail Risk) closed near 151.6, a tad below its +2 sigma (normal = 120-125, range 100-150).
Is all quiet on the Eastern & Mid-Western Fronts? Our beloved @Capt_Tiko now says "maybe NOT...."
How to interpret the value of SPX SKEW? (from CBOE white paper on SKEW)

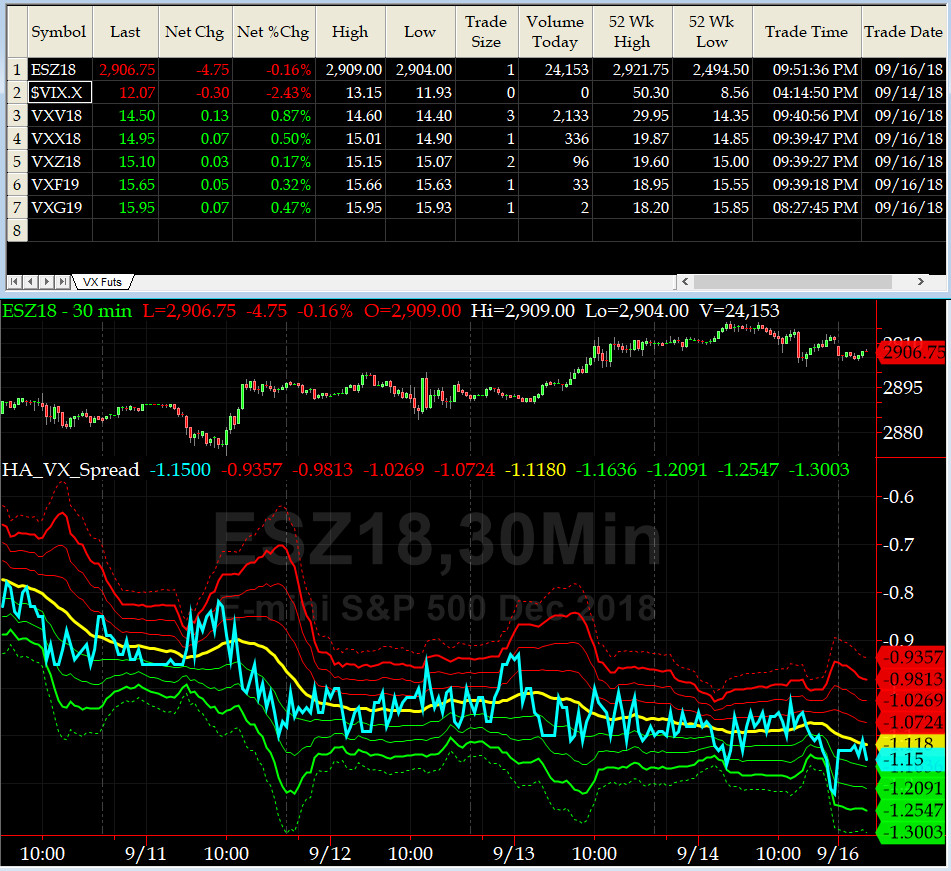
3-month VIX Futures Spread(VX) Chart
This popular timing indicator, (long Sep, & short Deez VIX Futures) closed at -1.22. This reading is NEUTRAL.

HA_SP2 Chart
HA_SP2 = 73.4 (Buy signal <= 25, Sell Signal >= 75)
Our coveted SP2 prop indicator is about to enter its OverBought zone. Watch for divergence here.
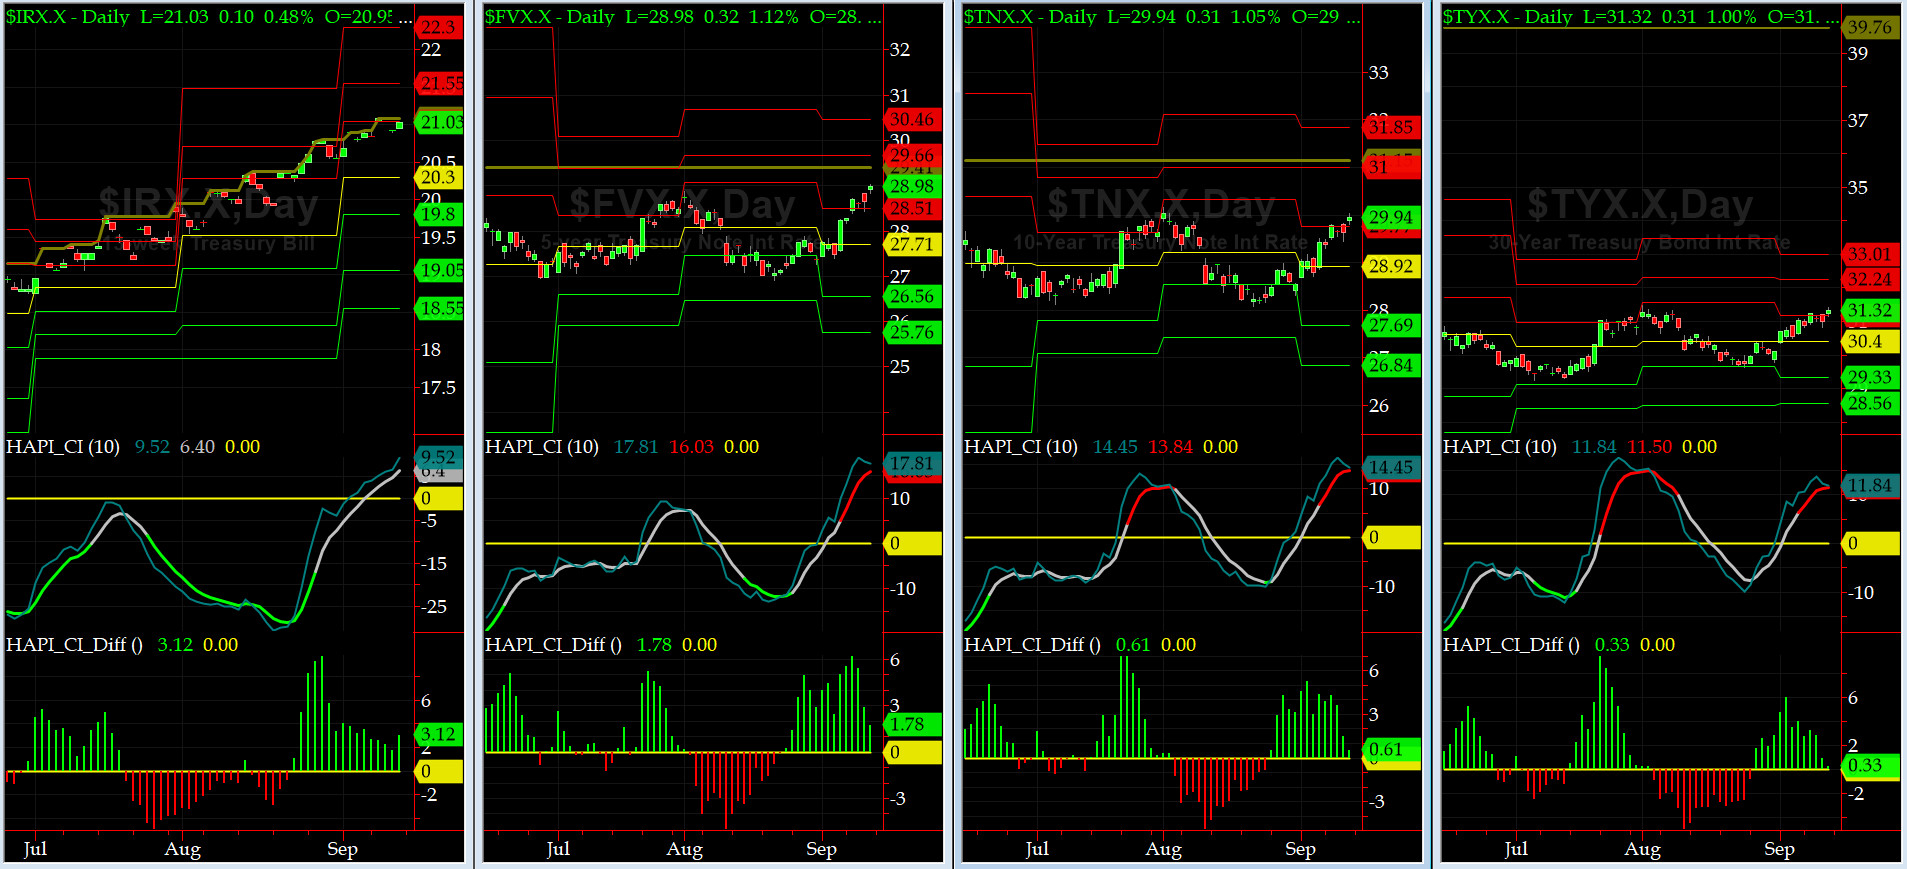
US Treasury T-Notes & T-Bonds Yields Chart
On Friday, YTMs rose again. Our beloved Mr & Mrs Maury spent the whole weekend shopping on Rodeo Drive. #OnlyInAmerica...
Fari Hamzei
|


 Proactive Market Timing