|
Sunday, October 7, 2018, 1215ET
Market Timing Charts, Analysis & Commentary for Issue #261
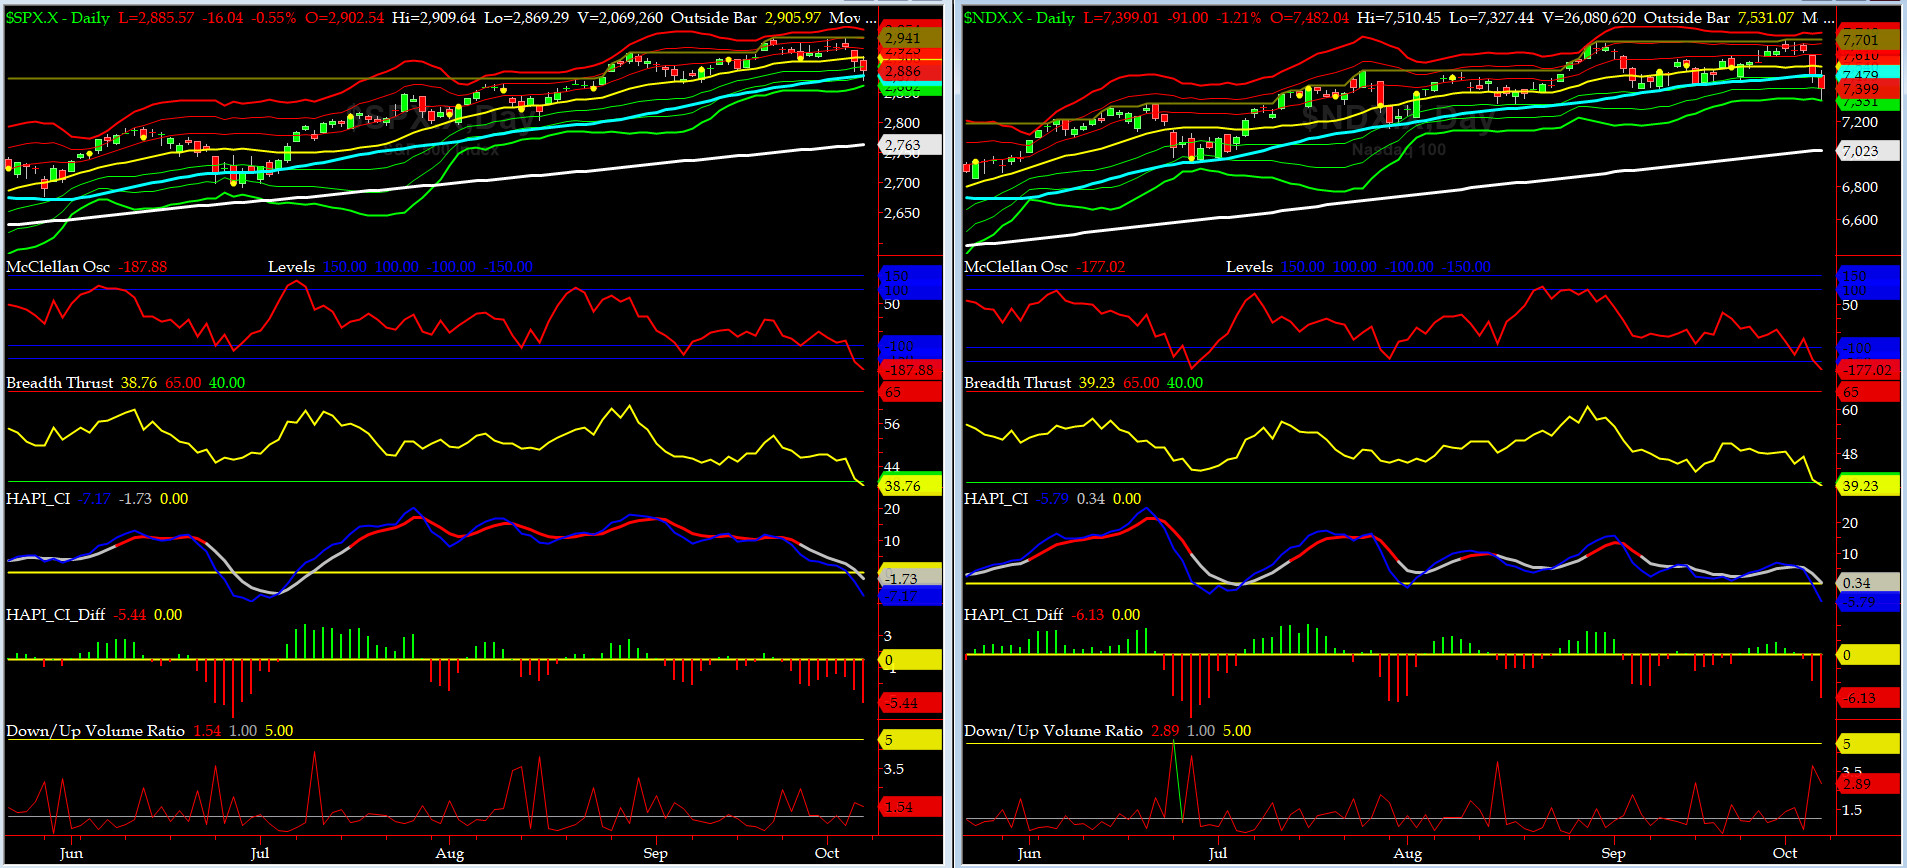
Timer Charts of S&P-500 Cash Index (SPX) + NASDAQ-100 Cash Index (NDX)
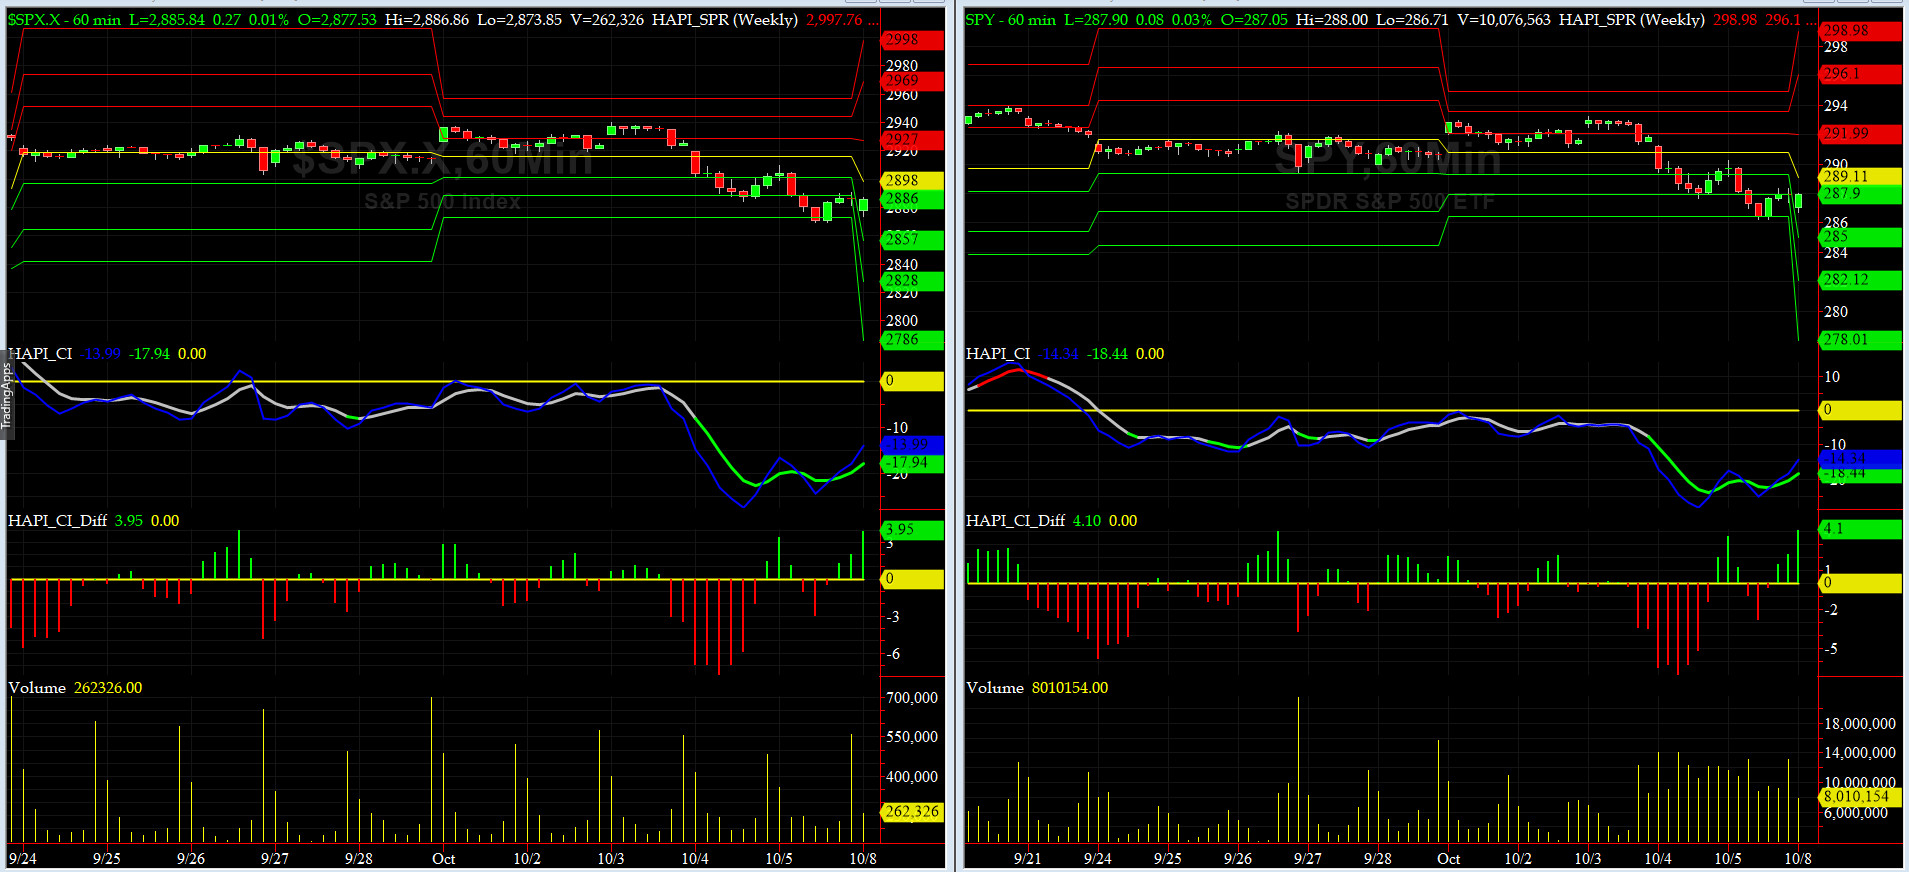
Most recent S&P-500 Cash Index (SPX): 2886 down -28 (down -1%) for the week ending on Friday, October 5, 2018, which closed just below its zero sigma.
DJIA ALL TIME INTRADAY HIGH = 26951 (reached on Wednesday, October 3, 2018)
DJ TRAN ALL TIME INTRADAY HIGH = 11623 (reached on Friday, September 14, 2018)
SPX ALL TIME INTRADAY HIGH = 2941 (reached on Friday, September 21, 2018)
NDX ALL TIME INTRADAY HIGH = 7700 (reached on Thursday, October 1, 2018)
RUT ALL TIME INTRADAY HIGH = 1742 (reached on Friday, August 31, 2018)
Current DAILY +2 Sigma SPX = 2938 with WEEKLY +2 Sigma = 2954
Current DAILY 0 Sigma SPX = 2908 with WEEKLY 0 Sigma = 2824
Current DAILY -2 Sigma SPX = 2877 with WEEKLY -2 Sigma = 2693
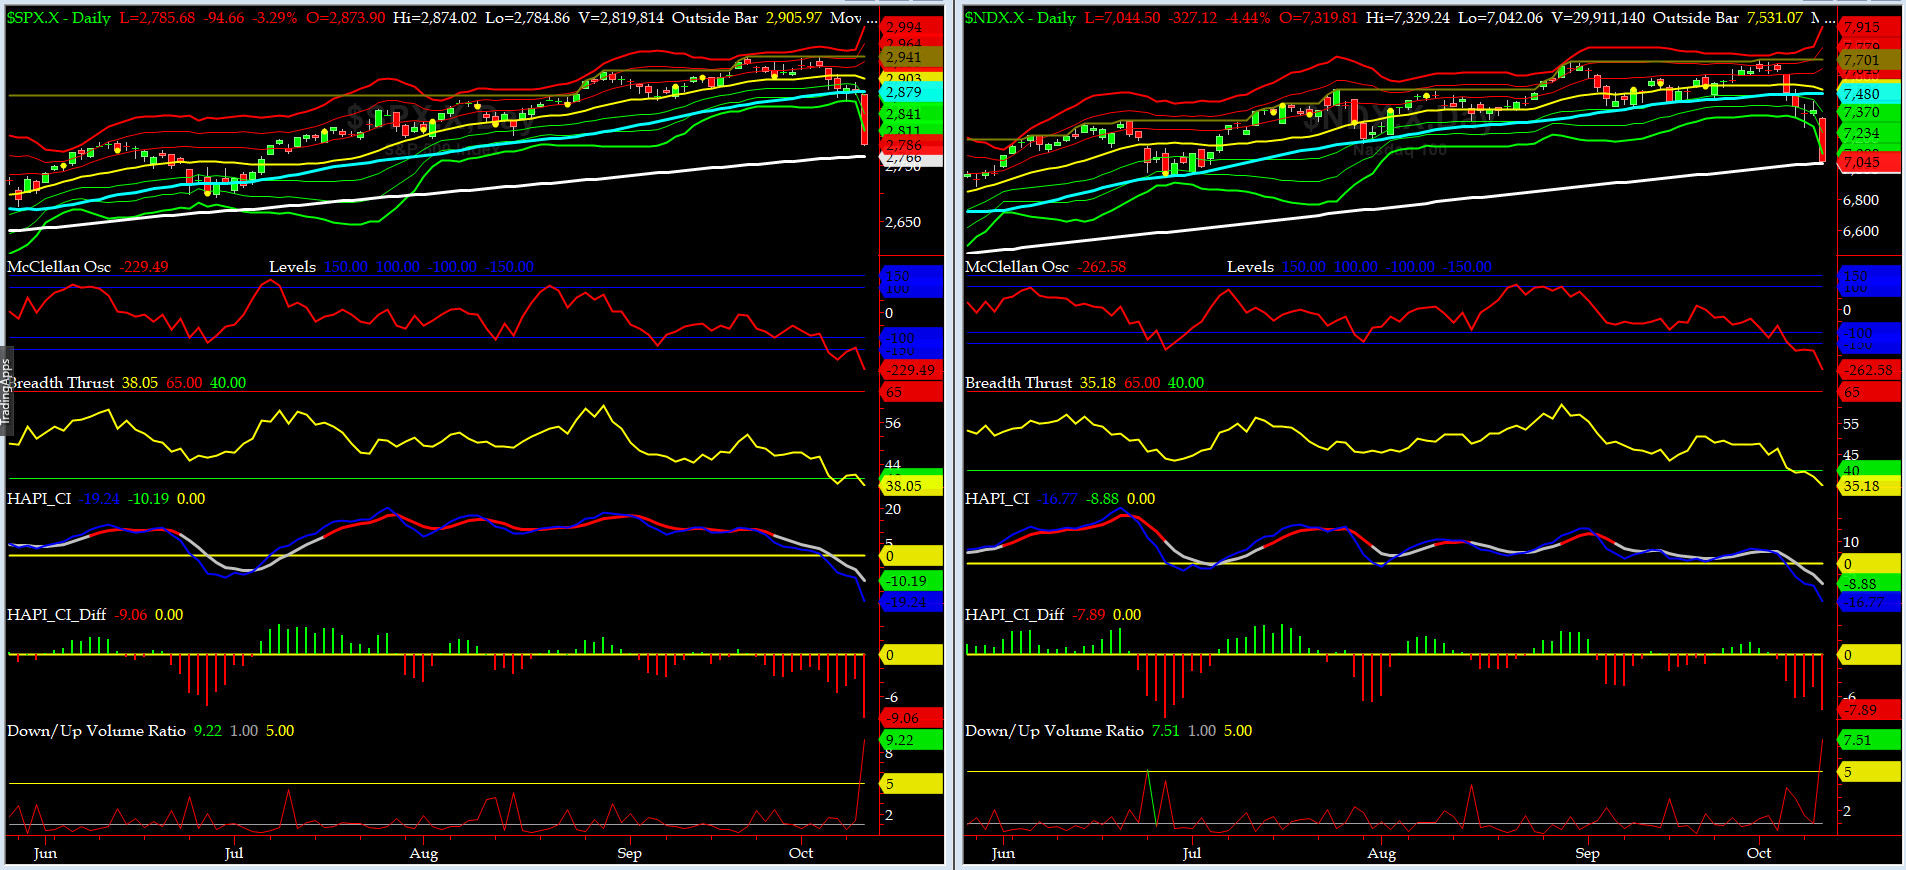
NYSE McClellan Oscillator = -188 (-150 is start of the O/S area; around -275 to -300 area or lower, we go into the �launch-pad� mode; over +150, we are in O/B area)
NYSE Breadth Thrust = 38.76 (40 is considered as oversold and 65 as overbought)
Mid-week on, our US Markets sold off pretty hard on econ data (ADP, NFP) and ratcheting up of Treasury Notes & Bonds Yields. We closed the week in oversold area.
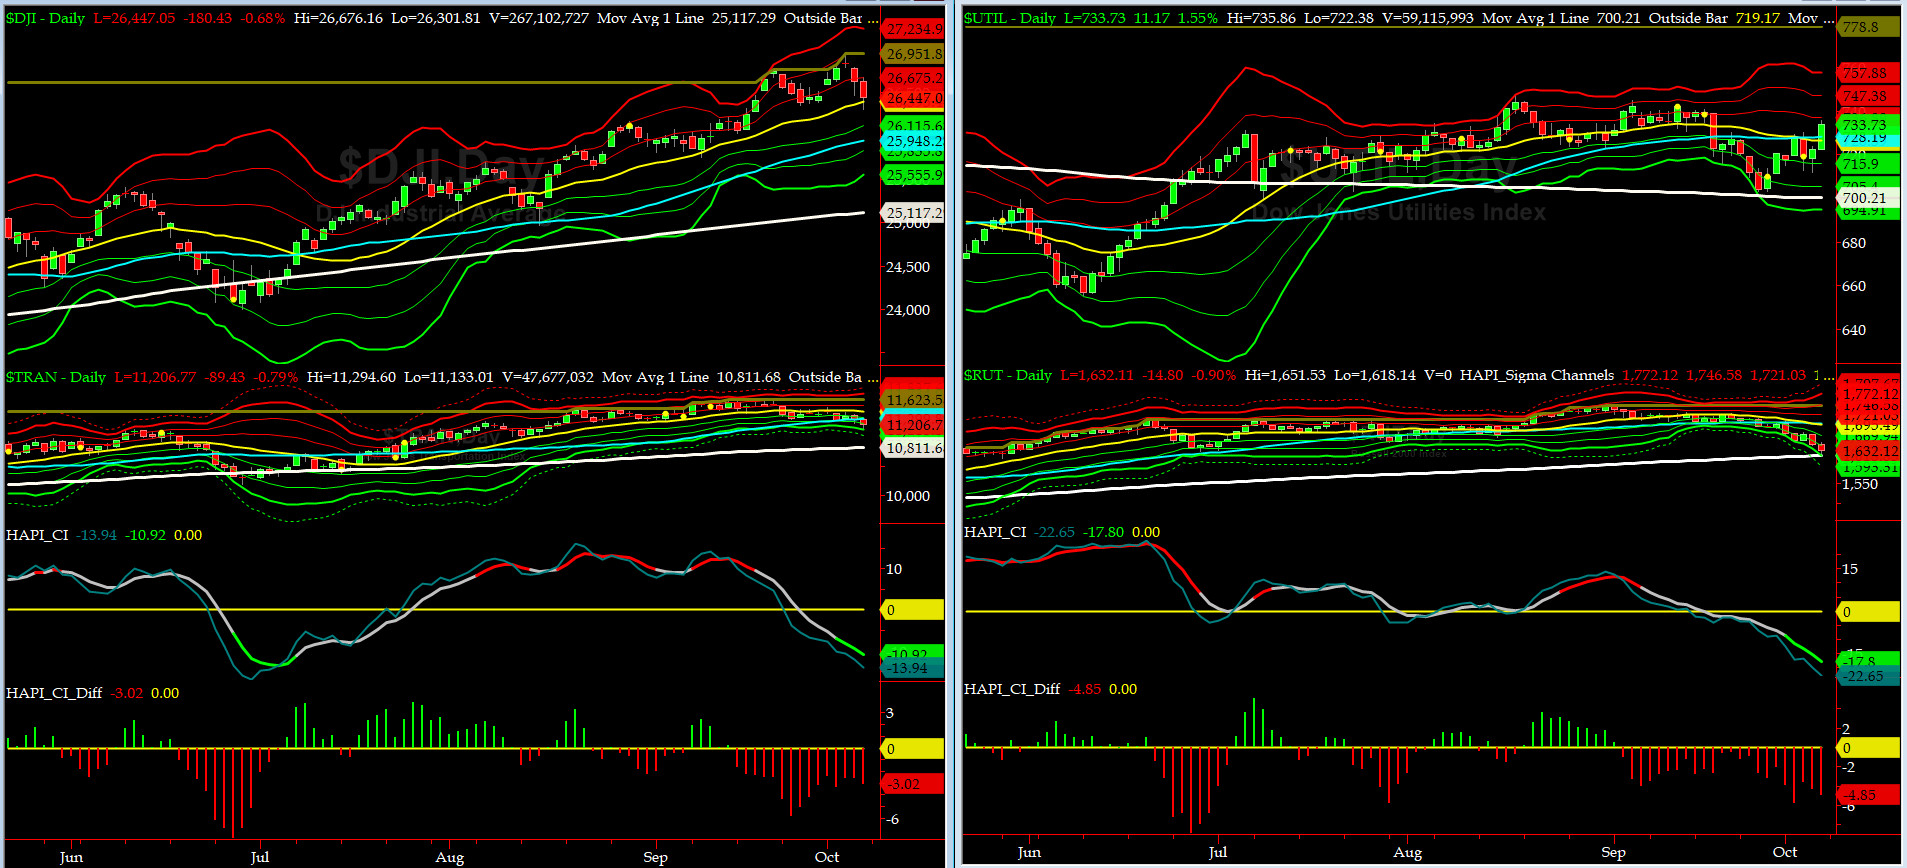
Canaries [in the Coal Mine] Chart for DJ TRAN & RUT Indices
200-Day MA DJ TRAN = 10,811 or 3.7% below DJ TRAN (max observed in last 7 yrs = 20.2%, min = -20.3%)
200-Day MA RUT = 1618 or 0.8% below RUT (max observed in last 7 yrs = 21.3%, min = -22.6%)
DJ Transportation Index (proxy for economic conditions 6 to 9 months hence) moved lower on Tuesday and Friday.
Russell 2000 Small Caps Index (proxy for Risk ON/OFF) sold off hard down to its 200-day MA. Is RISK still on, we think this week will be a great arbiter.
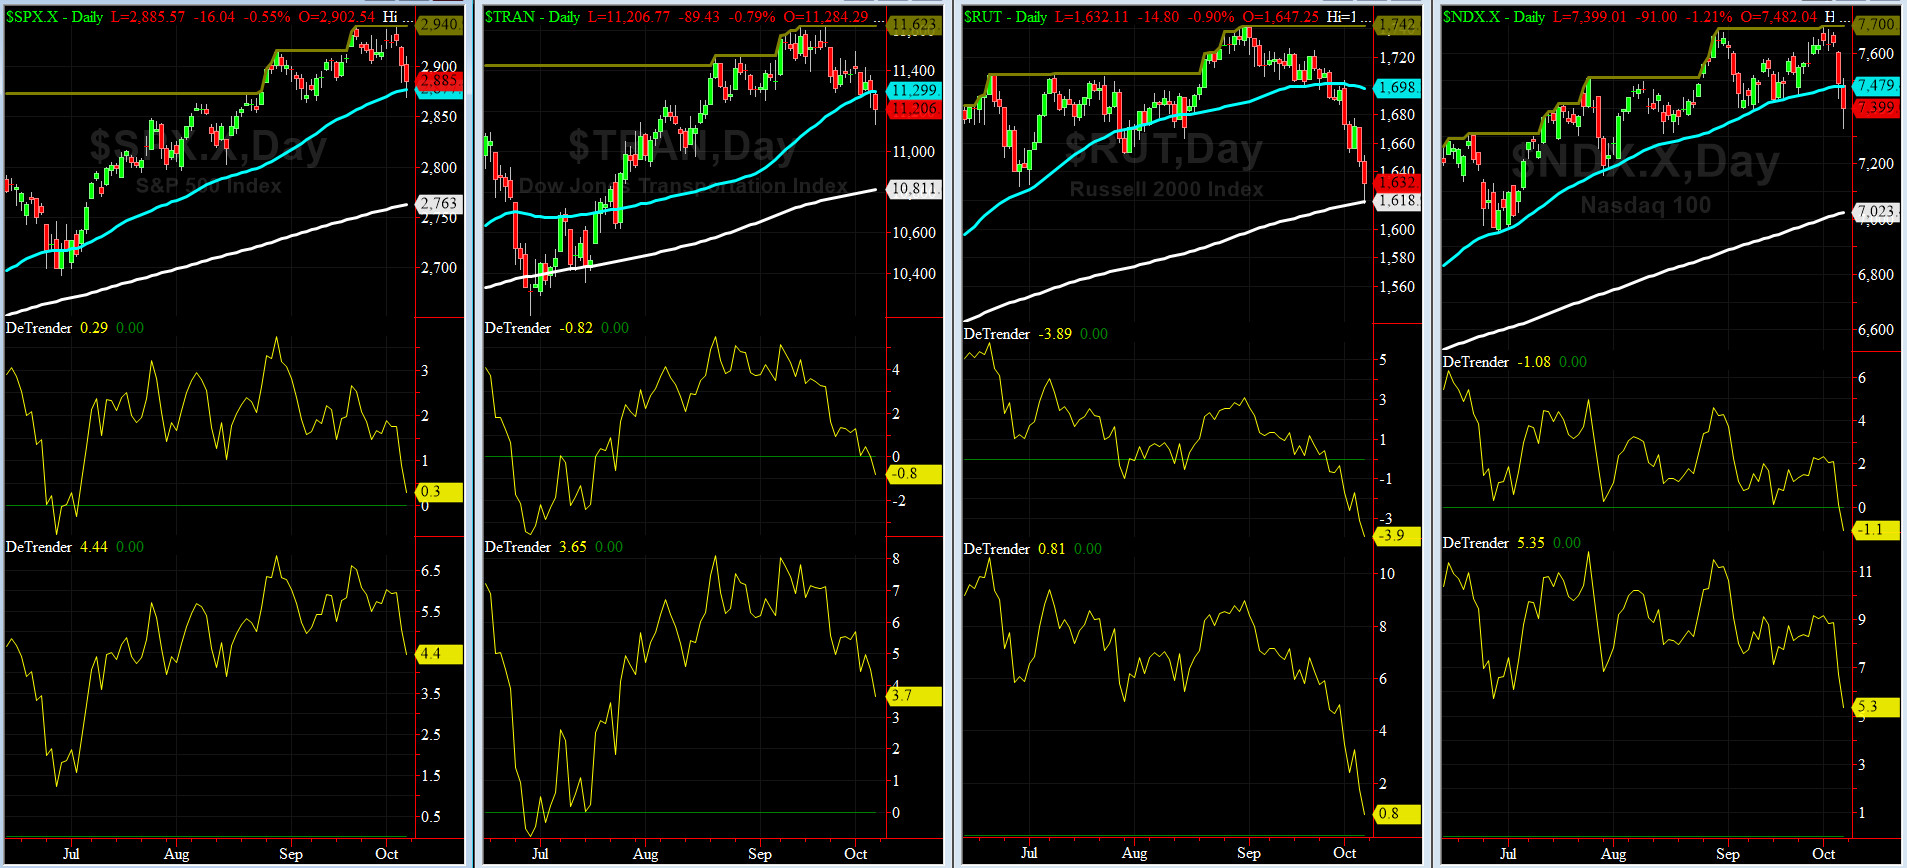
DeTrenders Charts for SPX, NDX, TRAN & RUT Indices
50-Day MA SPX = 2877 or 0.3% below SPX (max observed in last 7 yrs = +8.6%, min = -9.3%)
200-Day MA SPX = 2763 or 4.4% below SPX (max observed in last 7 yrs = 15.2%, min = -14%)
SIX of our EIGHT DeTrenders are in POSITIVE territory. The DeTrenders for DJ Tran & RUT will continue to be harbingers of future price behavior in broad indices.
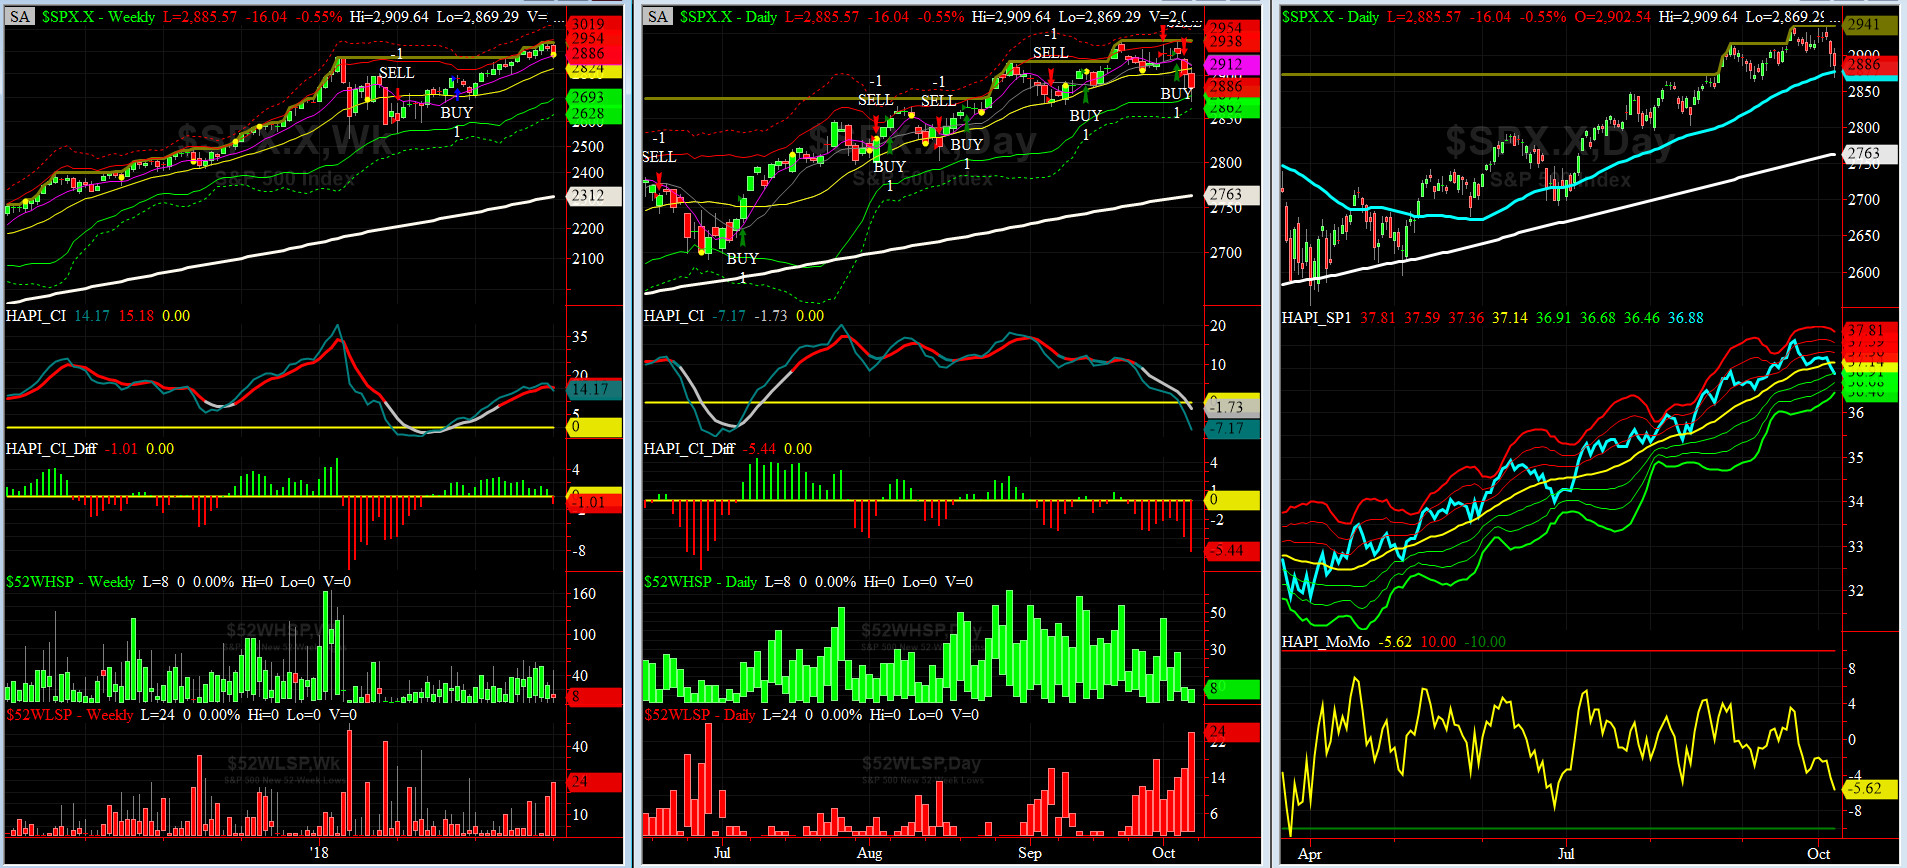
HA_SP1_Momo Chart
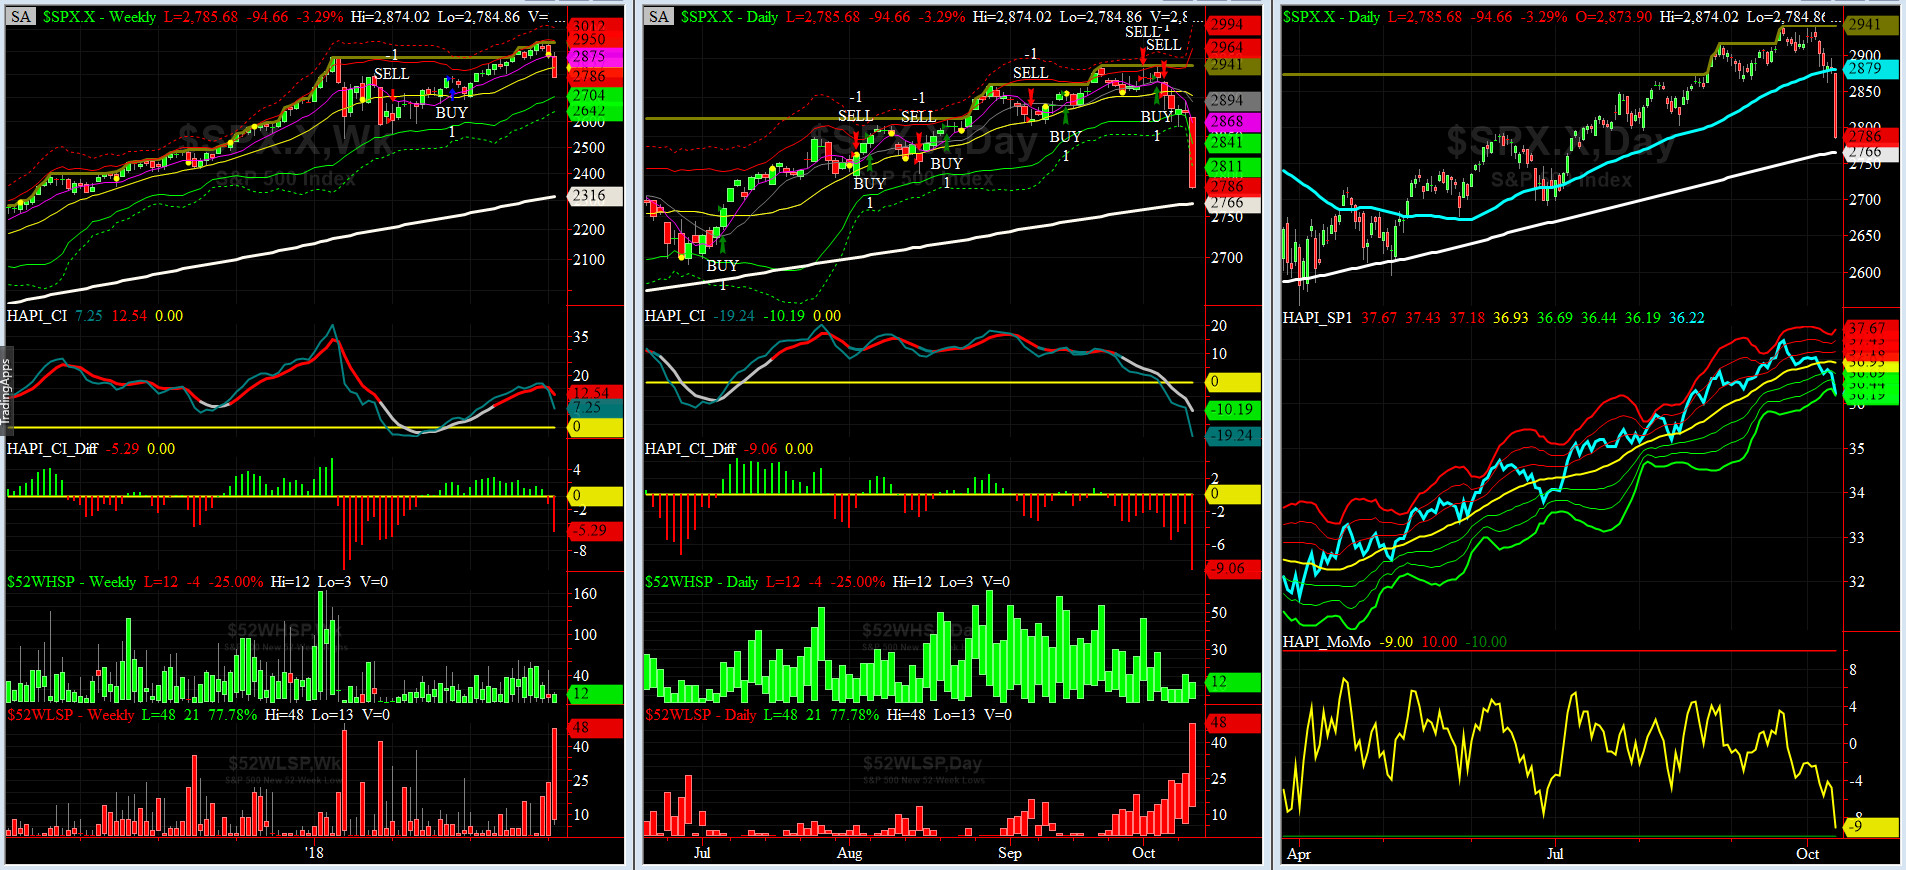
WEEKLY Timing Model = on a BUY Signal since Friday, June 15, 2018 CLOSE at 2779
DAILY Timing Model = on a SELL Signal since Thursday, October 4, 2018 CLOSE at 2901
Max SPX 52wk-highs reading last week = 30 (over 120-140, the local maxima is in)
Max SPX 52wk-Lows reading last week = 24 (over 40-60, the local minima is in)
HA_SP1 closed at its -1 sigma channels
HA_Momo = -5.6 (reversals most likely occur above +10 or below -10)
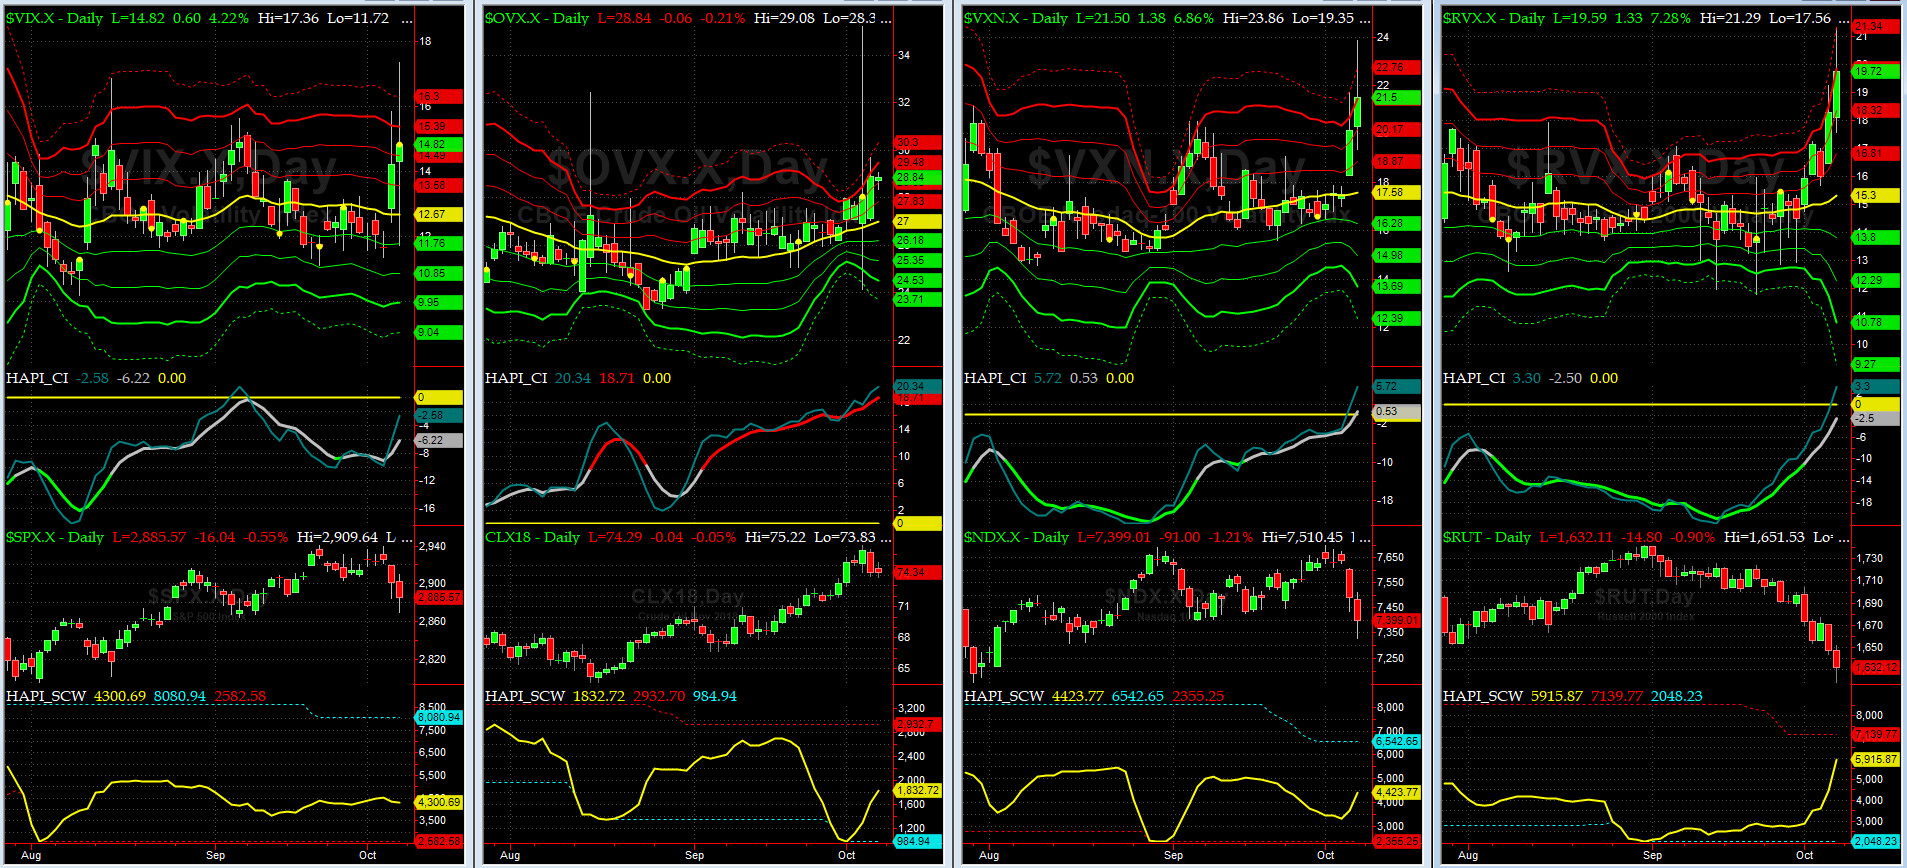
Vol of the Vols Chart
Spot VIX currently stands at 14.8, right about its +2.5 sigma (remember it's the VIX volatility pattern aka "its sigma channels" that matters, and not the level of VIX itself (this is per Dr. Robert Whaley, a great mentor and inventor of original VIX, now called VXO). VIX usually peaks around a test of its +4 sigma).
VIX & VXN both rallied hard to almost +5 sigma....now, it should pull back.
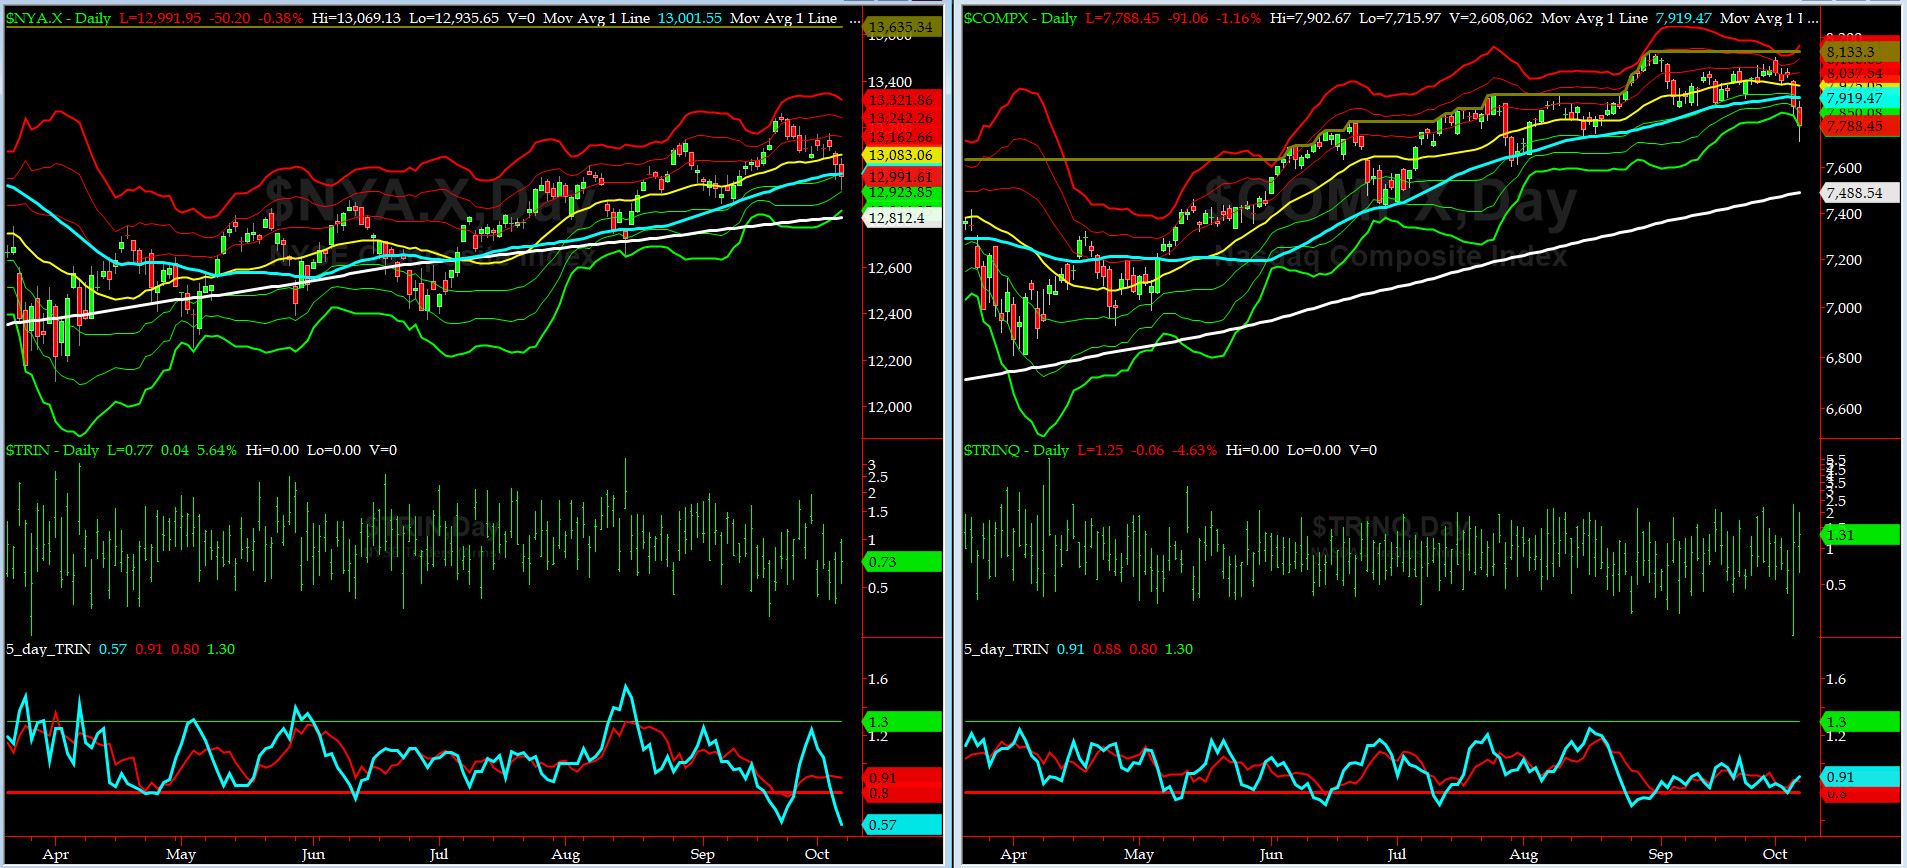
5-day TRIN & TRINQ Charts
NYSE 5-day TRIN is in **uber** OverBought zone while TRINQ (for NASDAQ) is in the Neutral zone.... note: again, given all other indicators, we have never seen this configuration before.
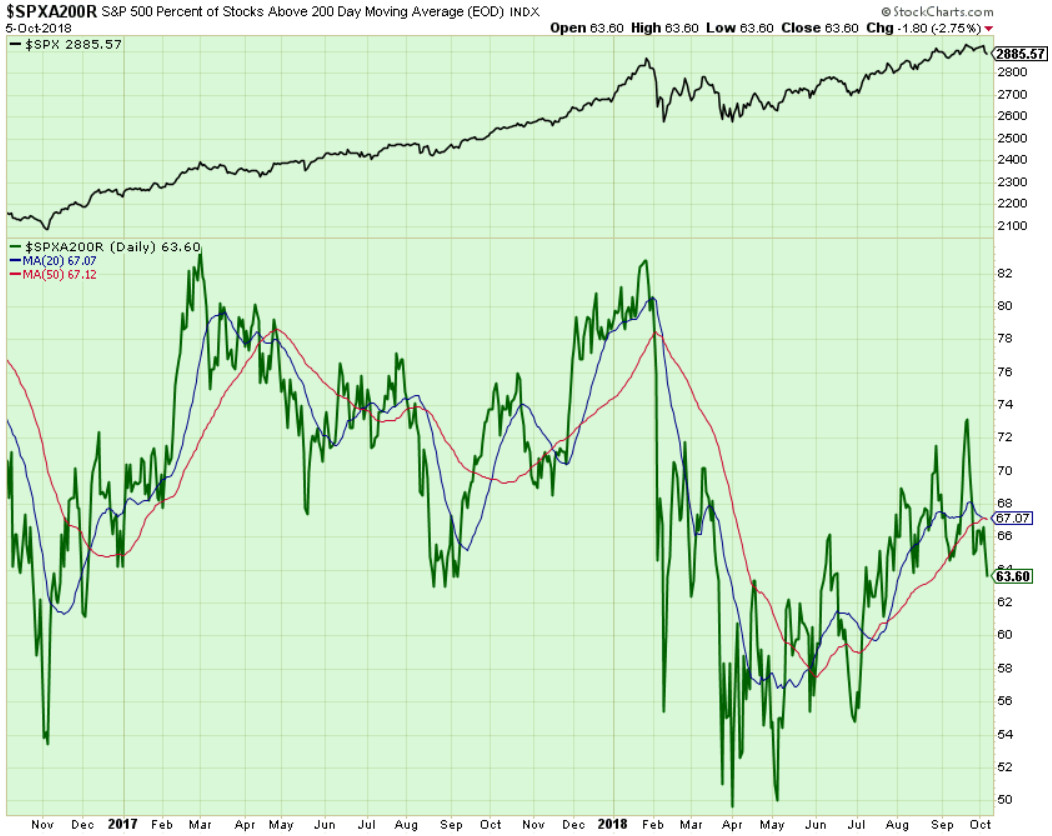
Components of SPX above their respective 200day MA Chart
This scoring indicator broke 64% this past week. Was the prior week a Bull Trap? YES. A breach of 62% is a very bad omen for this market. Only time will tell.

SPX SKEW (Tail Risk) Chart
On Friday, SPX SKEW (Tail Risk) closed near 130.3, a tad above its -3 sigma (normal = 120-125, range 100-150).
Is all quiet on the Eastern & Mid-Western Fronts? Our beloved @Capt_Tiko said YES....
How to interpret the value of SPX SKEW? (from CBOE white paper on SKEW)

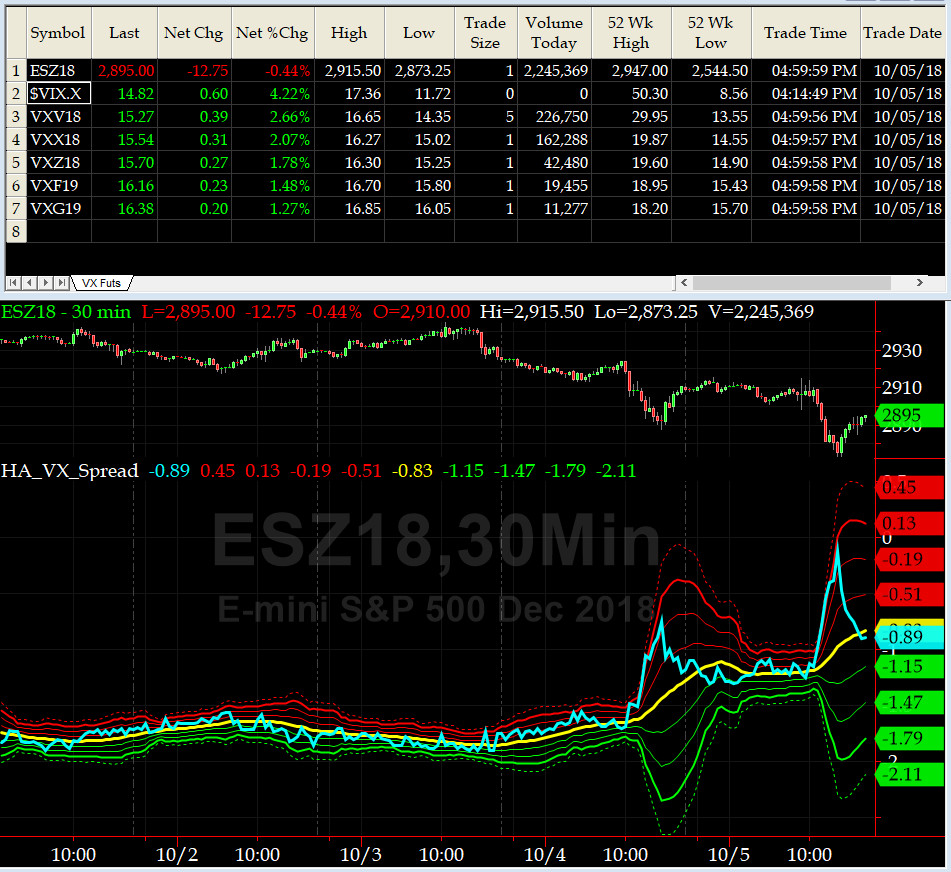
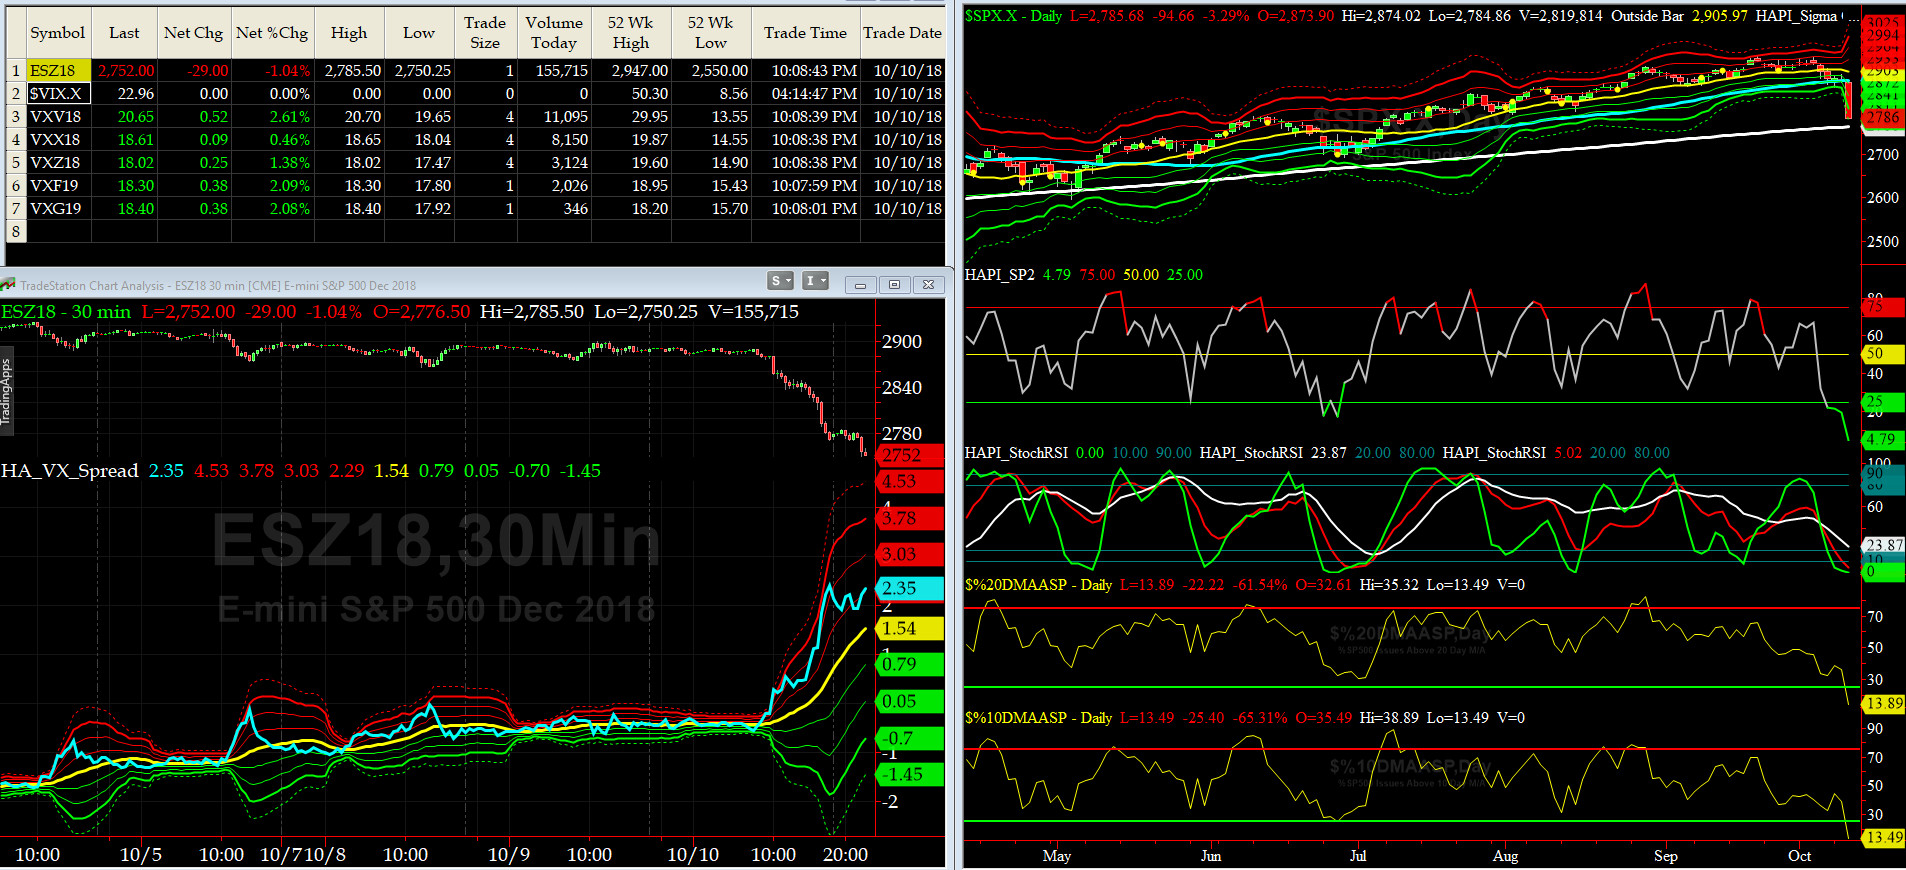
3-month VIX Futures Spread(VX) Chart
This popular timing indicator, (long OCT18, & short JAN19 VIX Futures) closed at -0.89. This reading is in the BULLISH zone.
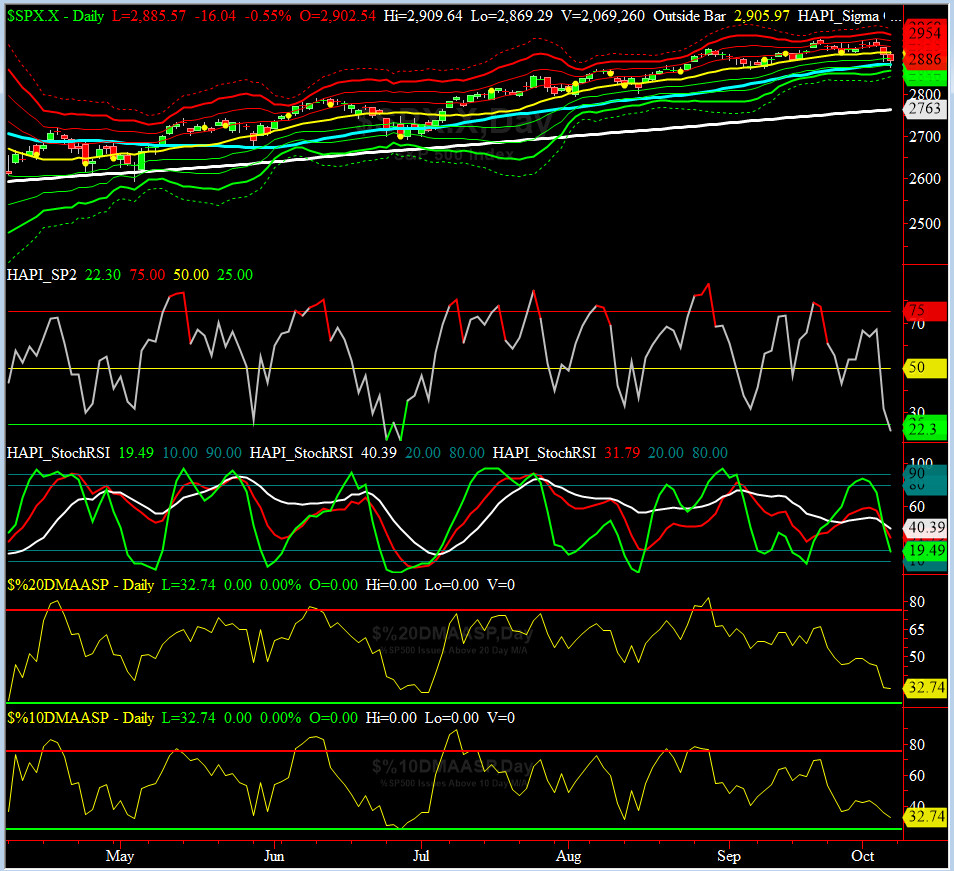
HA_SP2 Chart
HA_SP2 = 22.3 (Buy signal <= 25, Sell Signal >= 75)
Our coveted SP2 prop indicator has now entered its extreme OVERSOLD zone.
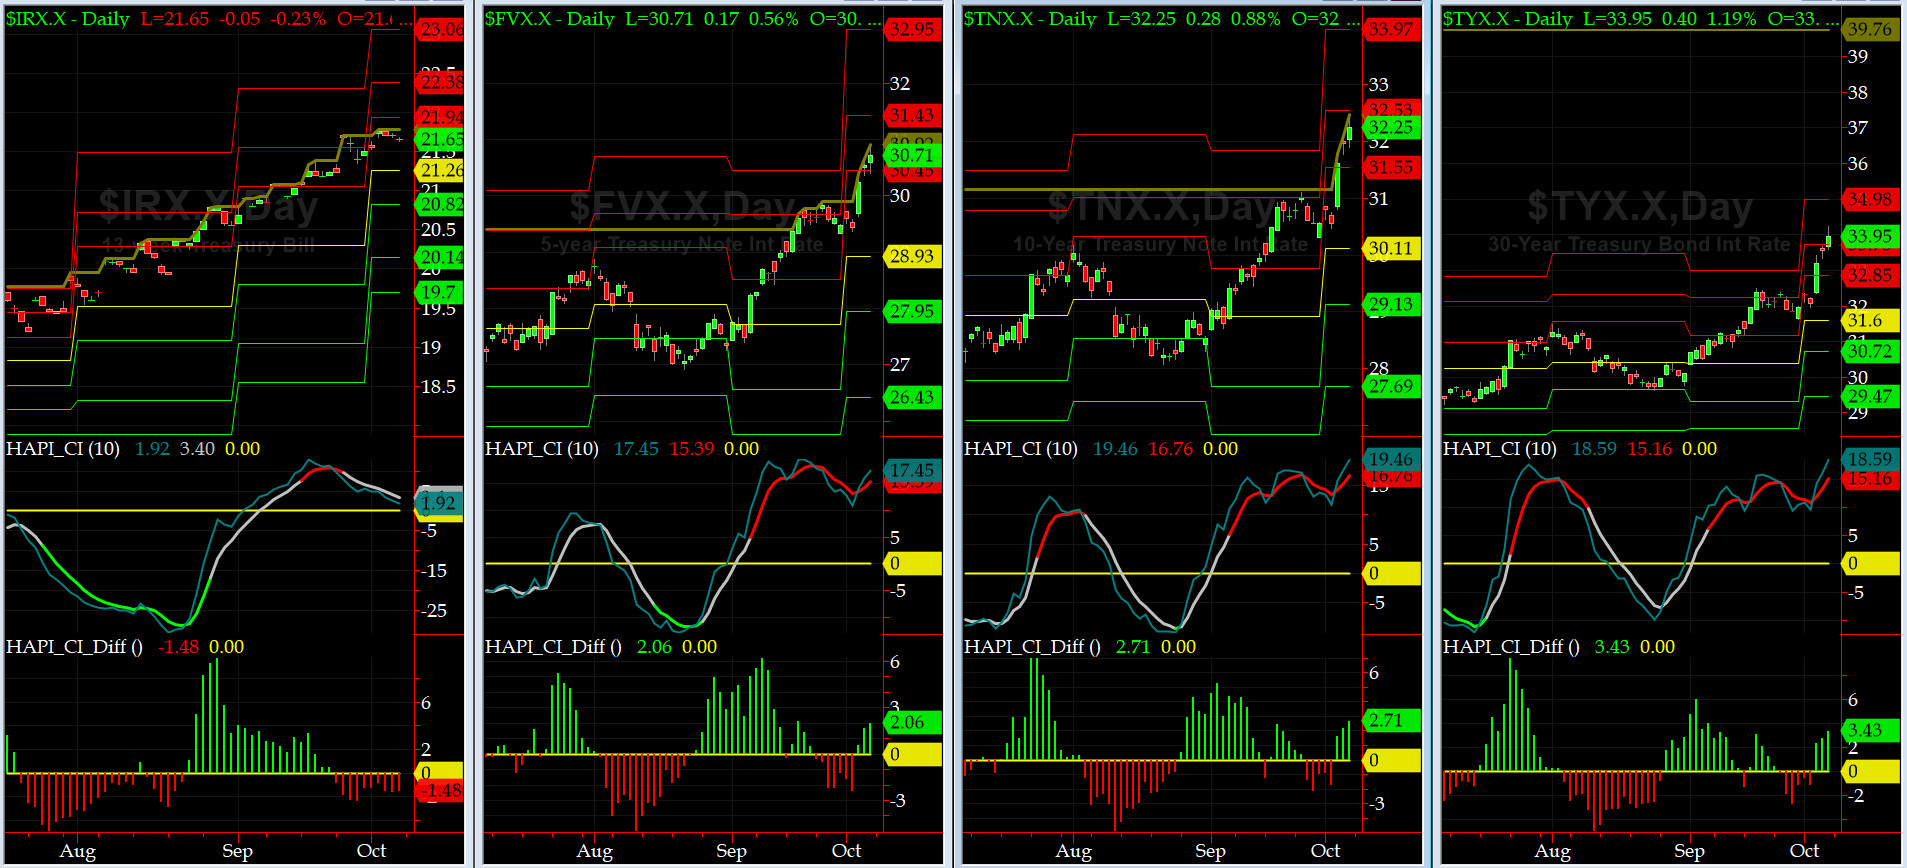
US Treasury T-Notes & T-Bonds Yields Chart
This past week all YTMs rallied very hard making new 7-yr highs across the Yield Curve. The Maurys are very happy, indeed.
Fari Hamzei
|


 Proactive Market Timing