
|
 |
 |
 |
 |
 |
 |
 |
 |
 Proactive Market Timing Proactive Market Timing
|
|
|
Most Recent PMT vs SPX Performance Chart

|
|
|
|
Friday, October 26, 2018, 0631ET
Notice of Change of Bias with Timer Digest
Dear Jim,
We have had internet issues all day yesterday � I will copy this to you on Gmail also.
Just confirming that you got my Change of Bias to SHORT SPX I sent you last night aournd 10pm Eastern.
Fari Hamzei
|
|
|
|
|
|
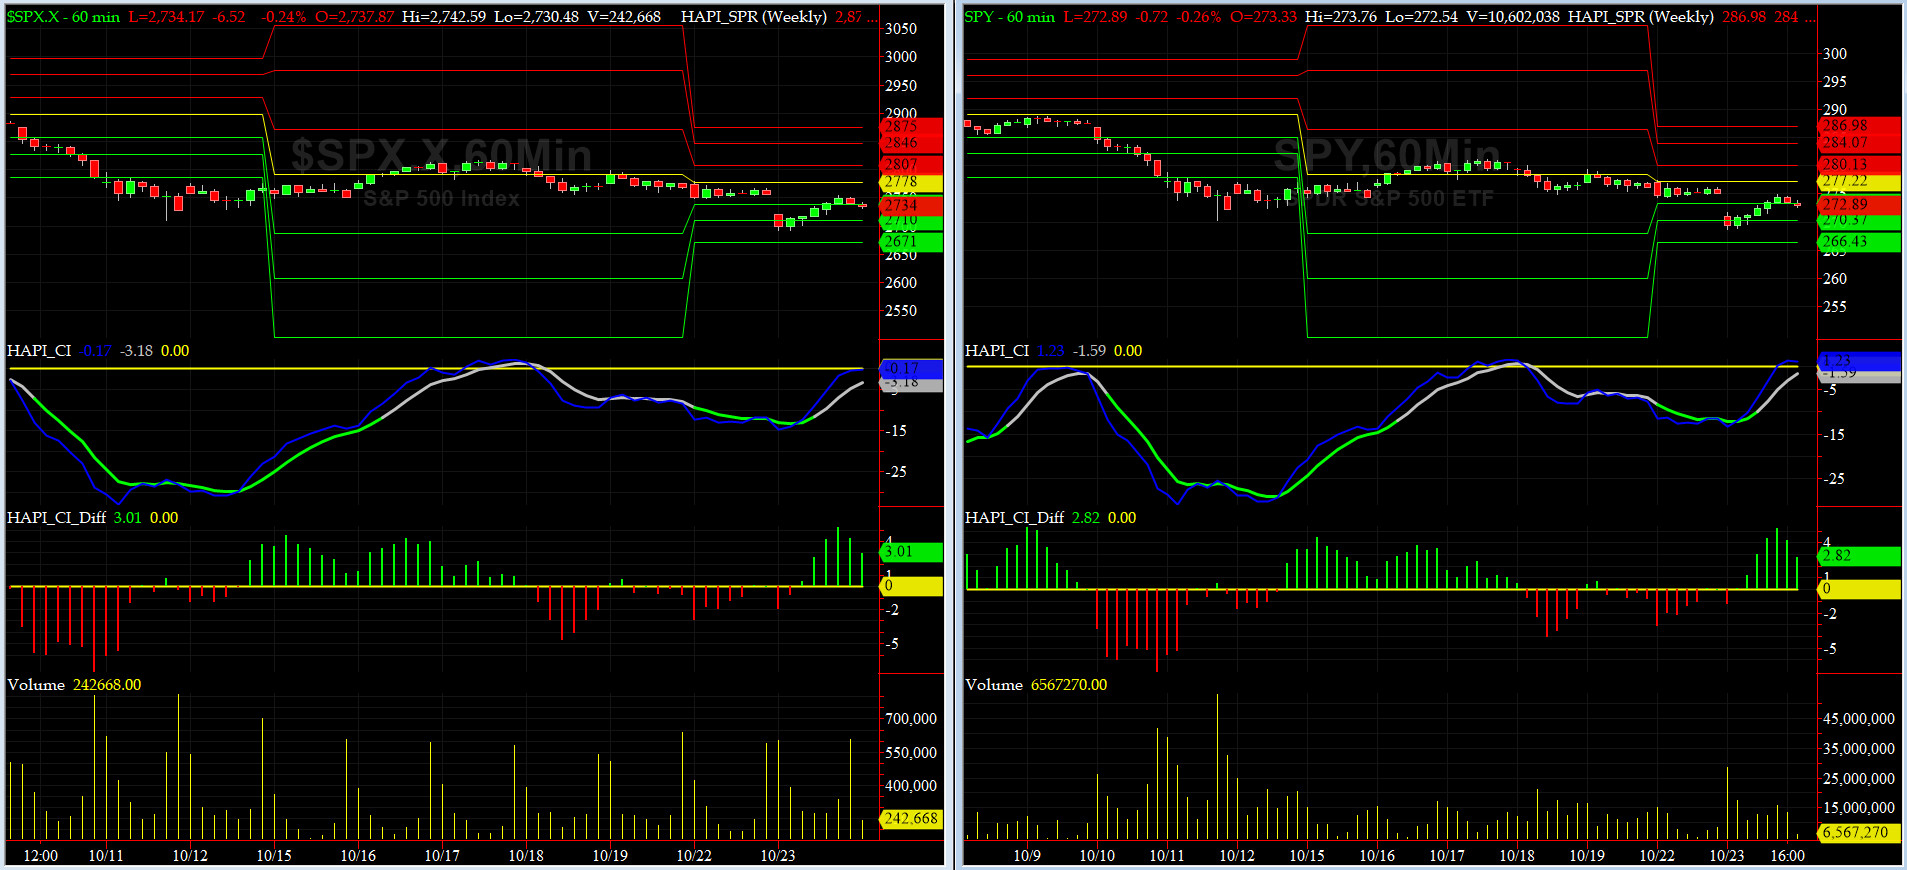
Thursday, October 25, 2018, 0935ET
SECOND UPDATE to Companion Chart for Market Bias Review, Issue #263
|
|
|
|
|
|
Thursday, October 25, 2018, 0932ET
SECOND UPDATE to Market Bias for Issue #263
Our current Market Bias with Timer Digest is LONG SPX as of OCT 23 at 2741
Our previous Market Bias was SHORT SPX as of OCT 17 at 2809
Here are the trade parameters for this week:
SPX Secondary Profit Target for last 20% of our position = 2720
SPX Primary Profit Target for first 80% of our position = 2700
SPX BreakEven Stop (Today's Open) for last 20% of our position = 2675
SPX Money Management Stop for 100% of our position = 2660
|
| Action |
Asset |
Expiration |
Strike |
Option |
| BUY |
SPY |
Friday NOV 2 |
268 |
Calls |
| SELL SHORT |
SPY |
Friday NOV 2 |
272 |
Calls |
| You need to execute both legs and hold it as a Call-Spread.
|
Note A:
Once the Primary Profit Target has been reached, traders are advised to close 80% of their position in order to lock in profits. The remaining balance can be carried over with a BreakEven STOP, based on the SPX level at the time of entry, in order to make the trade a zero-risk trade with the final position running to reach the Secondary Profit Target.
Once either Secondary Profit or Money Management (BreakEven STOP after the 80% peel-off) is hit, our Option/ETF trade for that week is over. Go to Cash and wait for the next PMT Issue.
Note B:
When we change our Market Bias with Timer Digest, You need to go FLAT asap. With PMT Pro, that is before the Close that day and with the basic PMT, at the open of the next day. The following trading day, we will issue new SPX targets and a new SPY options trade, as long our new market bias with Timer Digest is NOT flat.
Fari Hamzei
|
|
|
|
|
|
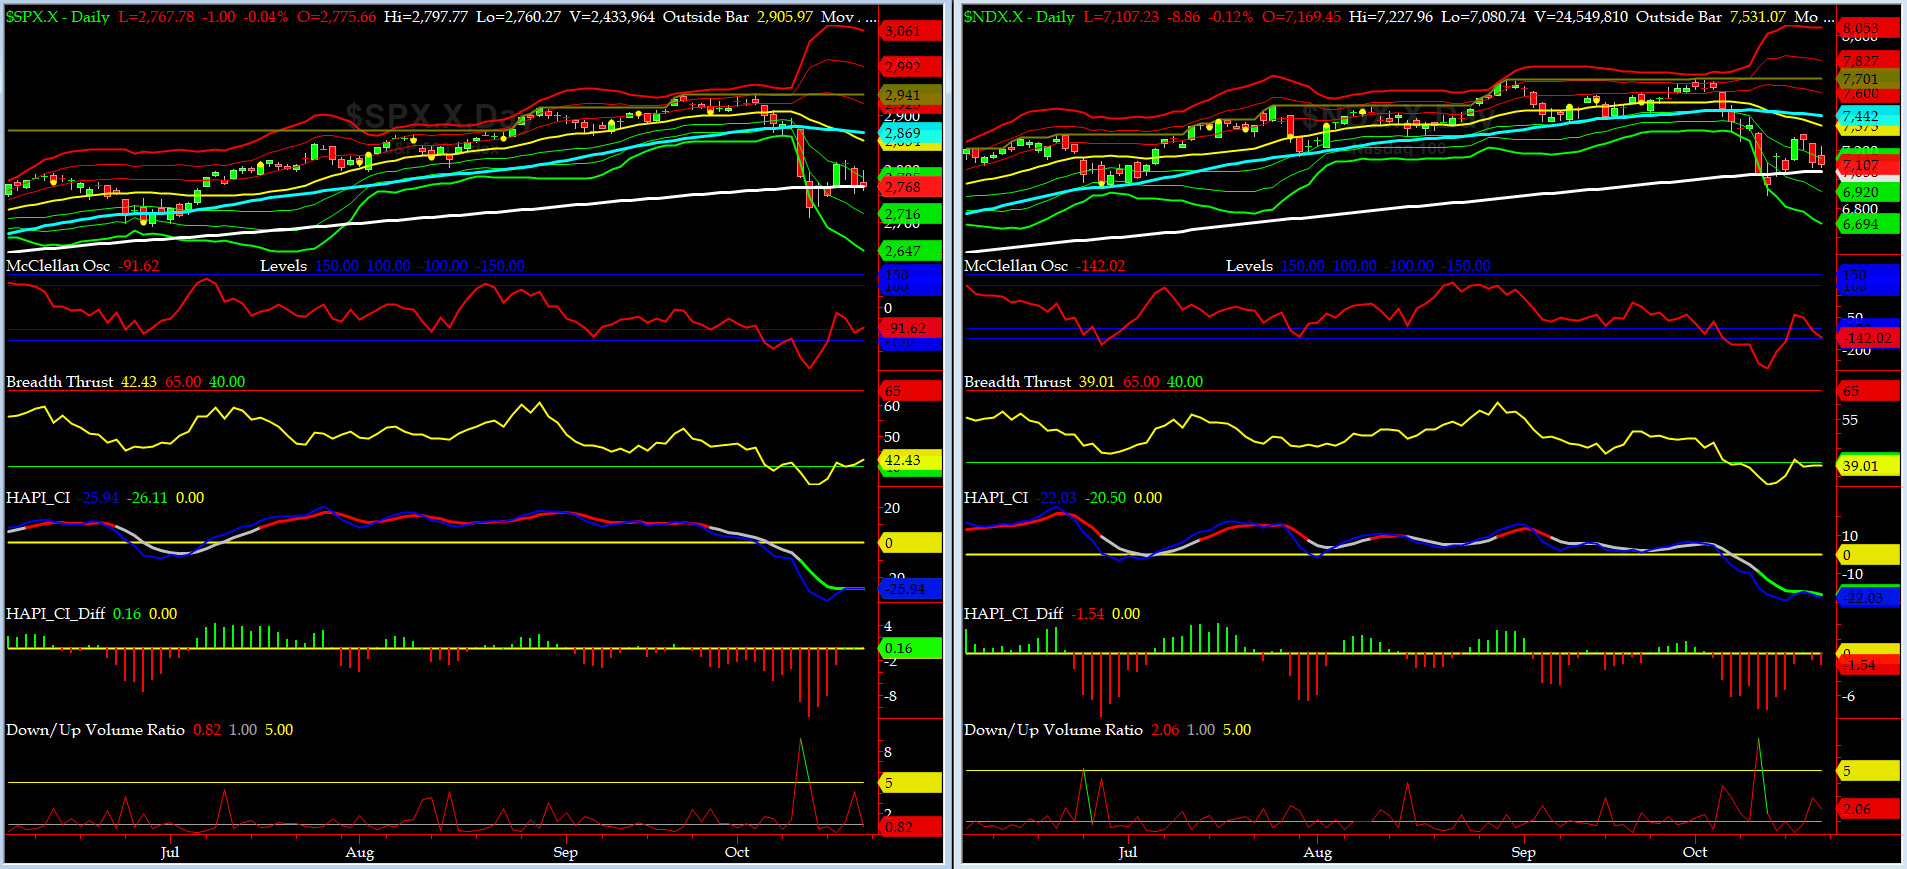
Thursday, October 25, 2018, 0840ET
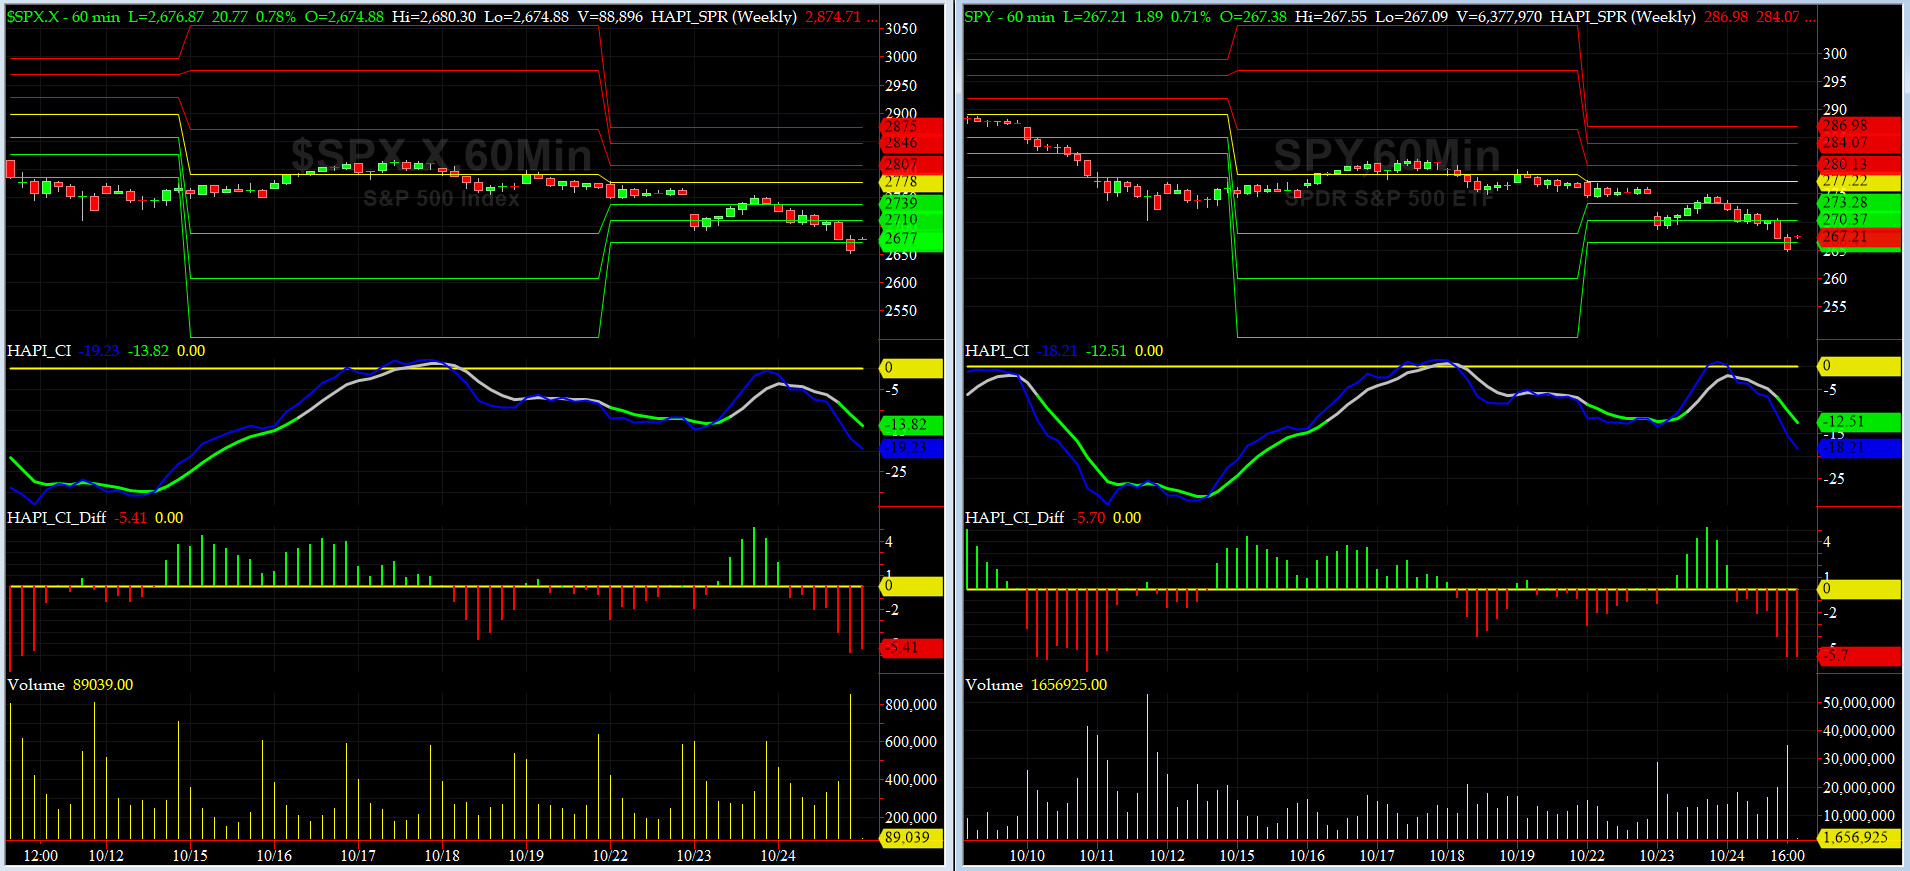
UPDATED Market Timing Charts for Issue #263
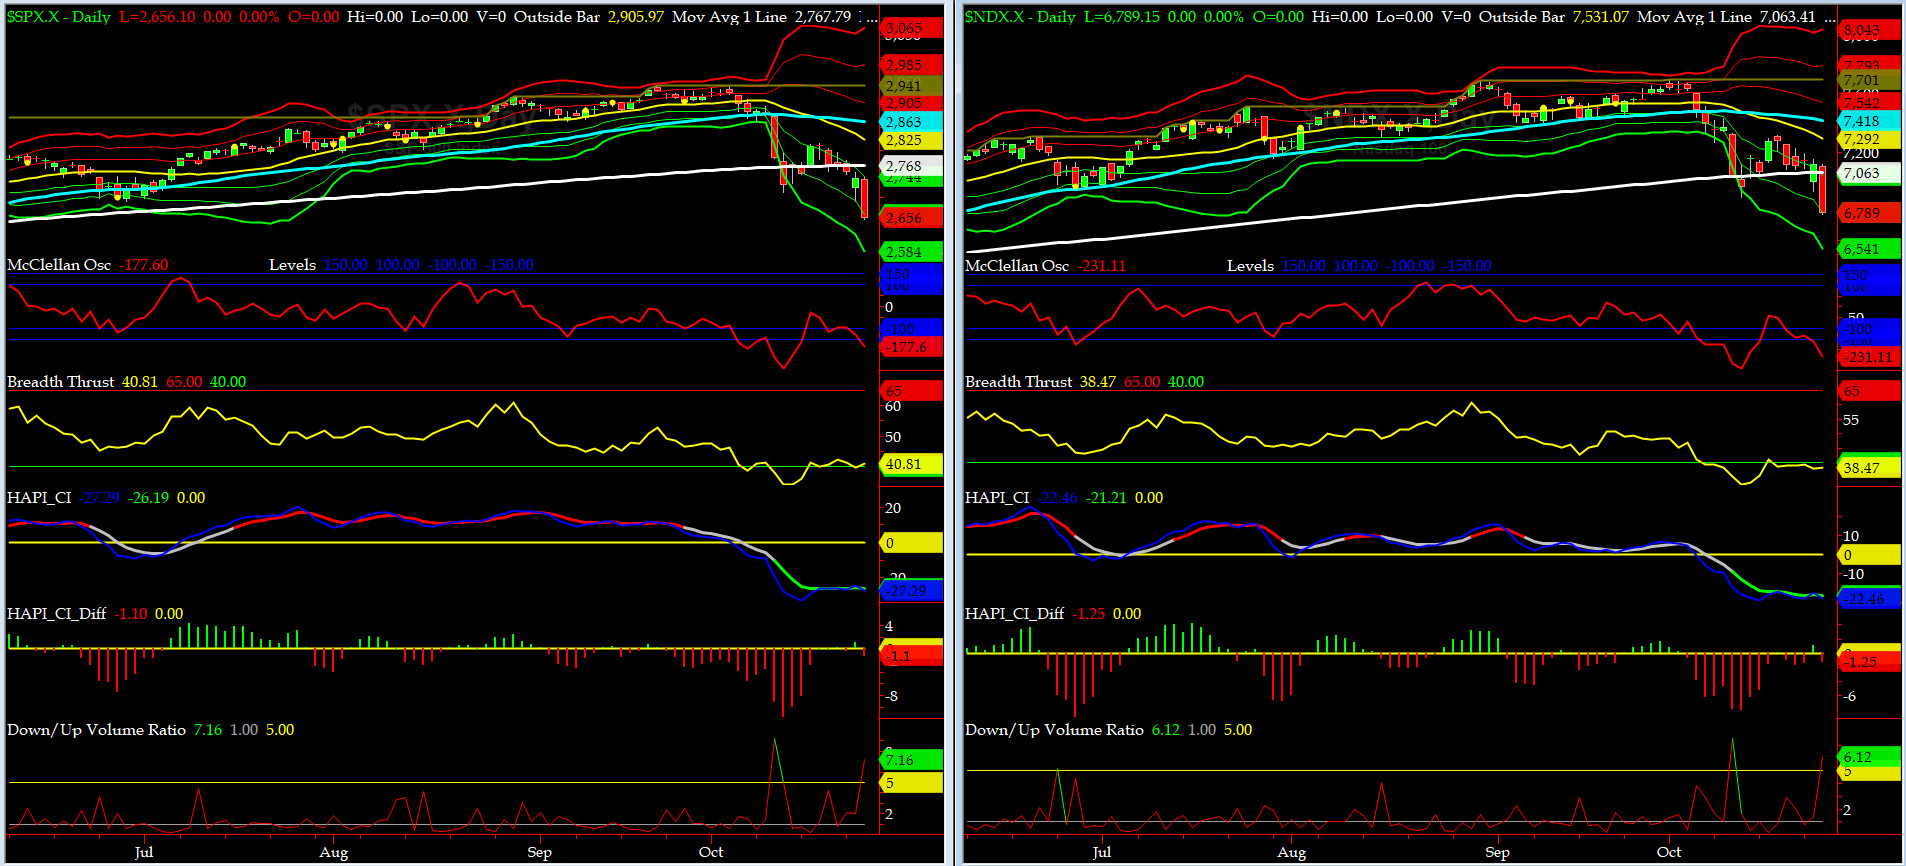
Timer Charts of S&P-500 Cash Index (SPX) + NASDAQ-100 Cash Index (NDX)
As you can see from the three charts posted today, we were already in an uber oversold conditions Tuesday night. Yesterday's market action was purely news driven by unquantifiable fear of local, home-brewed, political terrorism and market participants had to shoot first and court-martial the combatants later.
WE STAND BY OUR BULLISH CALL of Tuesday and we will issue a trade shortly.
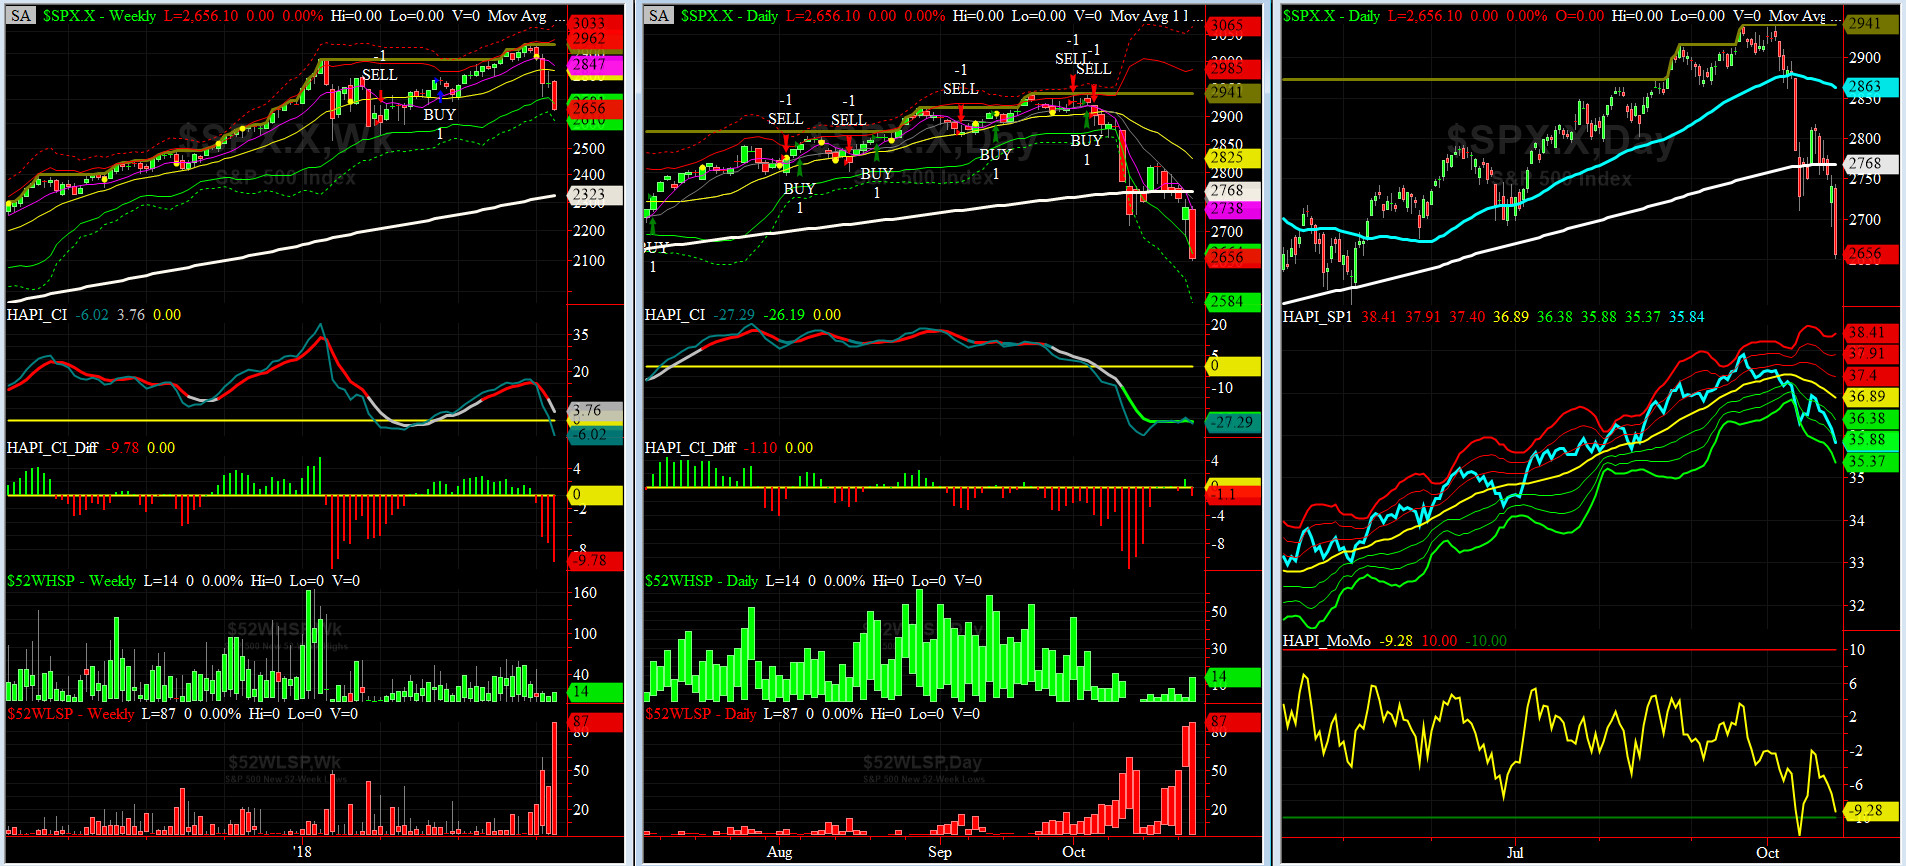
HA_SP1_Momo Chart
WEEKLY Timing Model = on a BUY Signal since Friday, June 15, 2018 CLOSE at 2779
DAILY Timing Model = on a SELL Signal since Thursday, October 4, 2018 CLOSE at 2901
Max SPX 52wk-highs reading last week = 14 (over 120-140, the local maxima is in)
Max SPX 52wk-Lows reading last week = 87 (over 40-60, the local minima is in)
HA_SP1 closed at its -2 sigma channels
HA_Momo = -9.3 (reversals most likely occur above +10 or below -10)
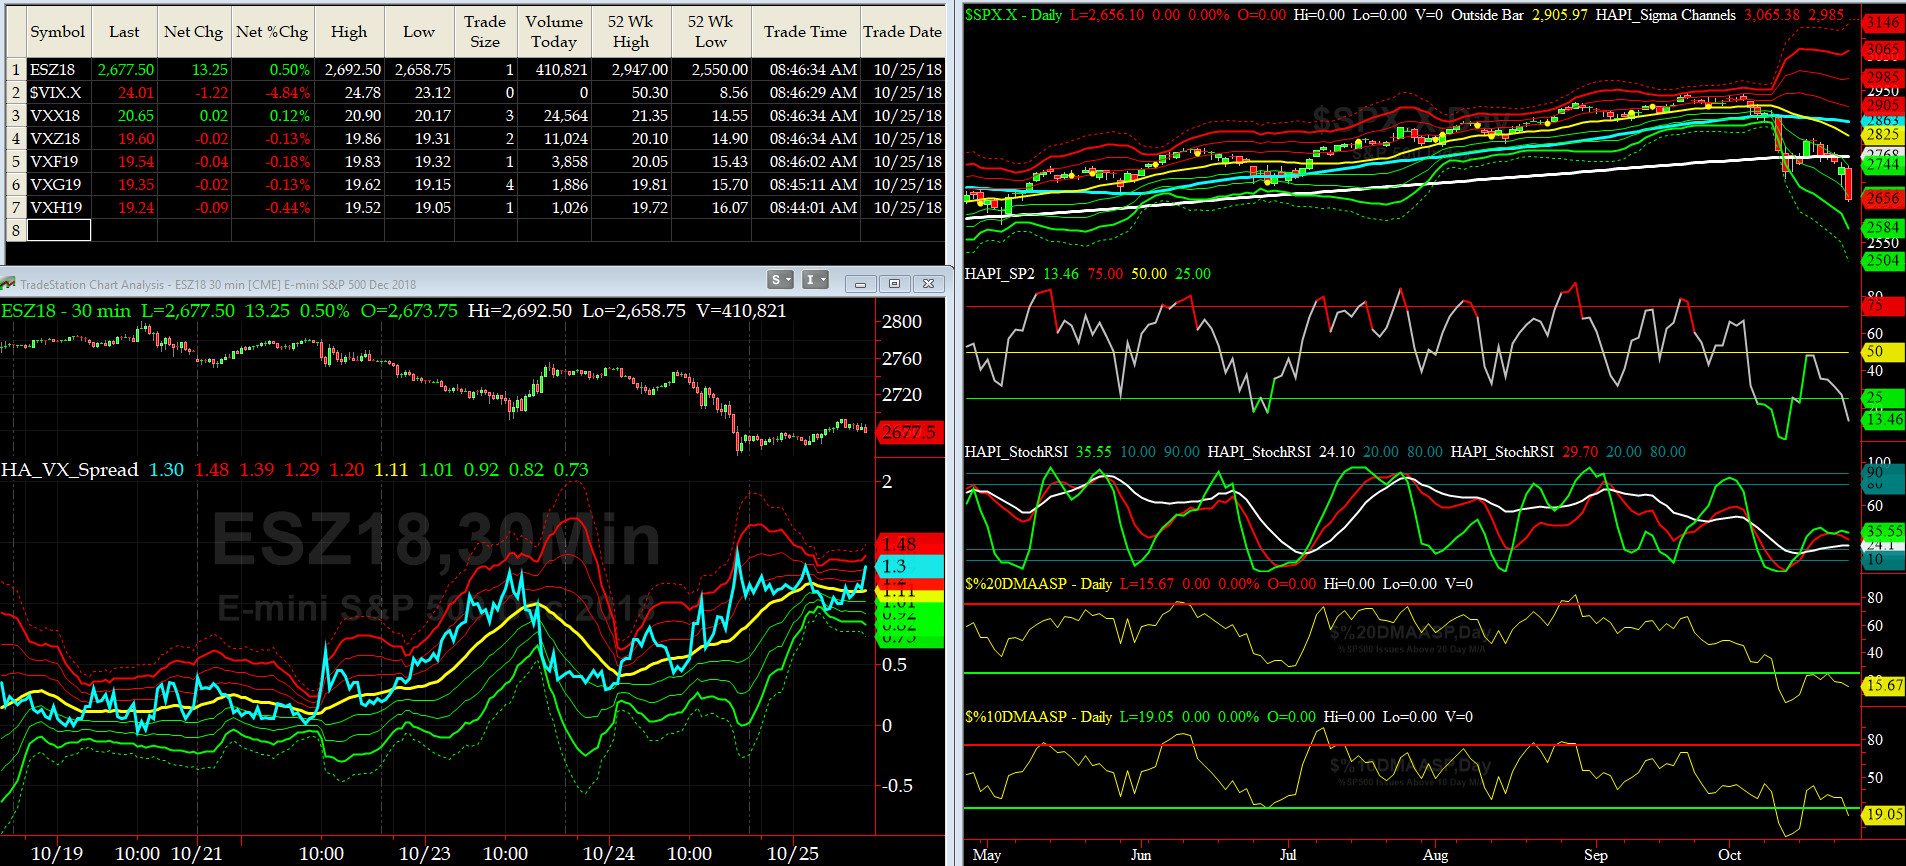
VX Futures and HA_SP2 Charts
|
|
|
|
|
|
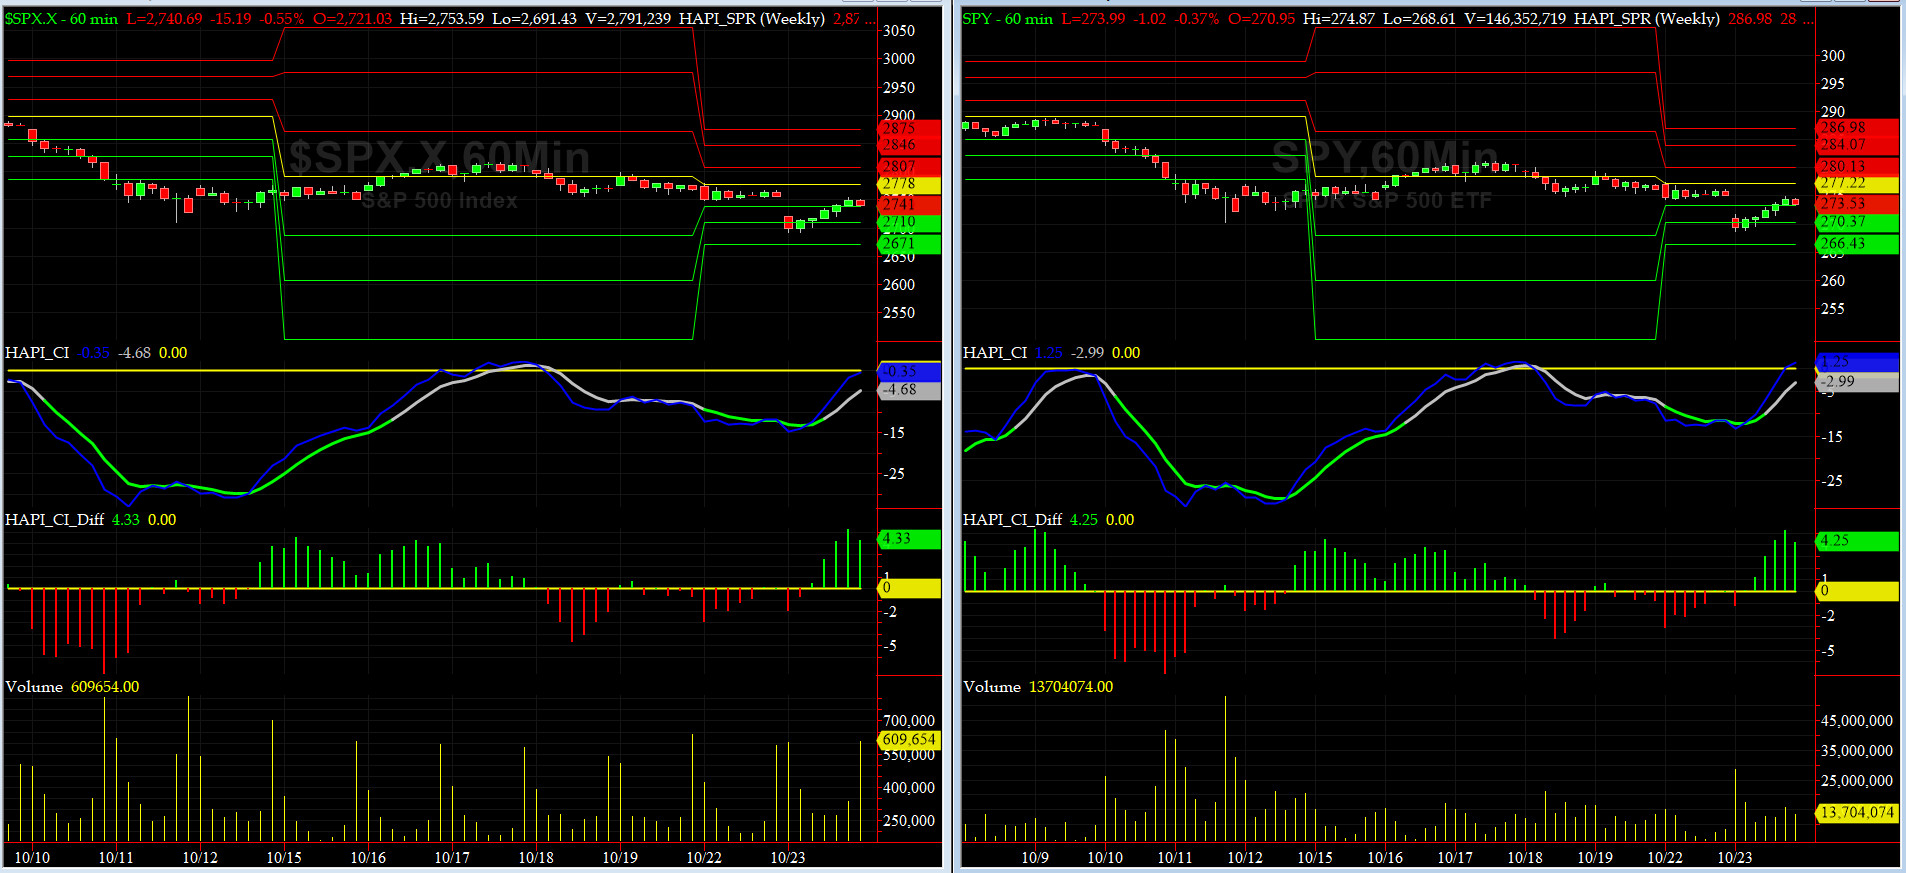
Wednesday, October 24, 2018, 1005ET
UPDATED Companion Chart for Market Bias Review, Issue #263
|
|
|
|
|
|
Wednesday, October 24, 2018, 1000ET
UPDATED Market Bias for Issue #263
Our current Market Bias with Timer Digest is LONG SPX as of OCT 23 at 2741
Our previous Market Bias was SHORT SPX as of OCT 17 at 2809
Here are the trade parameters for this week:
SPX Secondary Profit Target for last 20% of our position = 2795
SPX Primary Profit Target for first 80% of our position = 2770
SPX BreakEven Stop (Today's Open) for last 20% of our position = 2738
SPX Money Management Stop for 100% of our position = 2720
|
| Action |
Asset |
Expiration |
Strike |
Option |
| BUY |
SPY |
Friday NOV 2 |
274 |
Calls |
| SELL SHORT |
SPY |
Friday NOV 2 |
279 |
Calls |
| You need to execute both legs and hold it as a Call-Spread.
|
Note A:
Once the Primary Profit Target has been reached, traders are advised to close 80% of their position in order to lock in profits. The remaining balance can be carried over with a BreakEven STOP, based on the SPX level at the time of entry, in order to make the trade a zero-risk trade with the final position running to reach the Secondary Profit Target.
Once either Secondary Profit or Money Management (BreakEven STOP after the 80% peel-off) is hit, our Option/ETF trade for that week is over. Go to Cash and wait for the next PMT Issue.
Note B:
When we change our Market Bias with Timer Digest, You need to go FLAT asap. With PMT Pro, that is before the Close that day and with the basic PMT, at the open of the next day. The following trading day, we will issue new SPX targets and a new SPY options trade, as long our new market bias with Timer Digest is NOT flat.
Fari Hamzei
|
|
|
|
|
|
Wednesday, October 24, 2018, 0006ET
Notice of Change of Bias with Timer Digest
Dear Jim,
Around mid-day today, a number of our prop market timing indicators started flashing short-term BUY signals. We realize this could be a tad premature, but in modern air combat, you must trust your indicators.
These last 4 days were a fast 68-handle net gain in SPX. Cheers�..
Fari Hamzei
|
|
|
|
|
|
Monday, October 22, 2018, 1020ET
Companion Chart for Market Bias Review, Issue #263
|
|
|
|
|
|
Monday, October 22, 2018, 1015ET
Market Bias for Issue #263
Timer Digest is SHORT SPX as of OCT 17 at 2809
Our previous Market Bias was LONG SPX as of SEP 28 at 2914
Here are the trade parameters for this week:
SPX Money Management Stop for 100% of our position = 2780
SPX BreakEven Stop (Today's Open) for last 20% of our position = 2774
SPX Primary Profit Target for first 80% of our position = 2700
SPX Secondary Profit Target for last 20% of our position = 2650
|
| Action |
Asset |
Expiration |
Strike |
Option |
| BUY |
SPY |
Friday NOV 9 |
273 |
Puts |
| SELL SHORT |
SPY |
Friday NOV 9 |
267 |
Puts |
| You need to execute both legs and hold it as a Put-Spread.
|
Note A:
Once the Primary Profit Target has been reached, traders are advised to close 80% of their position in order to lock in profits. The remaining balance can be carried over with a BreakEven STOP, based on the SPX level at the time of entry, in order to make the trade a zero-risk trade with the final position running to reach the Secondary Profit Target.
Once either Secondary Profit or Money Management (BreakEven STOP after the 80% peel-off) is hit, our Option/ETF trade for that week is over. Go to Cash and wait for the next PMT Issue.
Note B:
When we change our Market Bias with Timer Digest, You need to go FLAT asap. With PMT Pro, that is before the Close that day and with the basic PMT, at the open of the next day. The following trading day, we will issue new SPX targets and a new SPY options trade, as long our new market bias with Timer Digest is NOT flat.
Fari Hamzei
|
|
|
|
|
|
Saturday, October 20, 2018, 2100ET
Market Timing Charts, Analysis & Commentary for Issue #263
Timer Charts of S&P-500 Cash Index (SPX) + NASDAQ-100 Cash Index (NDX)
Most recent S&P-500 Cash Index (SPX): 2768 up +17 (down -0.62%) for the week ending on Friday, October 19, 2018, which closed just below its -1 sigma.
DJIA ALL TIME INTRADAY HIGH = 26951 (reached on Wednesday, October 3, 2018)
DJ TRAN ALL TIME INTRADAY HIGH = 11623 (reached on Friday, September 14, 2018)
SPX ALL TIME INTRADAY HIGH = 2941 (reached on Friday, September 21, 2018)
NDX ALL TIME INTRADAY HIGH = 7700 (reached on Thursday, October 1, 2018)
RUT ALL TIME INTRADAY HIGH = 1742 (reached on Friday, August 31, 2018)
Current DAILY +2 Sigma SPX = 2992 with WEEKLY +2 Sigma = 2948
Current DAILY 0 Sigma SPX = 2854 with WEEKLY 0 Sigma = 2828
Current DAILY -2 Sigma SPX = 2716 with WEEKLY -2 Sigma = 2707
NYSE McClellan Oscillator = -92 (-150 is start of the O/S area; around -275 to -300 area or lower, we go into the �launch-pad� mode; over +150, we are in O/B area)
NYSE Breadth Thrust = 42.4 (40 is considered as oversold and 65 as overbought)
Tuesday was a big day to the upside for SPX but then we sold off three days in a row. I expect a tough open Sunday night on Globex and Monday morning gap-down.
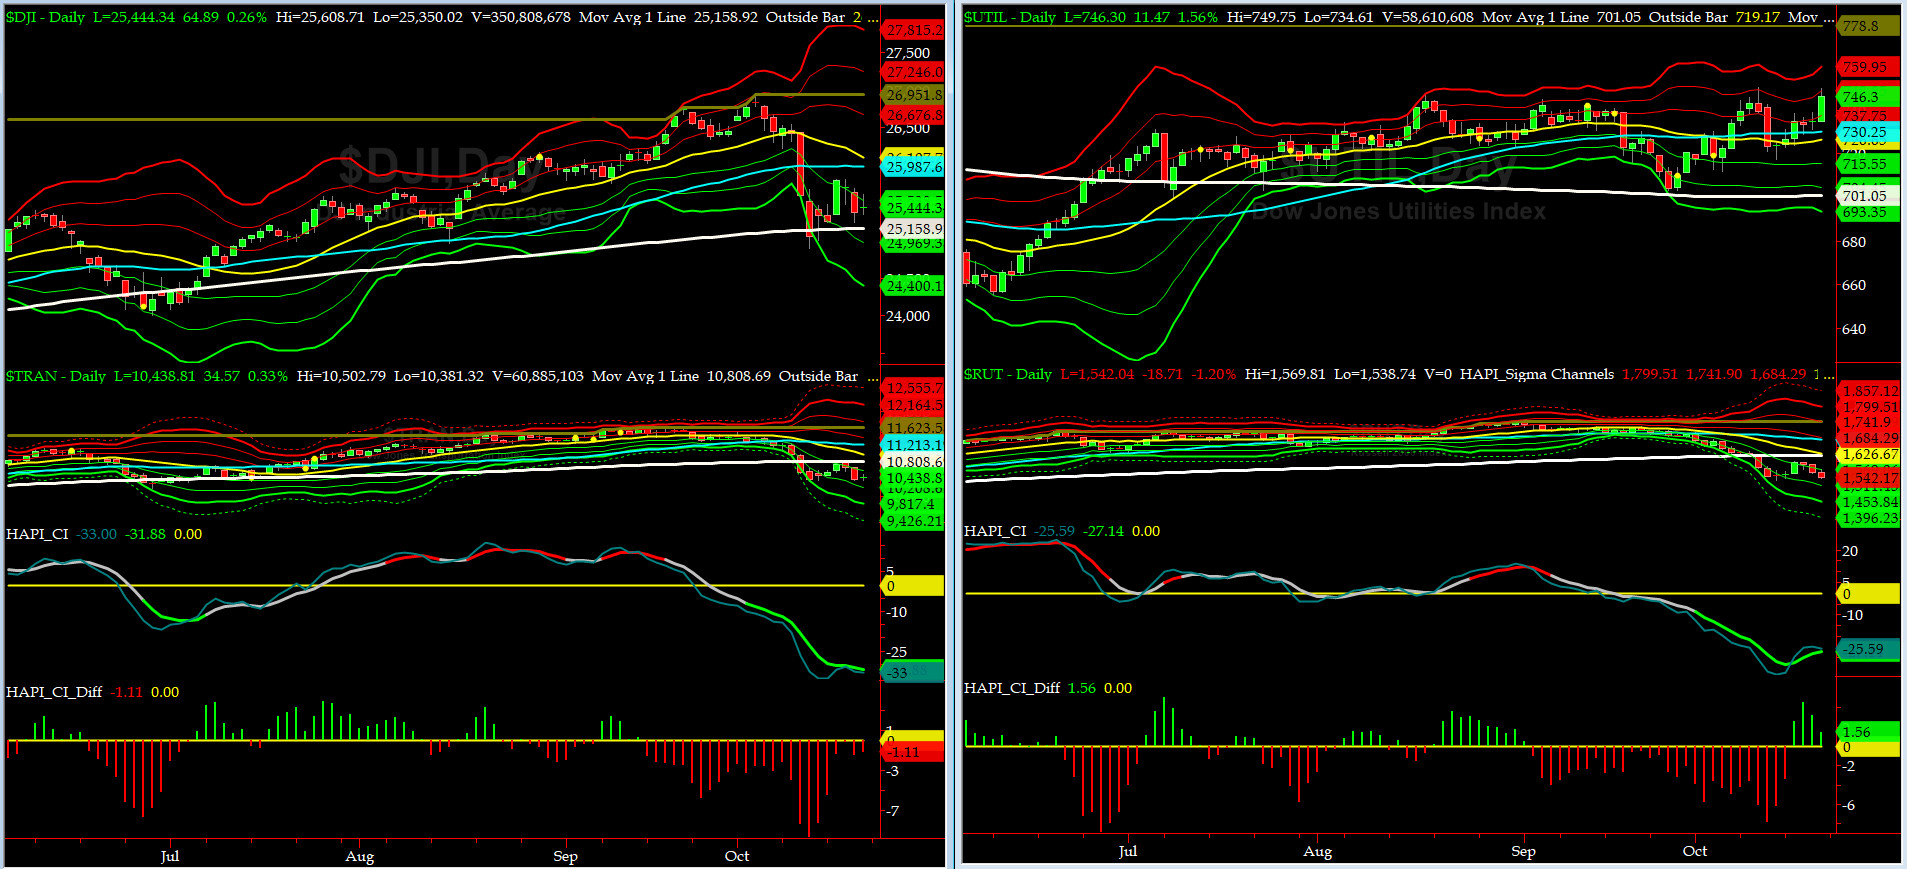
Canaries [in the Coal Mine] Chart for DJ TRAN & RUT Indices
200-Day MA DJ TRAN = 10,808 or 3.4% ABOVE DJ TRAN (max observed in last 7 yrs = 20.2%, min = -20.3%)
200-Day MA RUT = 1620 or 4.8% ABOVE RUT (max observed in last 7 yrs = 21.3%, min = -22.6%)
DJ Transportation Index (proxy for economic conditions 6 to 9 months hence) had another tough week which included a failure to punch thru and close above its crucial 200-day MA.
Russell 2000 Small Caps Index (proxy for Risk ON/OFF) did even worse: could not even reach its 200-day MA. RISK is OFF.
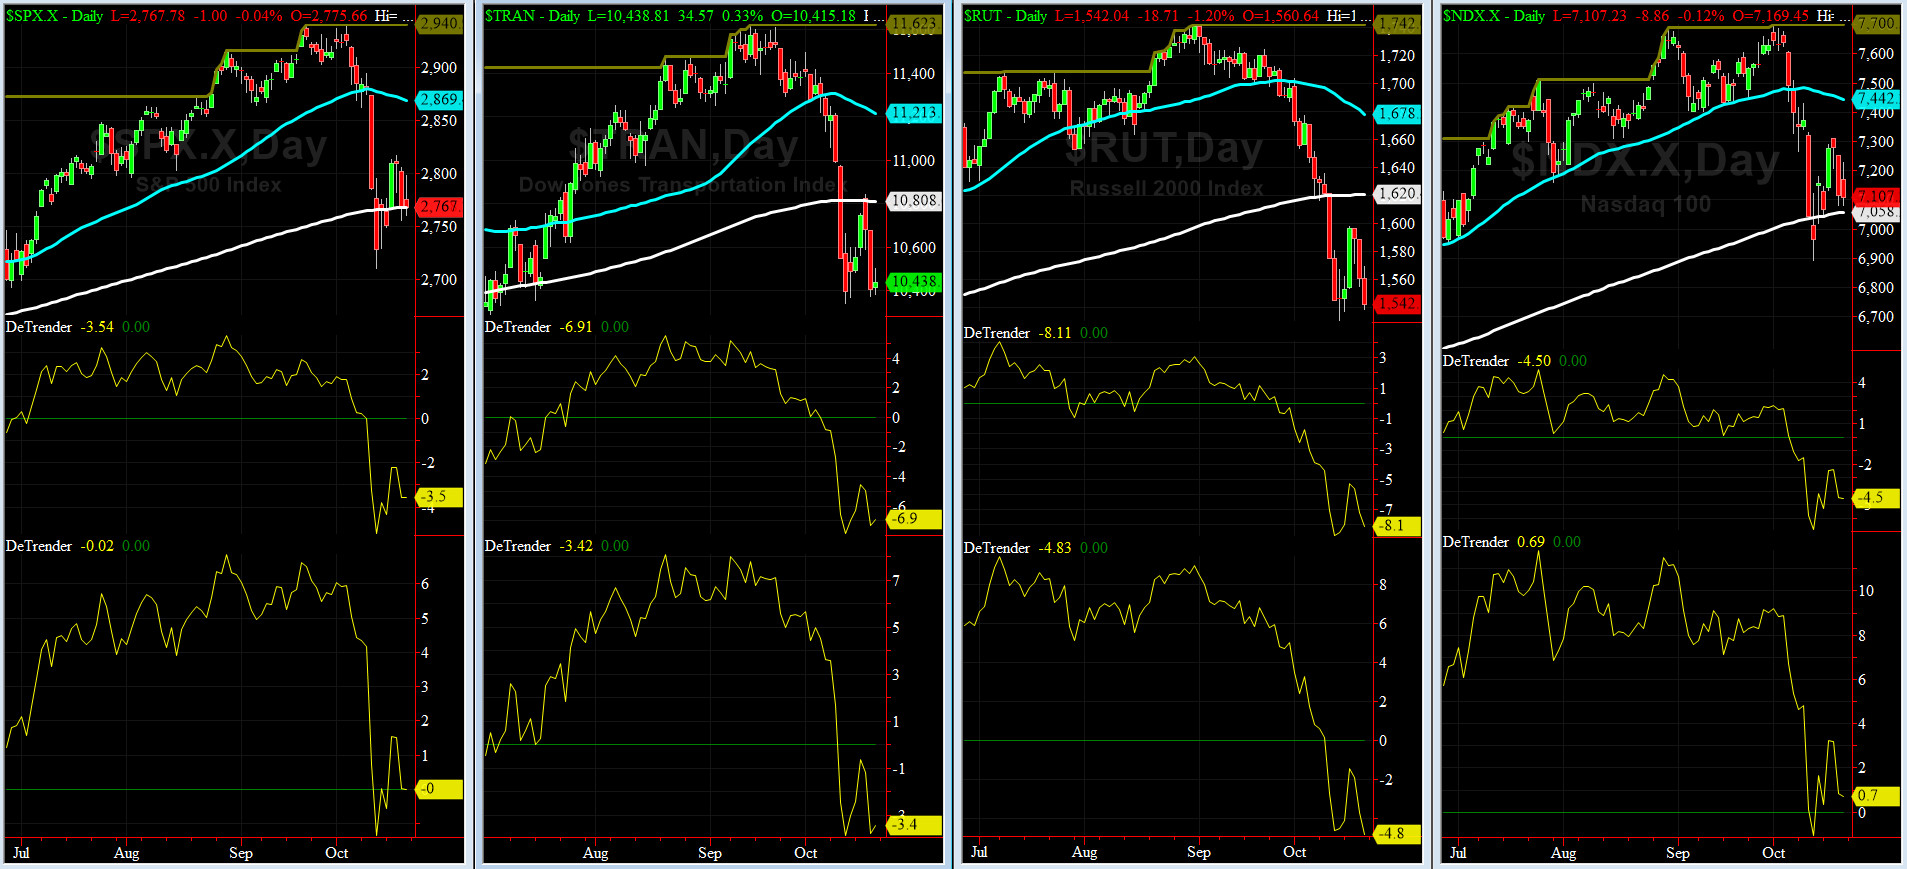
DeTrenders Charts for SPX, NDX, TRAN & RUT Indices
50-Day MA SPX = 2874 or 4.3% ABOVE SPX (max observed in last 7 yrs = +8.6%, min = -9.3%)
200-Day MA SPX = 2766 or 0.6% ABOVE SPX (max observed in last 7 yrs = 15.2%, min = -14%)
Only ONE of our EIGHT DeTrenders is in POSITIVE territory. The DeTrenders for DJ Tran & RUT will continue to be harbingers of future price behavior in broad indices.
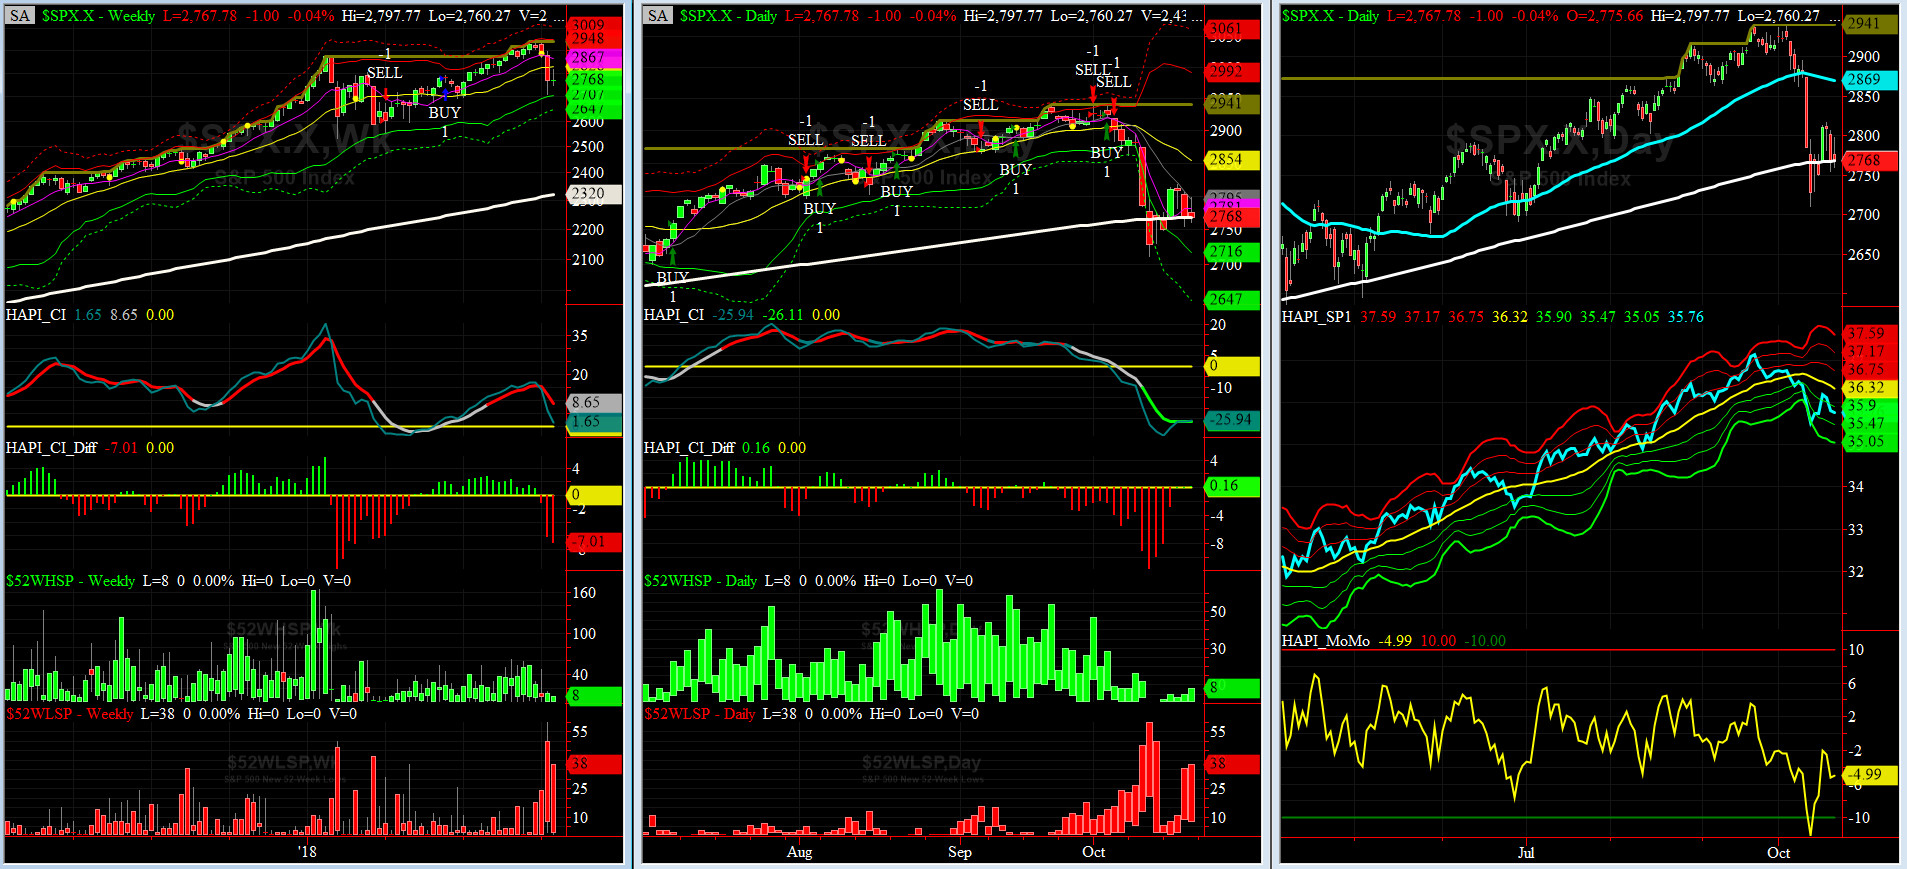
HA_SP1_Momo Chart
WEEKLY Timing Model = on a BUY Signal since Friday, June 15, 2018 CLOSE at 2779
DAILY Timing Model = on a SELL Signal since Thursday, October 4, 2018 CLOSE at 2901
Max SPX 52wk-highs reading last week = 8 (over 120-140, the local maxima is in)
Max SPX 52wk-Lows reading last week = 38 (over 40-60, the local minima is in)
HA_SP1 closed at its -1 sigma channels
HA_Momo = -5 (reversals most likely occur above +10 or below -10)
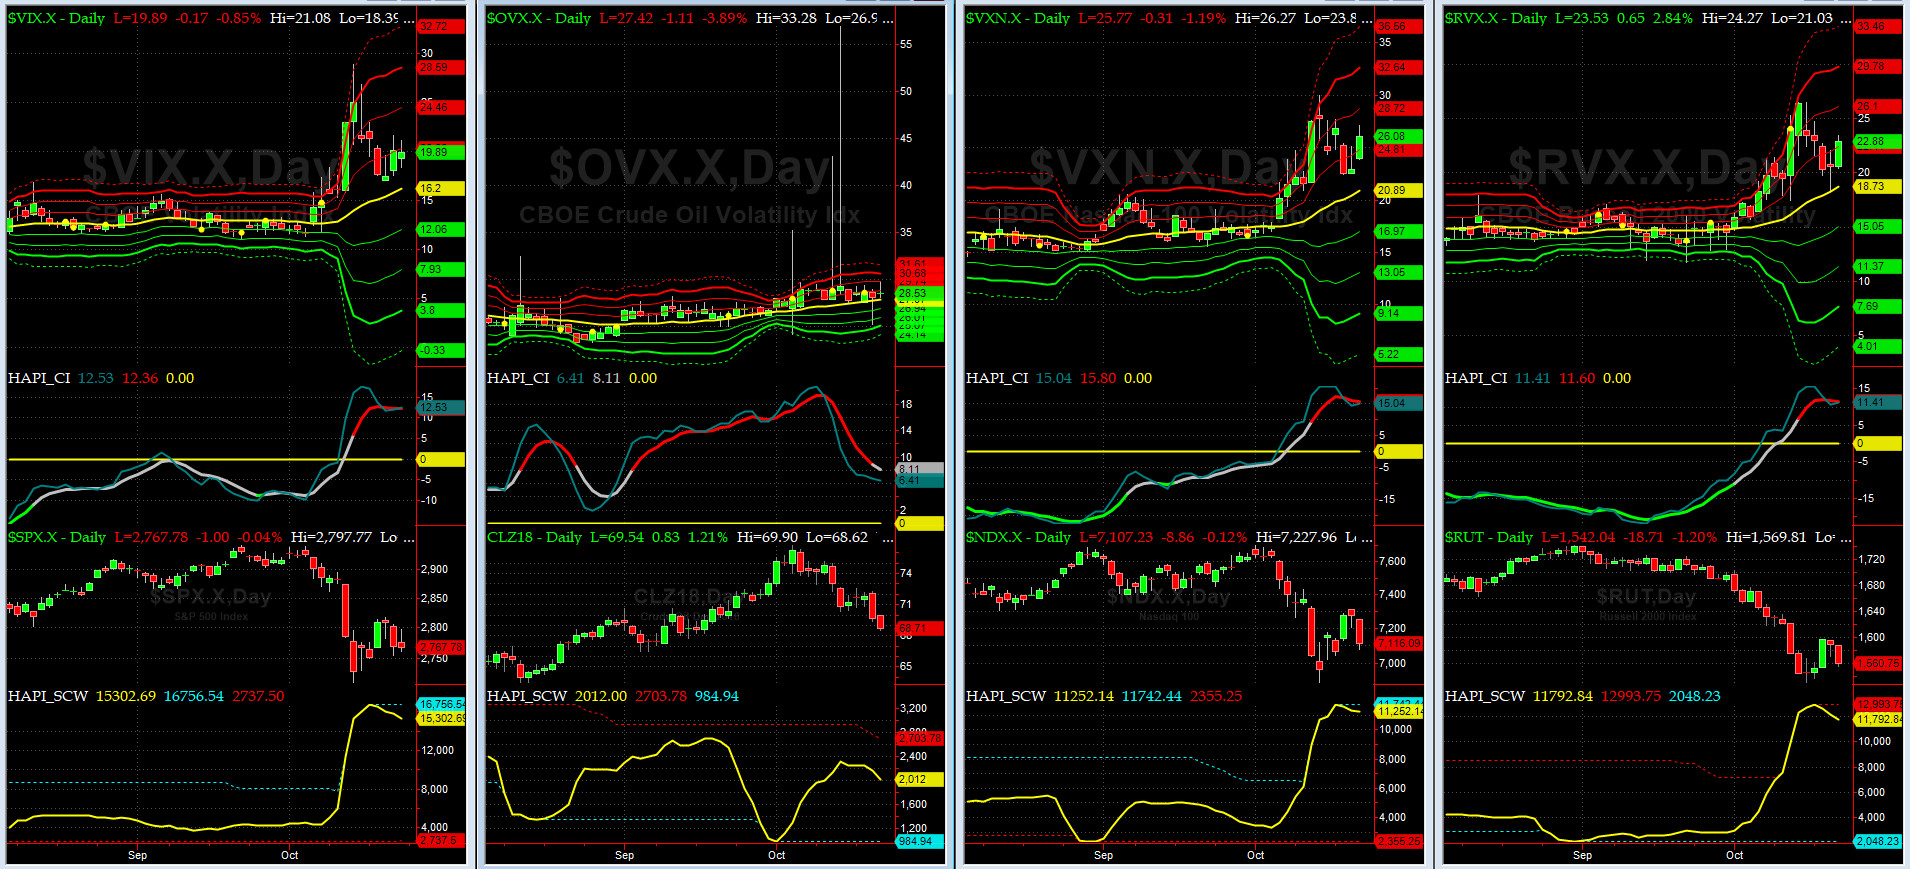
Vol of the Vols Chart
Spot VIX currently stands at 19.9, right about its +1 sigma (remember it's the VIX volatility pattern aka "its sigma channels" that matters, and not the level of VIX itself (this is per Dr. Robert Whaley, a great mentor and inventor of original VIX, now called VXO). VIX usually peaks around a test of its +4 sigma).
VIX & VXN both went sideways, albeit at a higher reading levels.
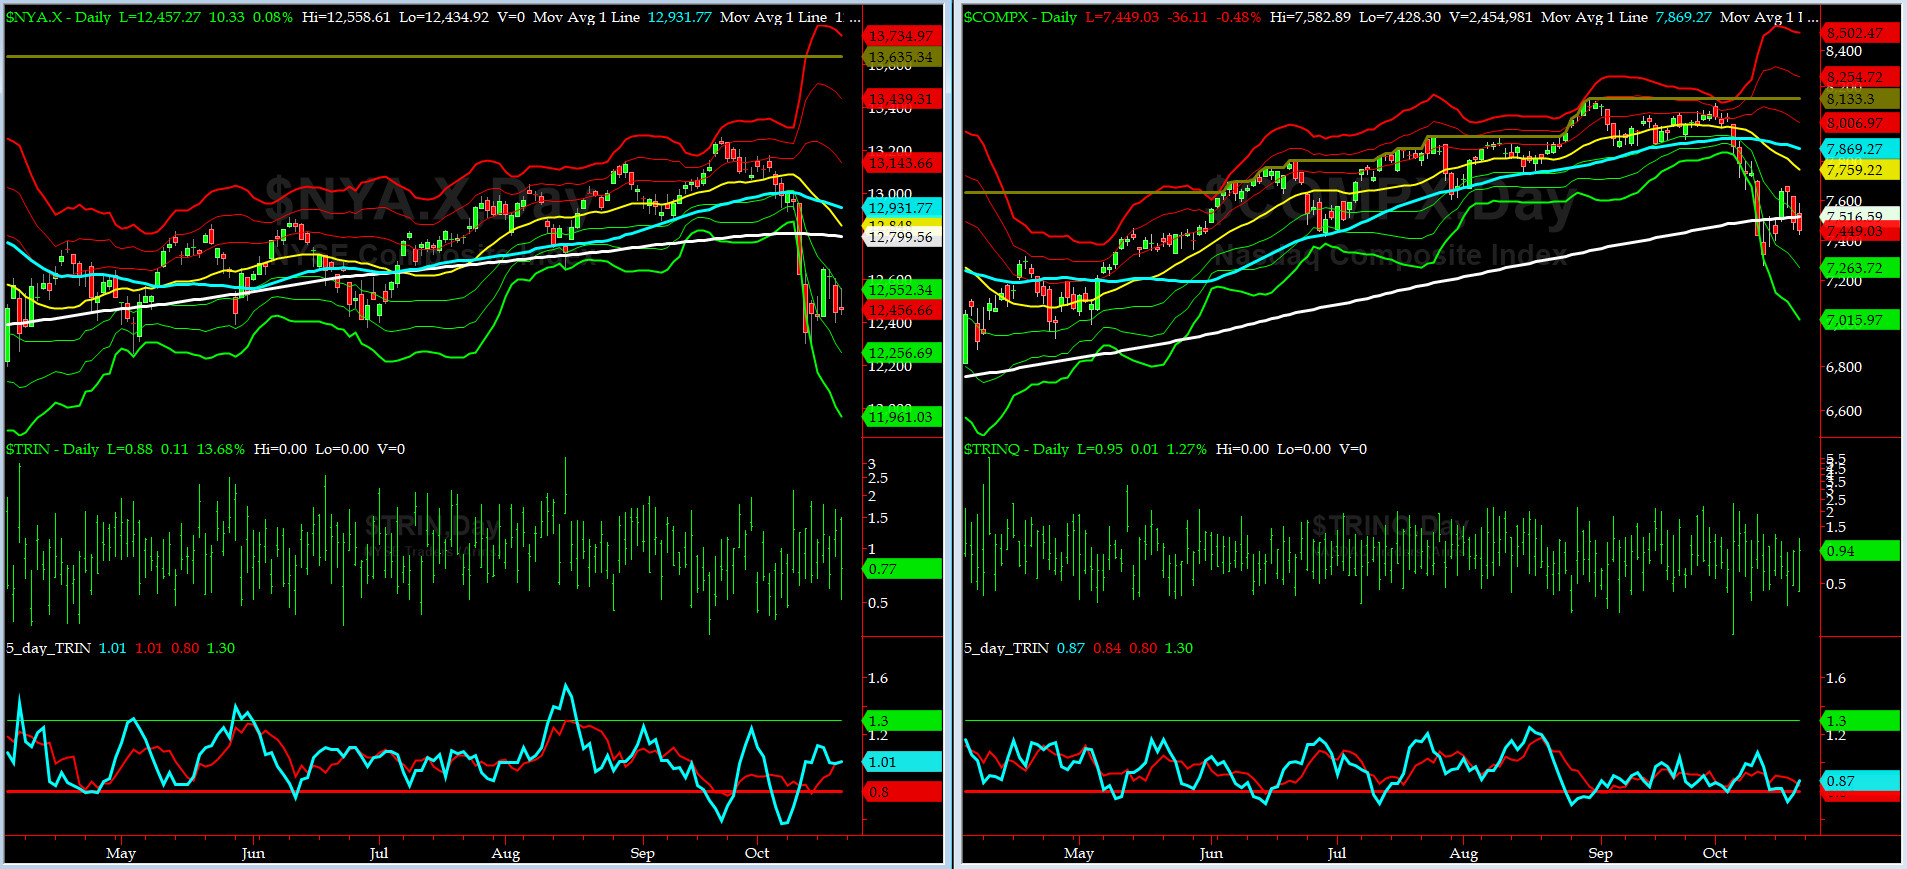
5-day TRIN & TRINQ Charts
Both NYSE & NASDAQ 5-day TRIN & TRINQ are in NEUTRAL zones.
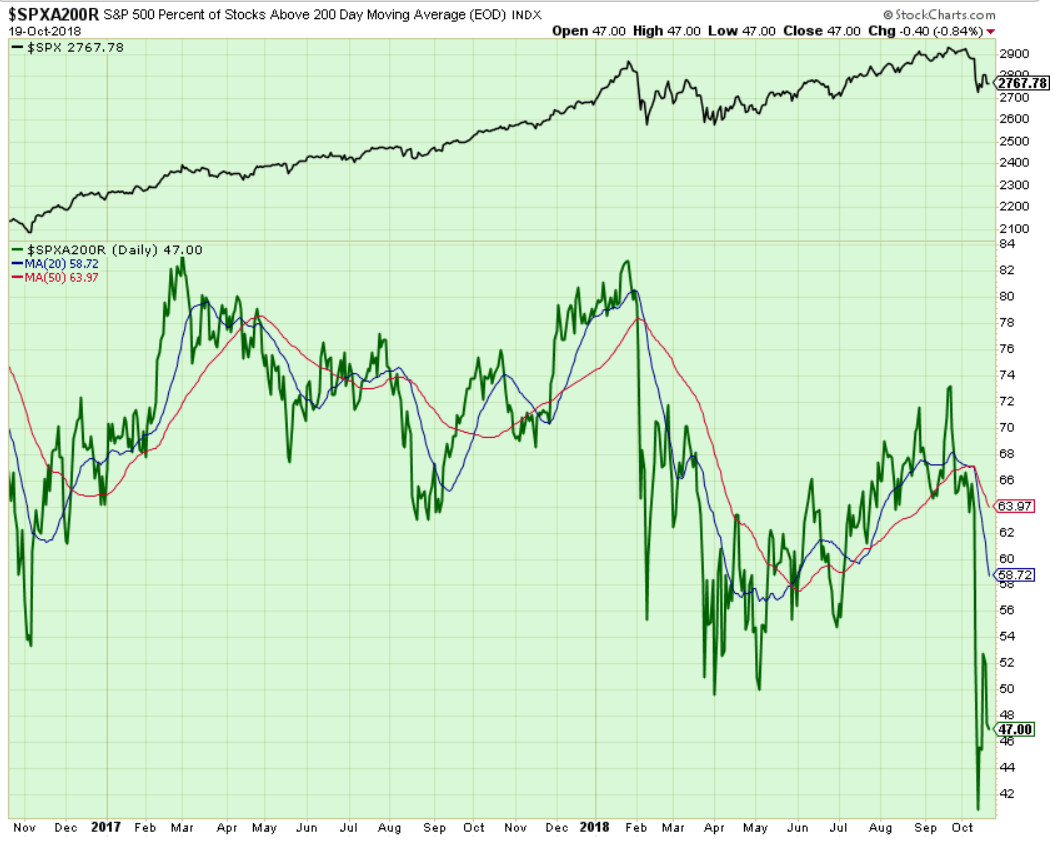
Components of SPX above their respective 200day MA Chart
This scoring indicator recovered somewhat on Tuesday, but by Friday, it was back down to mid 40s.
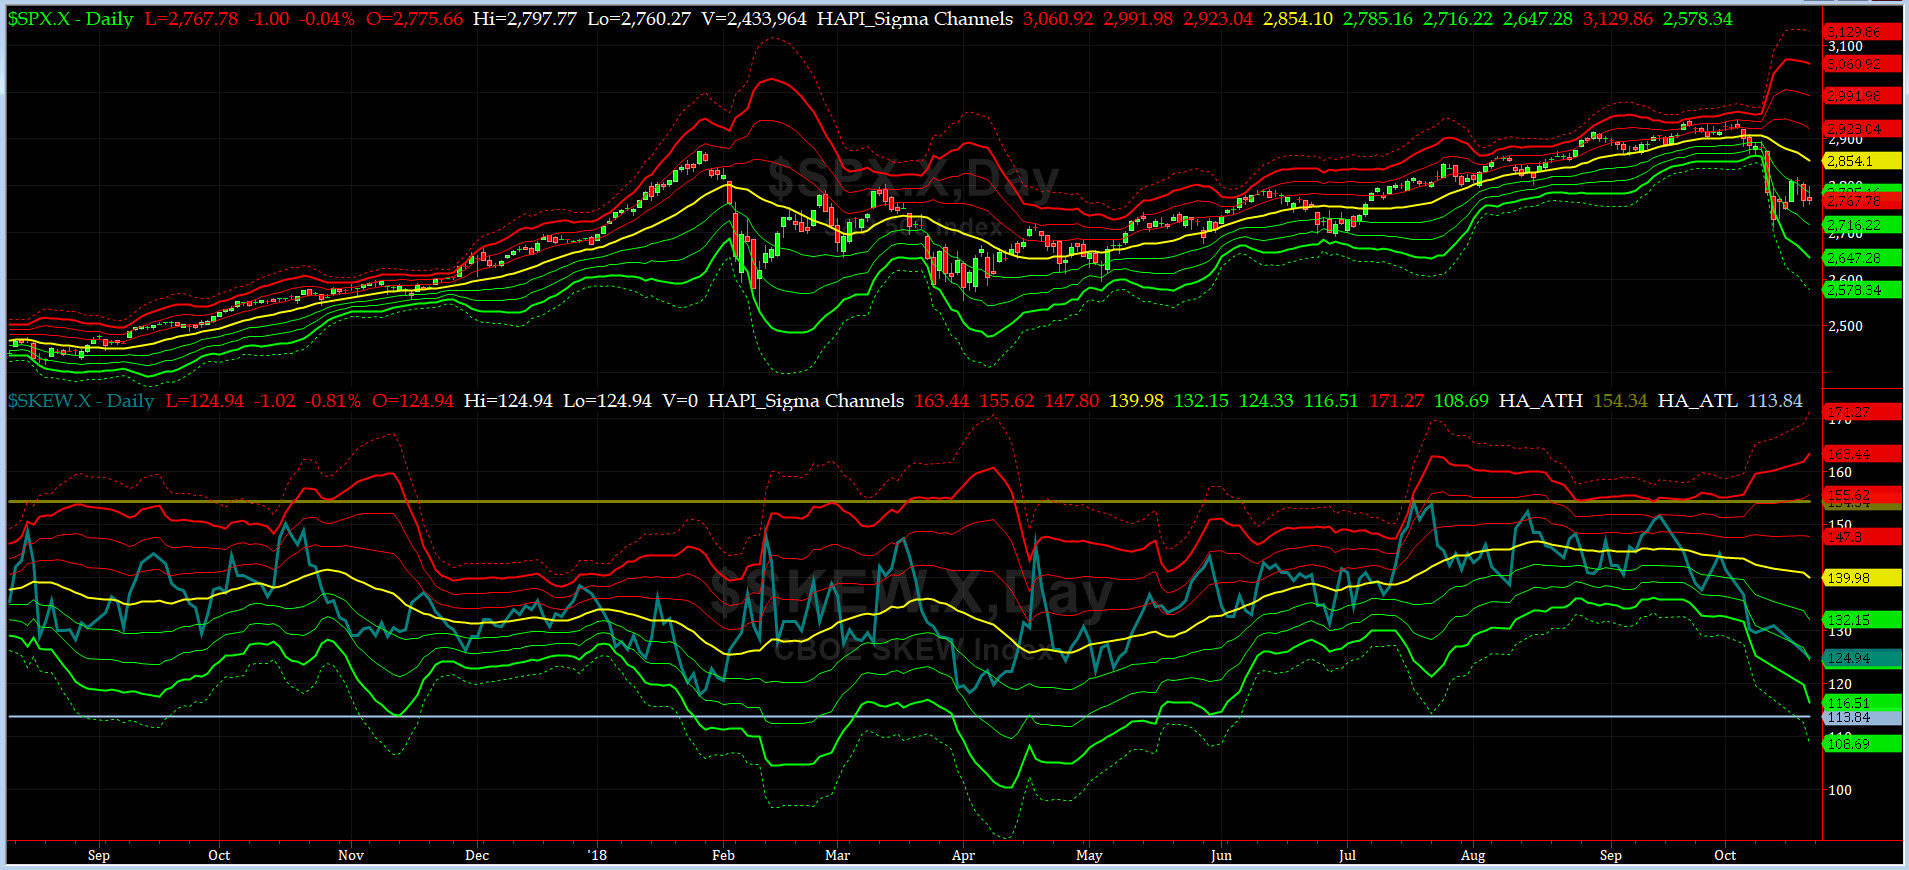
SPX SKEW (Tail Risk) Chart
On Friday, SPX SKEW (Tail Risk) closed near 125, right about its -2 sigma (normal = 120-125, range 100-150).
Is all quiet on the Eastern & Mid-Western Fronts? Our beloved @Capt_Tiko still says MAYBE....
How to interpret the value of SPX SKEW? (from CBOE white paper on SKEW)

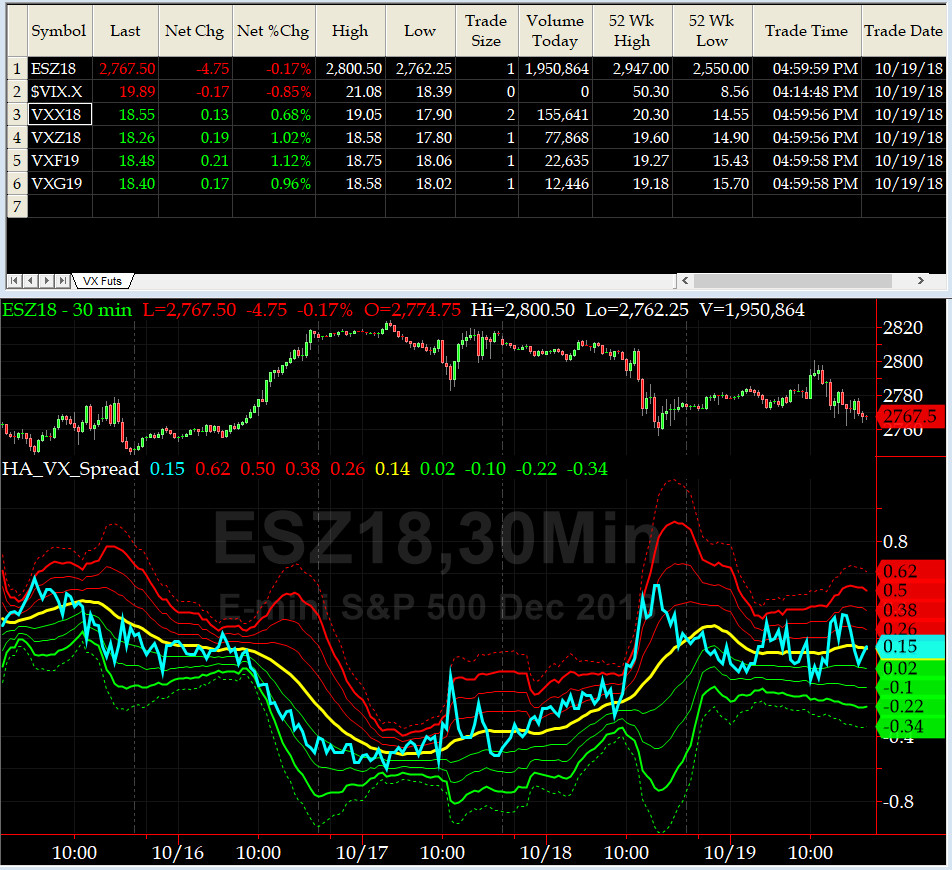
3-month VIX Futures Spread(VX) Chart
This popular timing indicator, (long NOV18, & short FEB19 VIX Futures) again closed at +0.15 which is a tad bullish here.
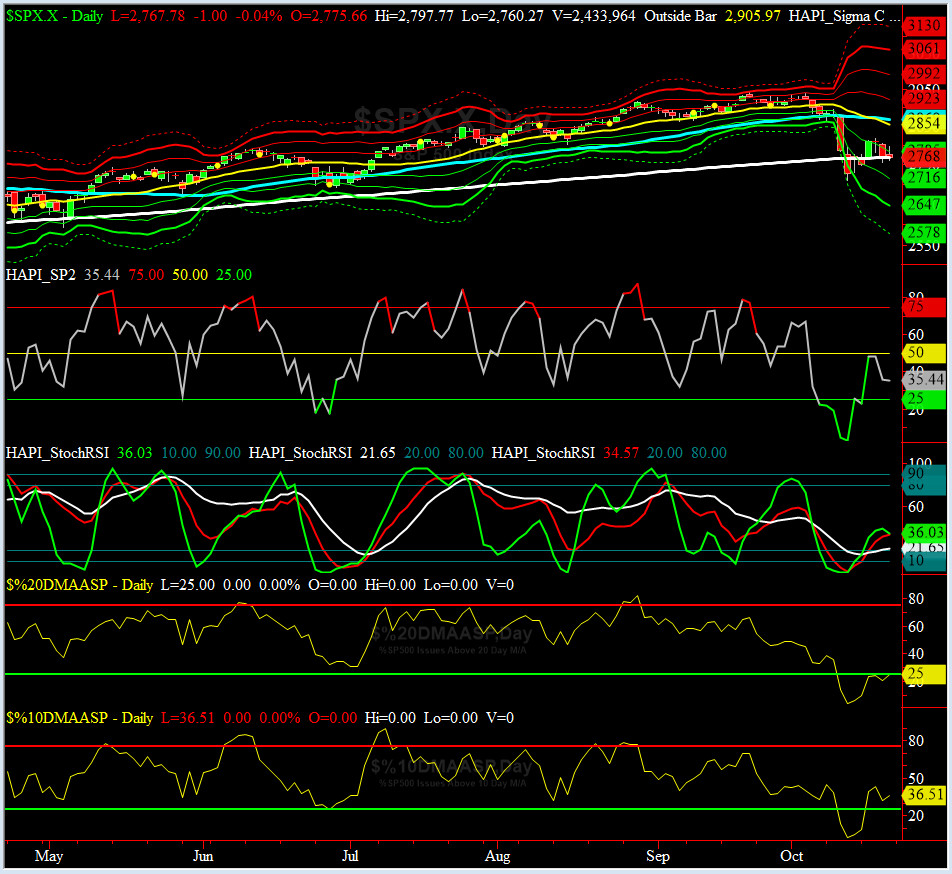
HA_SP2 Chart
HA_SP2 = 35 (Buy signal <= 25, Sell Signal >= 75)
Our coveted SP2 prop indicator could not get over 50 by Tuesday Close.
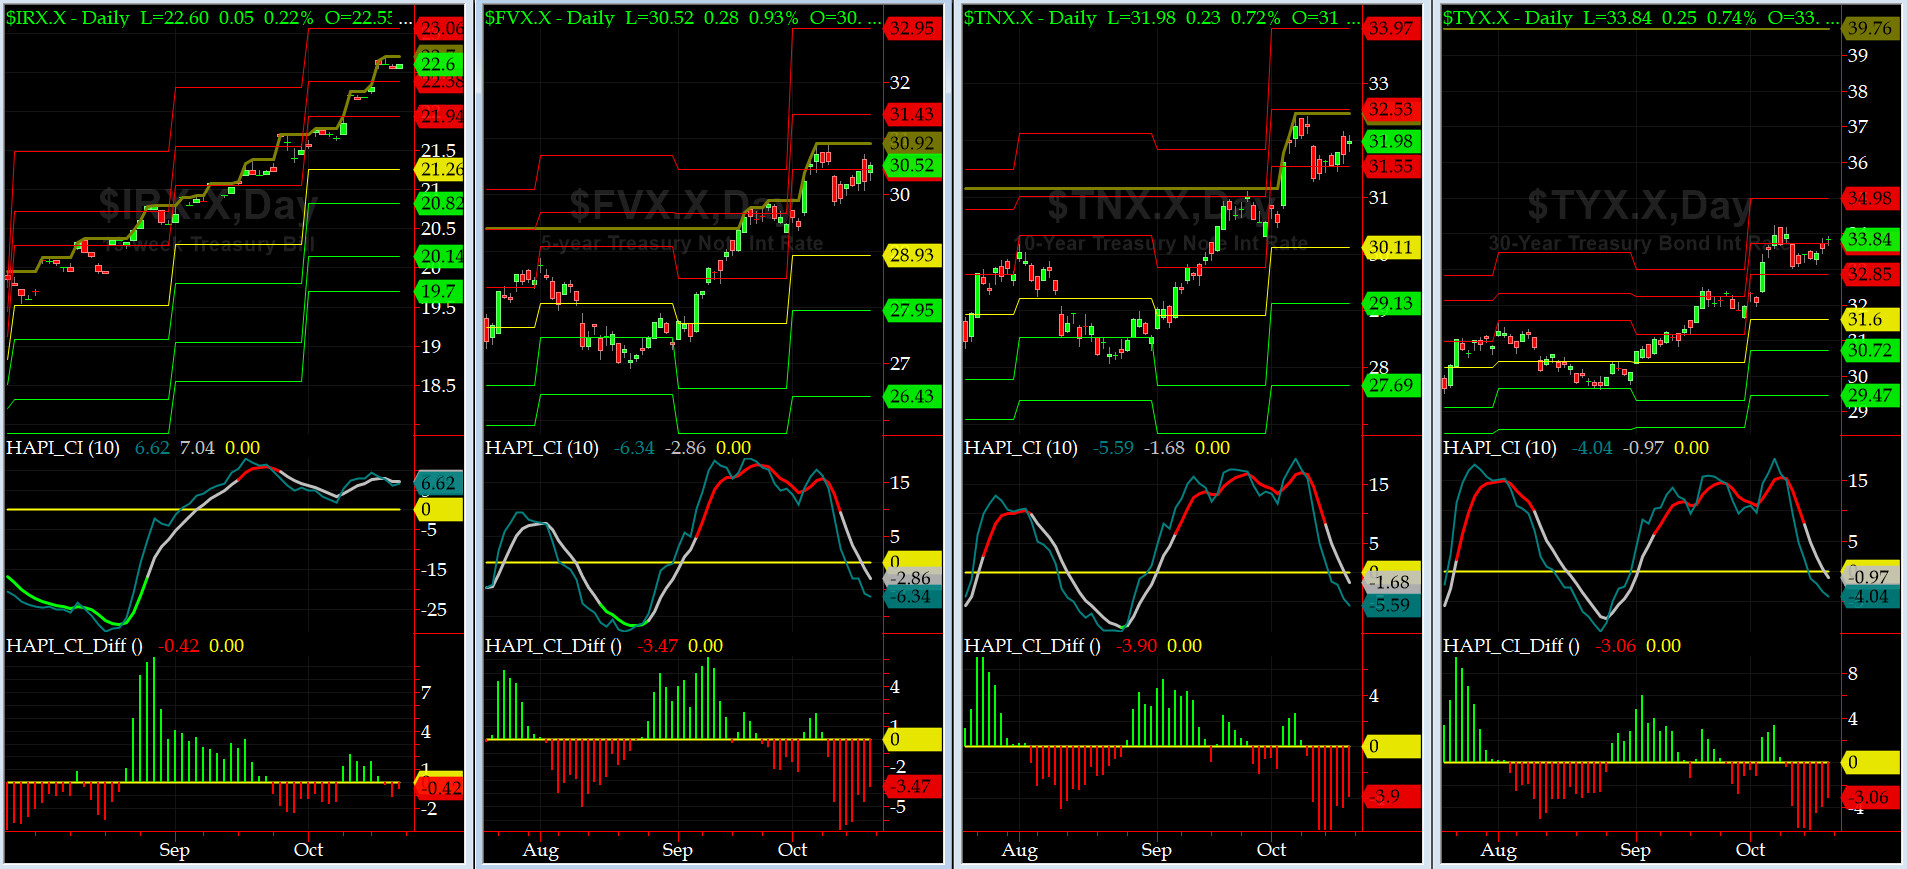
US Treasury T-Notes & T-Bonds Yields Chart
This past week all YTMs pulled back first and then rose somewhat.
Fari Hamzei
|
|
|
|
|
|
Customer Care:
|
|
|
|
|
|
|
 |
 |
|
 |
|
 |
 |
 |
HA YouTube Channel ::: HA Blog ::: Testimonials ::: Tutorials & FAQs ::: Privacy Policy
|
Trading Derivatives (Options & Futures) contains substantial risk and is not for every investor. An investor could potentially lose all or more than his/her initial investment.
Only risk capital should be used for trading and only those with sufficient risk capital should consider trading derivatives. Past performance is not
necessarily indicative of future results. Testimonials appearing on this website may not be representative of other clients or customers
and are not a guarantee of future performance or success.
|
| (c) 1998-2025, Hamzei Analytics, LLC.® All Rights Reserved. |
|
|