|
Sunday, November 4, 2018, 2115ET
Market Timing Charts, Analysis & Commentary for Issue #265
Timer Charts of S&P-500 Cash Index (SPX) + NASDAQ-100 Cash Index (NDX)
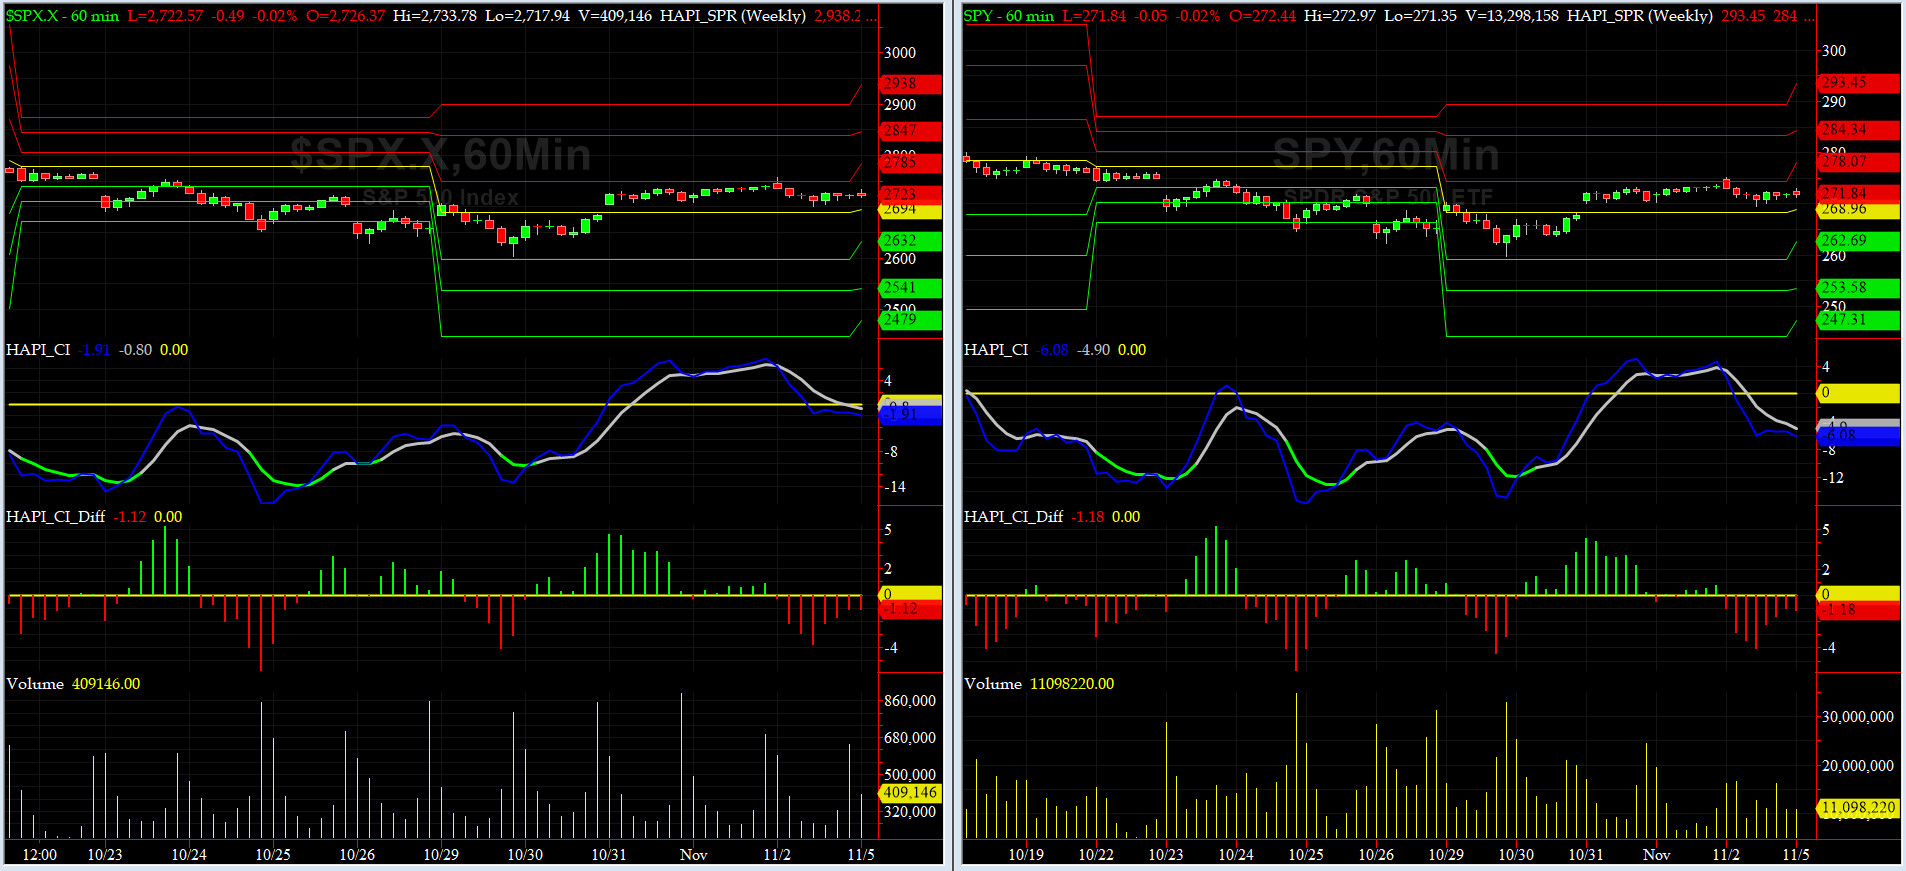
Most recent S&P-500 Cash Index (SPX): 2723 up +65 (up +2.45%) for the week ending on Friday, November 2, 2018, which closed just about its zero sigma.
DJIA ALL TIME INTRADAY HIGH = 26951 (reached on Wednesday, October 3, 2018)
DJ TRAN ALL TIME INTRADAY HIGH = 11623 (reached on Friday, September 14, 2018)
SPX ALL TIME INTRADAY HIGH = 2941 (reached on Friday, September 21, 2018)
NDX ALL TIME INTRADAY HIGH = 7700 (reached on Thursday, October 1, 2018)
RUT ALL TIME INTRADAY HIGH = 1742 (reached on Friday, August 31, 2018)
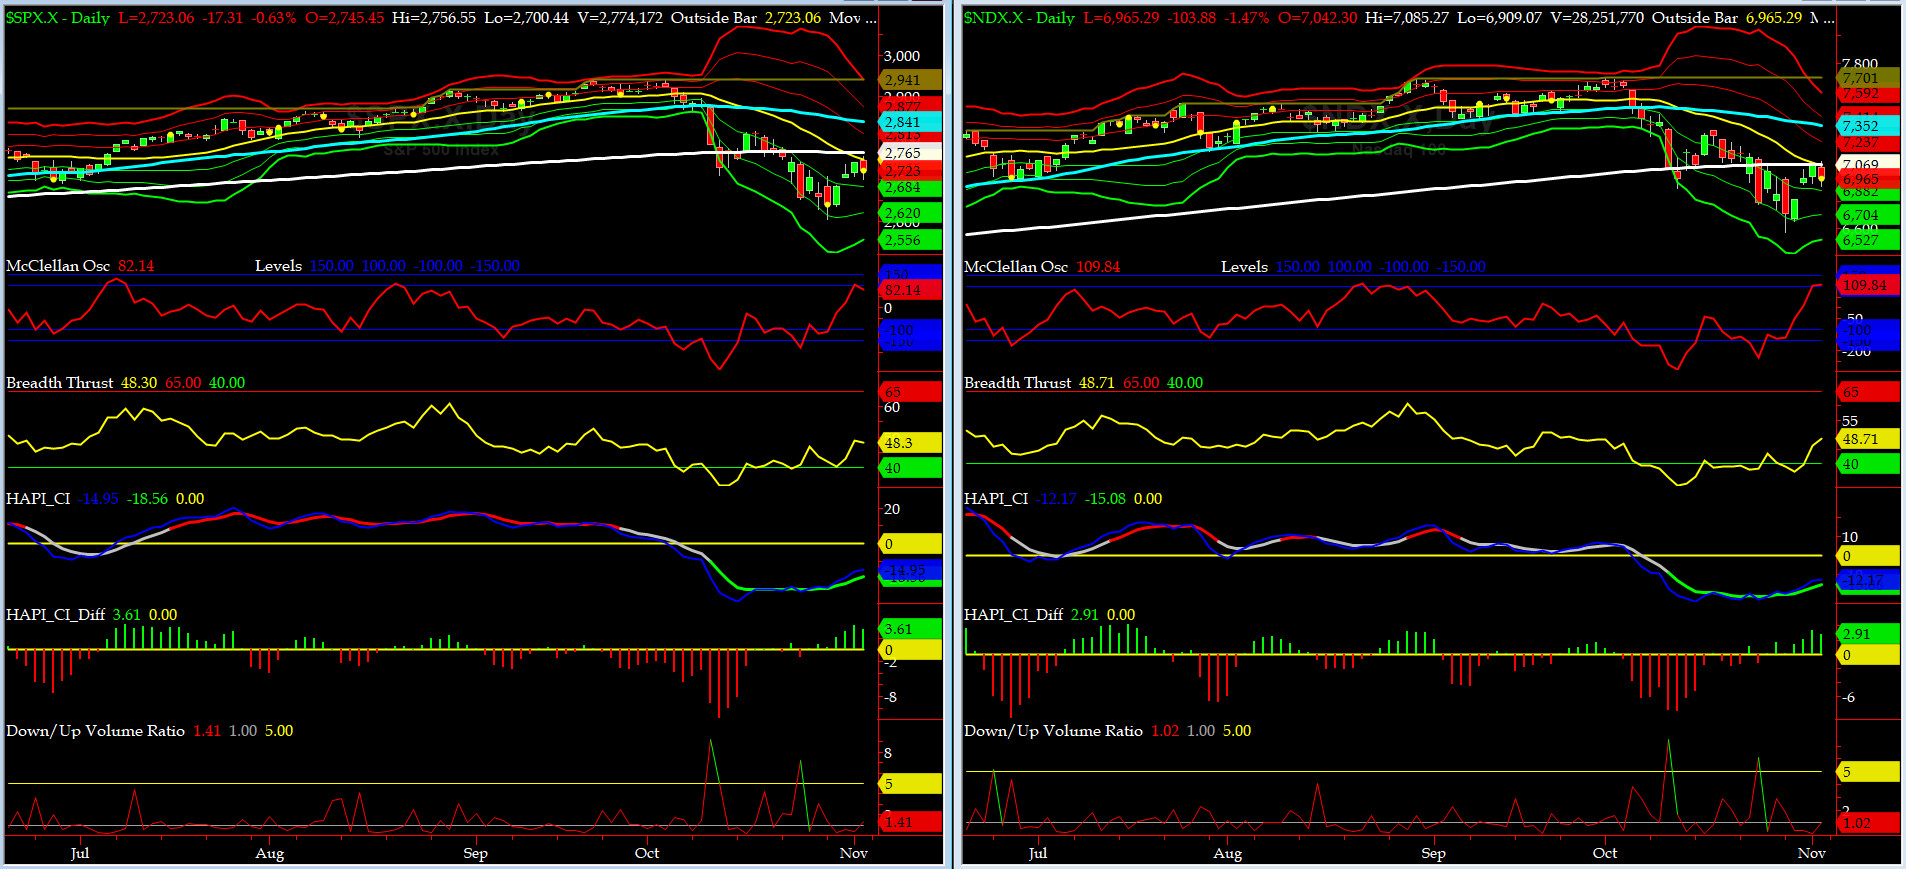
Current DAILY +2 Sigma SPX = 2877 with WEEKLY +2 Sigma = 2964
Current DAILY 0 Sigma SPX = 2748 with WEEKLY 0 Sigma = 2819
Current DAILY -2 Sigma SPX = 2620 with WEEKLY -2 Sigma = 2673
NYSE McClellan Oscillator = +82 (-150 is start of the O/S area; around -275 to -300 area or lower, we go into the �launch-pad� mode; over +150, we are in O/B area)
NYSE Breadth Thrust = 48.3 (40 is considered as oversold and 65 as overbought)
Last Feb Closing low was taken out last Monday then we rallied (juiced up) into AAPL EPS. As we had predicted in our OTF Chatrooms, that was a negative surprise, and on Friday, even with an awesome October Job Report, US Markets sold hard, and they are negative tonight (on Globex) also.
Note: on Friday, SPX, NDX and DJIA each put in outside bar reversals.
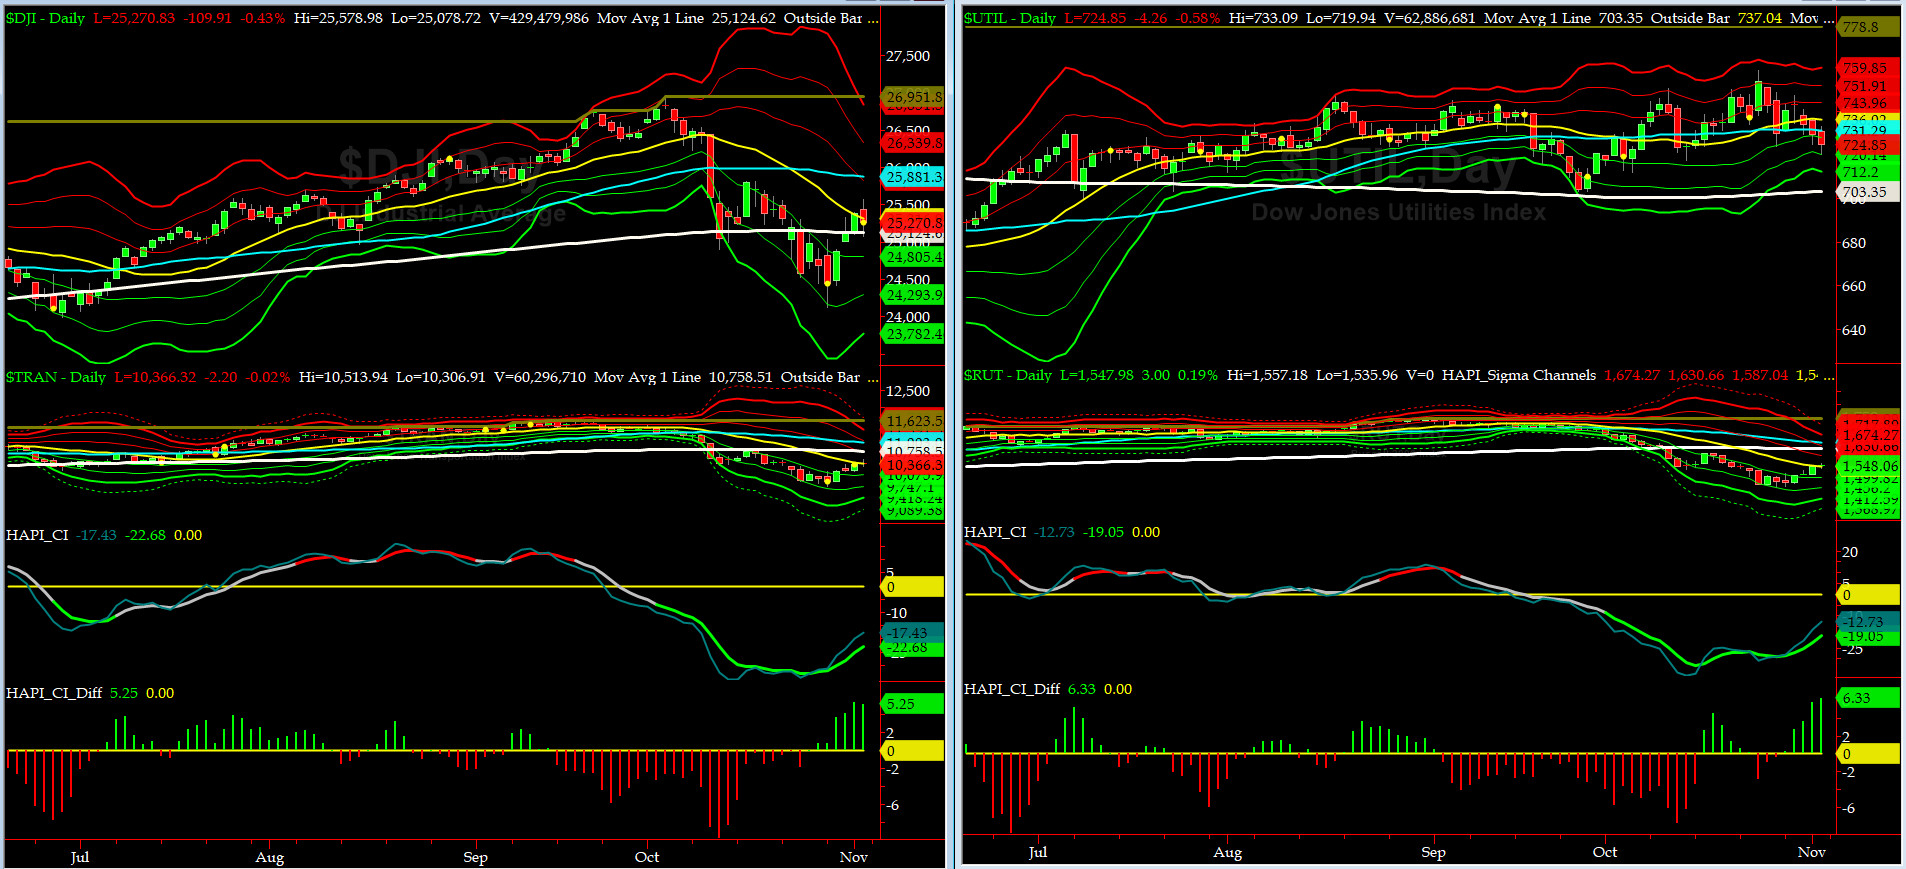
Canaries [in the Coal Mine] Chart for DJ TRAN & RUT Indices
200-Day MA DJ TRAN = 10,758 or 3.6% ABOVE DJ TRAN (max observed in last 7 yrs = 20.2%, min = -20.3%)
200-Day MA RUT = 1617 or 4.3% ABOVE RUT (max observed in last 7 yrs = 21.3%, min = -22.6%)
DJ Transportation Index (proxy for economic conditions 6 to 9 months hence) bounced hard off of its Monday lows.
Russell 2000 Small Caps Index (proxy for Risk ON/OFF) performed the same way. RISK is trying a comeback.

DeTrenders Charts for SPX, NDX, TRAN & RUT Indices
50-Day MA SPX = 2840 or 4.1% ABOVE SPX (max observed in last 7 yrs = +8.6%, min = -9.3%)
200-Day MA SPX = 2764 or 1.5% ABOVE SPX (max observed in last 7 yrs = 15.2%, min = -14%)
For the second week in the row, NONE of our EIGHT DeTrenders are in POSITIVE territory. The DeTrenders for DJ Tran & RUT will continue to be harbingers of future price behavior in broad indices.
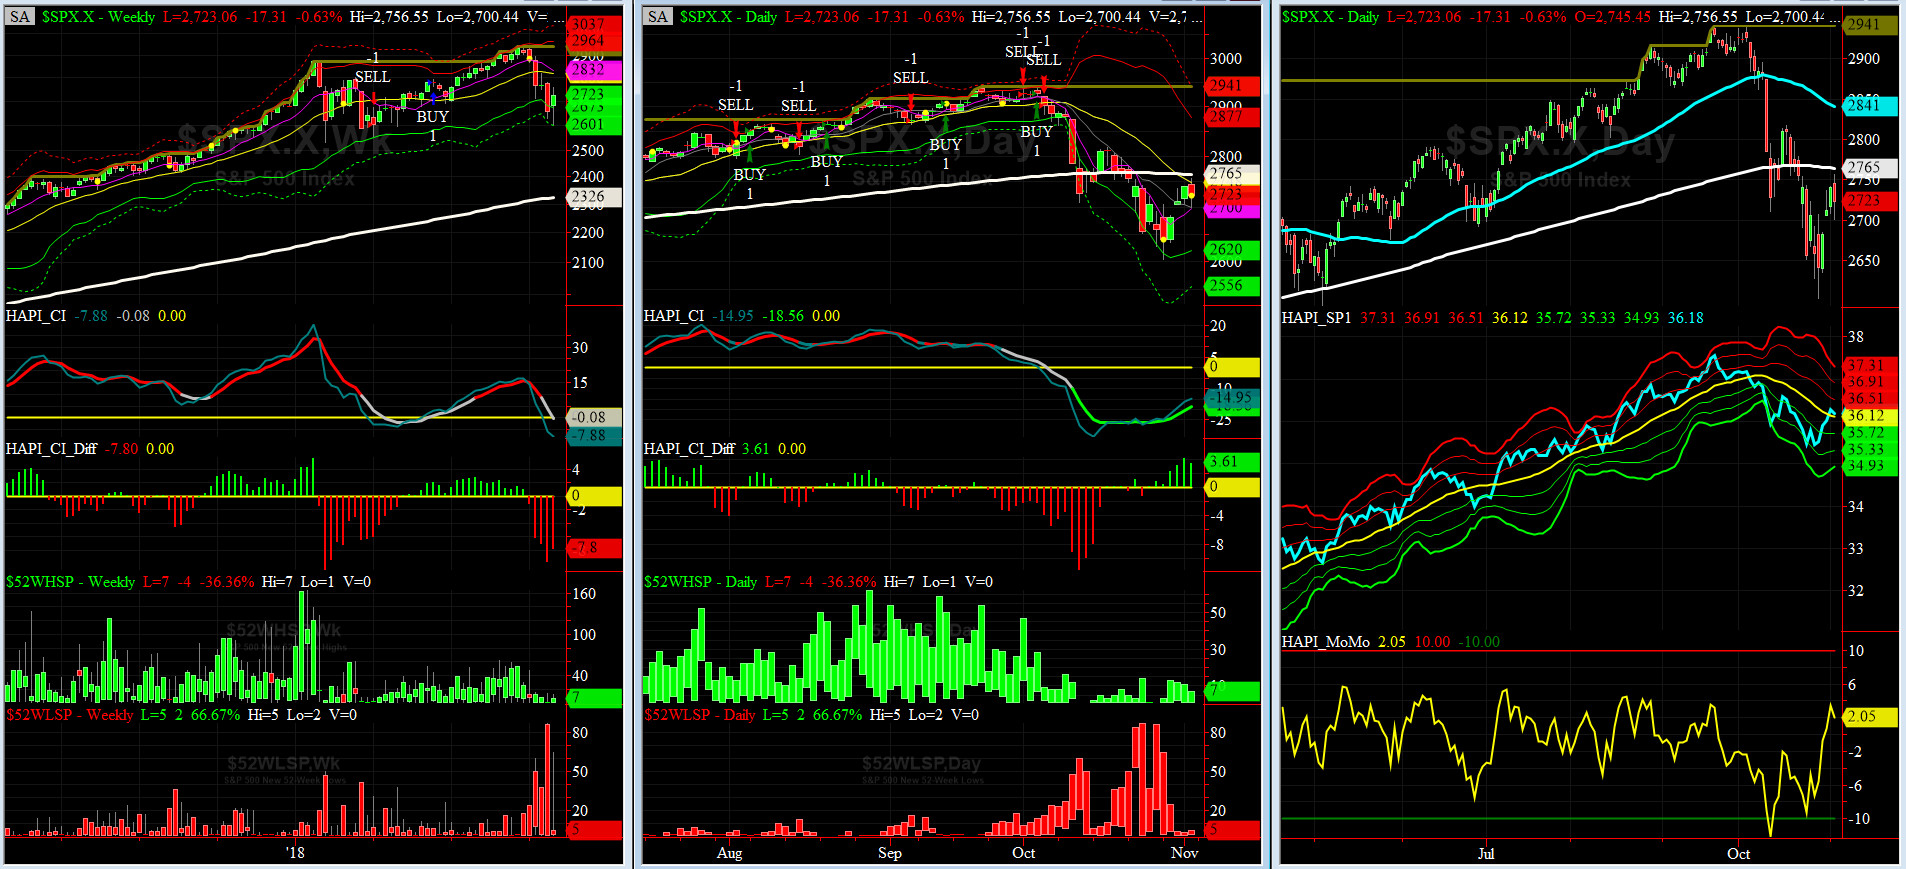
HA_SP1_Momo Chart
WEEKLY Timing Model = on a BUY Signal since Friday, June 15, 2018 CLOSE at 2779
DAILY Timing Model = on a SELL Signal since Thursday, October 4, 2018 CLOSE at 2901
Max SPX 52wk-highs reading last week = 13 (over 120-140, the local maxima is in)
Max SPX 52wk-Lows reading last week = 65 (over 40-60, the local minima is in)
HA_SP1 closed at its zero sigma channels
HA_Momo = +2 (reversals most likely occur above +10 or below -10)
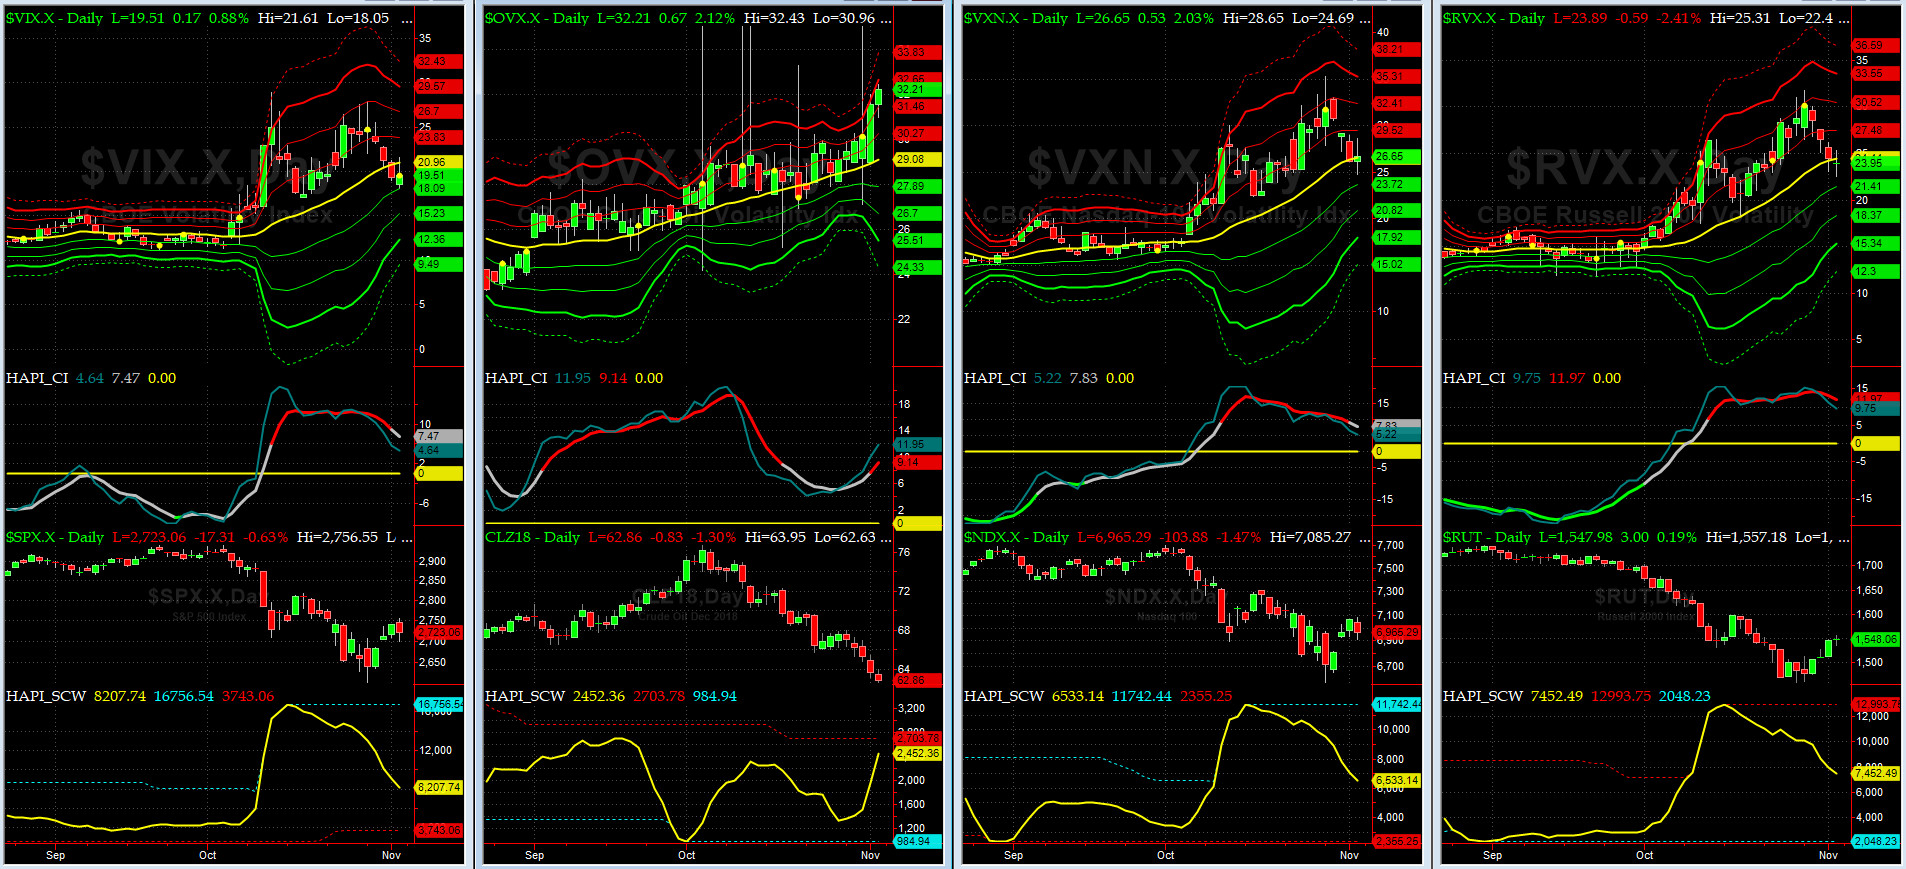
Vol of the Vols Chart
Spot VIX currently stands at 19.5, right about its -0.5 sigma (remember it's the VIX volatility pattern aka "its sigma channels" that matters, and not the level of VIX itself (this is per Dr. Robert Whaley, a great mentor and inventor of original VIX, now called VXO). VIX usually peaks around a test of its +4 sigma).
VIX & VXN both pulled back this past week to below their respective zero sigmas.
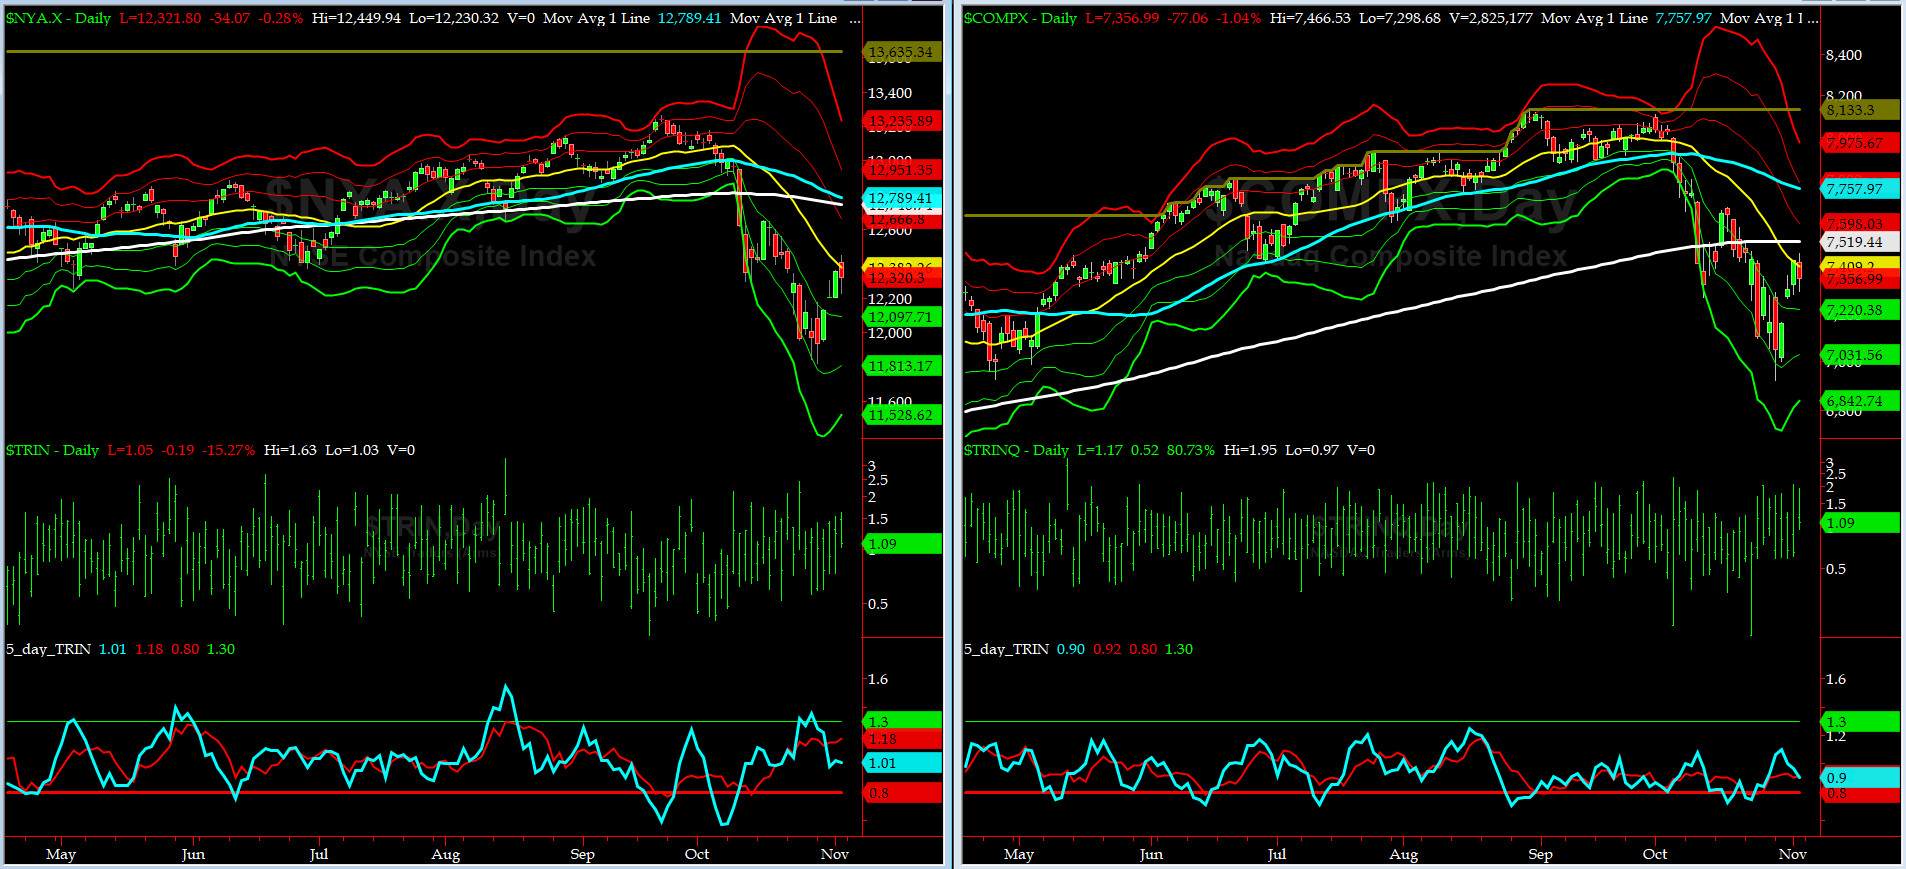
5-day TRIN & TRINQ Charts
Both NYSE 5-day TRIN & NASDAQ 5-day TRINQ are in the NEUTRAL zone.
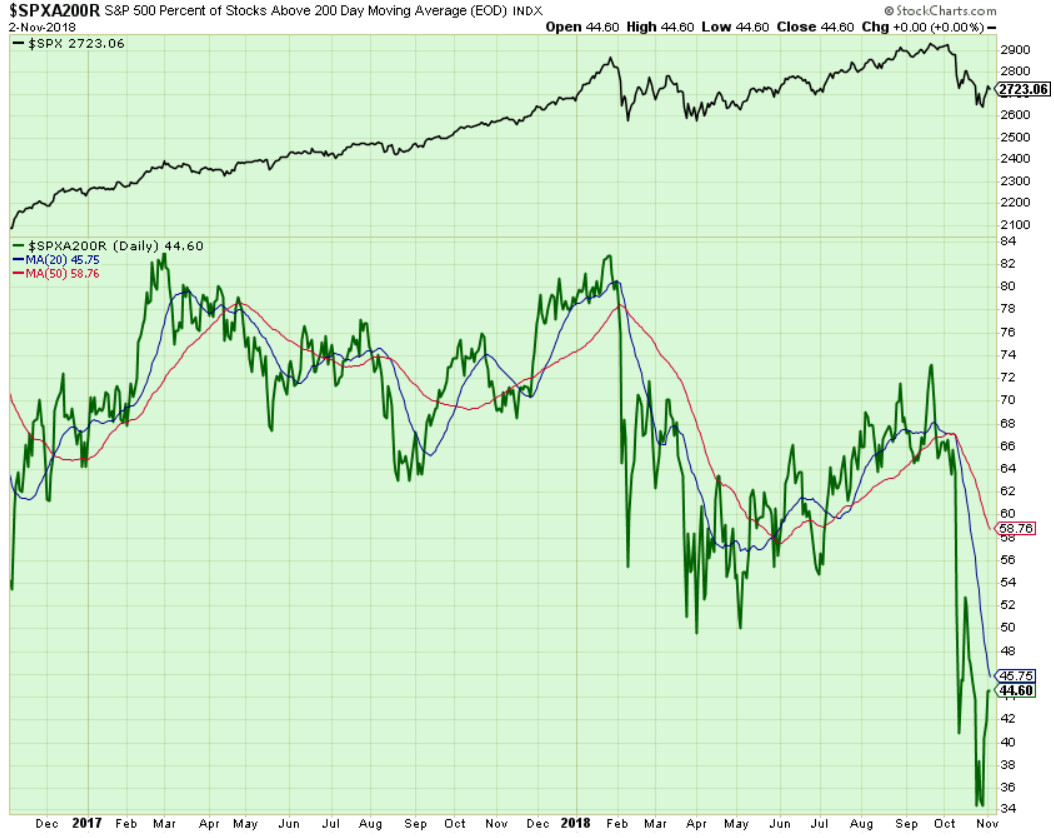
Components of SPX above their respective 200day MA Chart
This scoring indicator retested last week low's at 34% area and then closed at 44% on Friday. We need to see this reading cross first its 20-day and then its 50-day MAs soon.
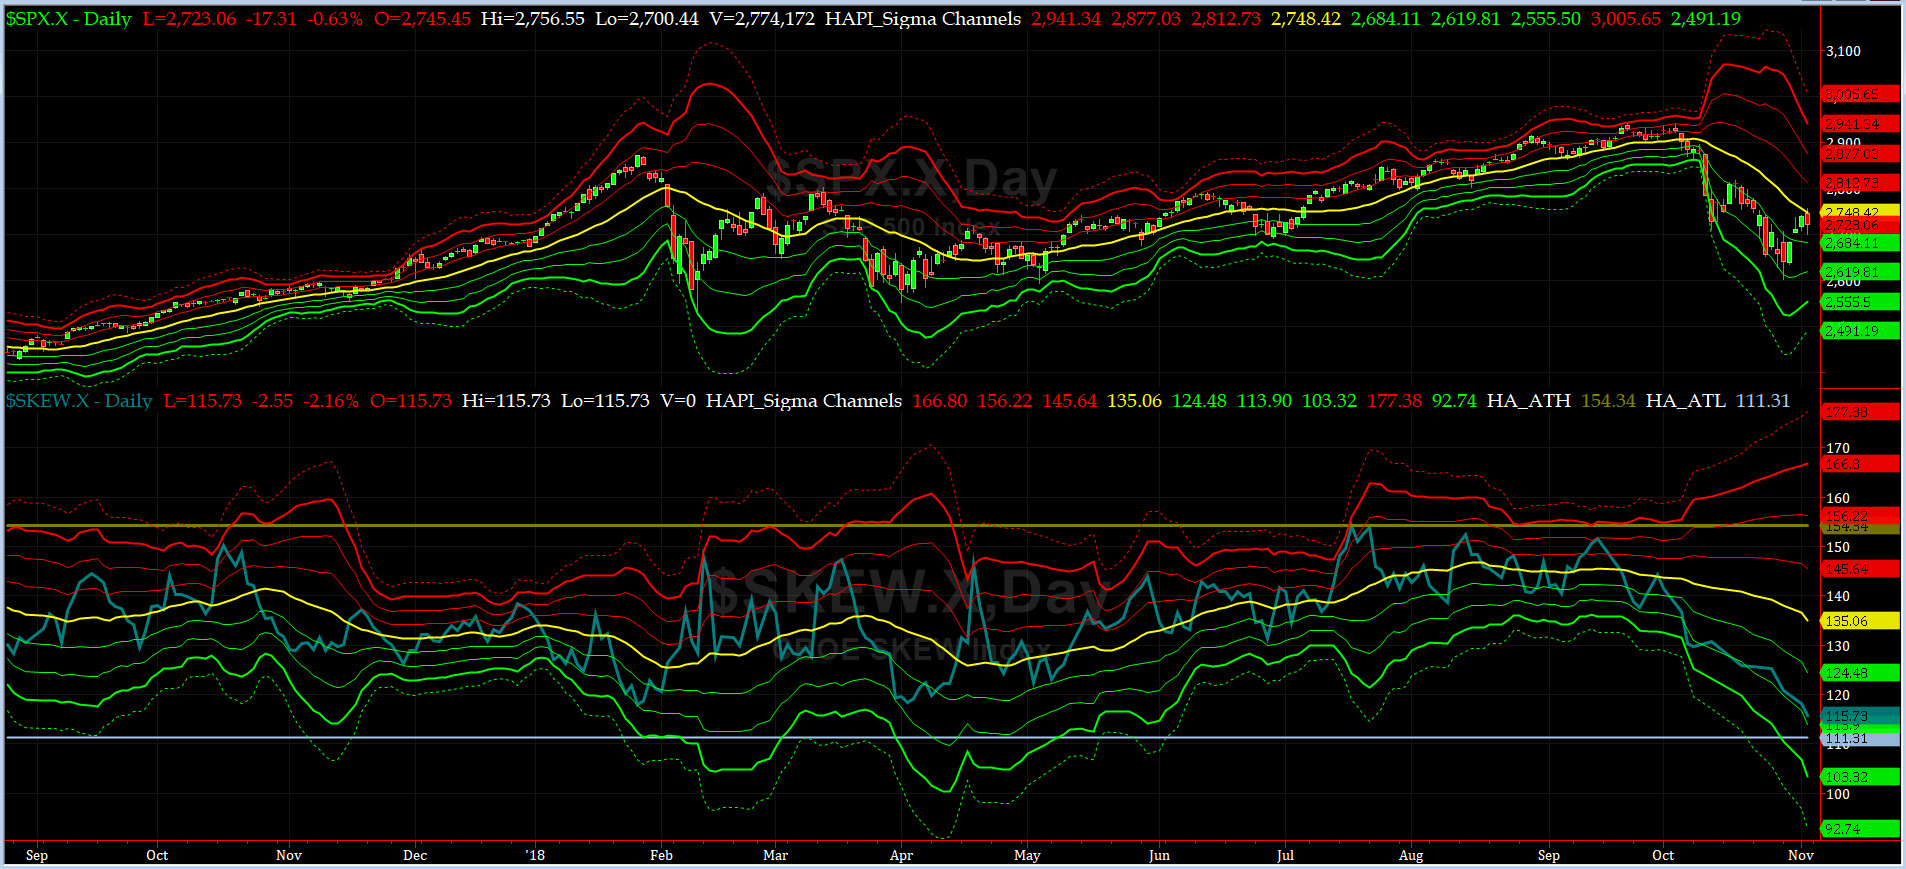
SPX SKEW (Tail Risk) Chart
On Friday, SPX SKEW (Tail Risk) closed near 115.7, still about its -2 sigma (normal = 120-125, range 100-150).
Is all quiet on the Eastern & Mid-Western Fronts? Our beloved @Capt_Tiko now says MAYBE (no soup for you, come back next week)....
How to interpret the value of SPX SKEW? (from CBOE white paper on SKEW)

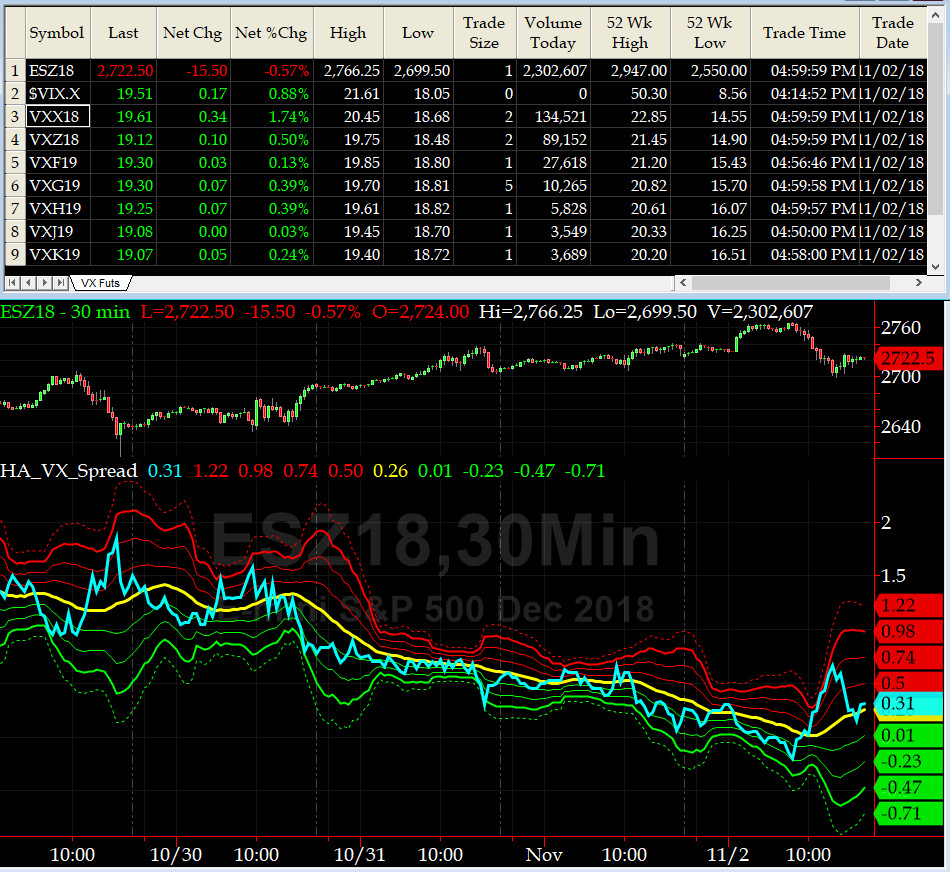
3-month VIX Futures Spread(VX) Chart
This popular timing indicator, (long NOV18, & short FEB19 VIX Futures) closed at +0.3 which is somewhat bullish.
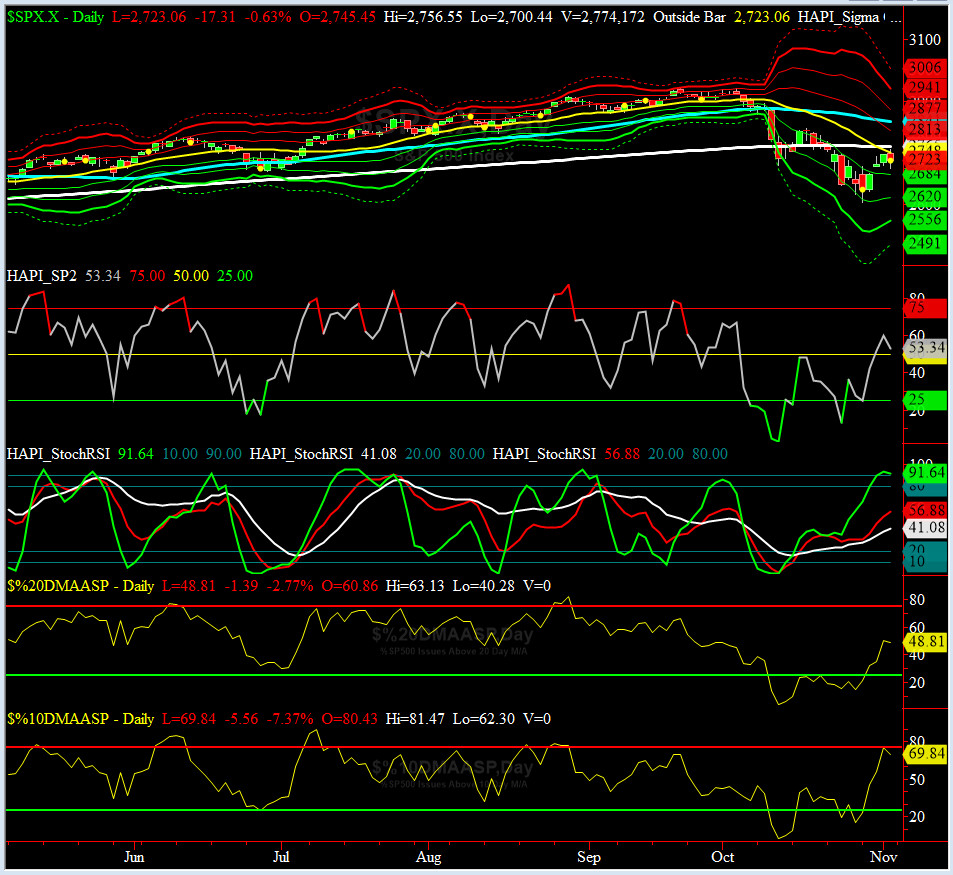
HA_SP2 Chart
HA_SP2 = 53 (Buy signal <= 25, Sell Signal >= 75)
Our coveted SP2 prop indicator rallied from 25 to 60 and then settled at 53 on Friday. This is a NEUTRAL reading.
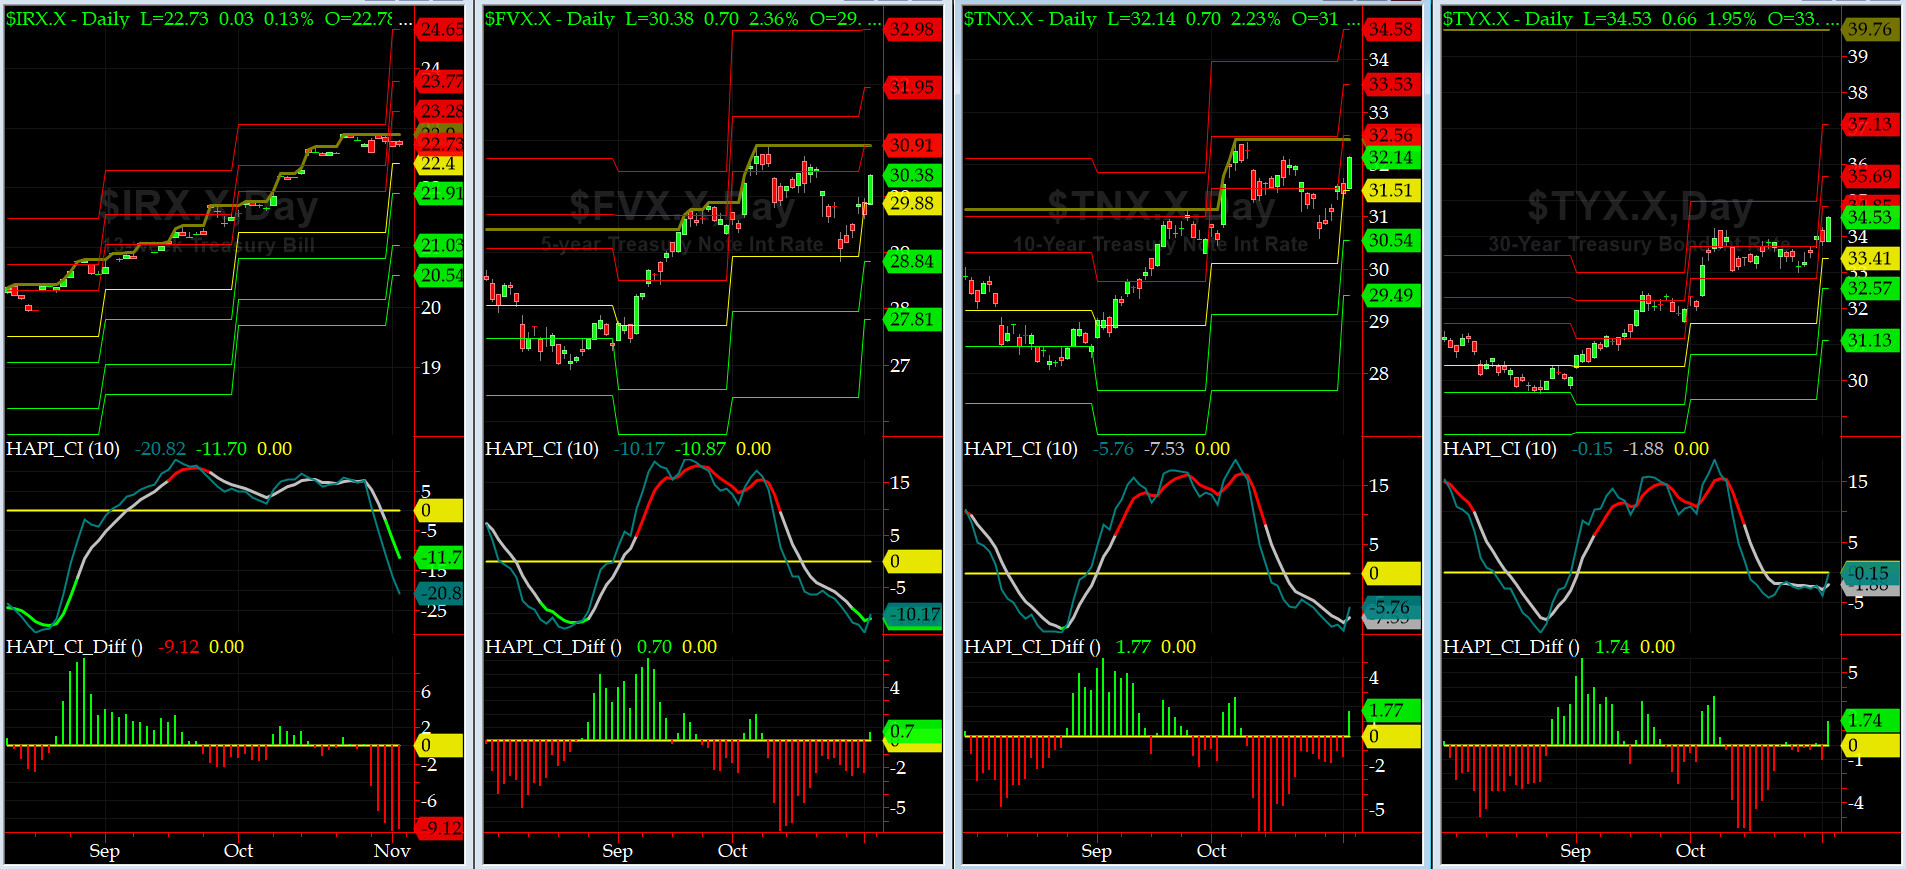
US Treasury T-Notes & T-Bonds Yields Chart
On Friday, the YTMs for T-Notes & T-Bonds rallied hard. Mr & Mrs Maury are uber happy again.......
Fari Hamzei
|


 Proactive Market Timing