|
Monday, November 12, 2018, 0730ET
Market Timing Charts, Analysis & Commentary for Issue #266
Timer Charts of S&P-500 Cash Index (SPX) + NASDAQ-100 Cash Index (NDX)
Most recent S&P-500 Cash Index (SPX): 2781 up +58 (up +2.1%) for the week ending on Friday, November 9, 2018, which closed just about its +0.5 sigma.
DJIA ALL TIME INTRADAY HIGH = 26951 (reached on Wednesday, October 3, 2018)
DJ TRAN ALL TIME INTRADAY HIGH = 11623 (reached on Friday, September 14, 2018)
SPX ALL TIME INTRADAY HIGH = 2941 (reached on Friday, September 21, 2018)
NDX ALL TIME INTRADAY HIGH = 7700 (reached on Thursday, October 1, 2018)
RUT ALL TIME INTRADAY HIGH = 1742 (reached on Friday, August 31, 2018)
Current DAILY +2 Sigma SPX = 2843 with WEEKLY +2 Sigma = 2964
Current DAILY 0 Sigma SPX = 2741 with WEEKLY 0 Sigma = 2820
Current DAILY -2 Sigma SPX = 2638 with WEEKLY -2 Sigma = 2676
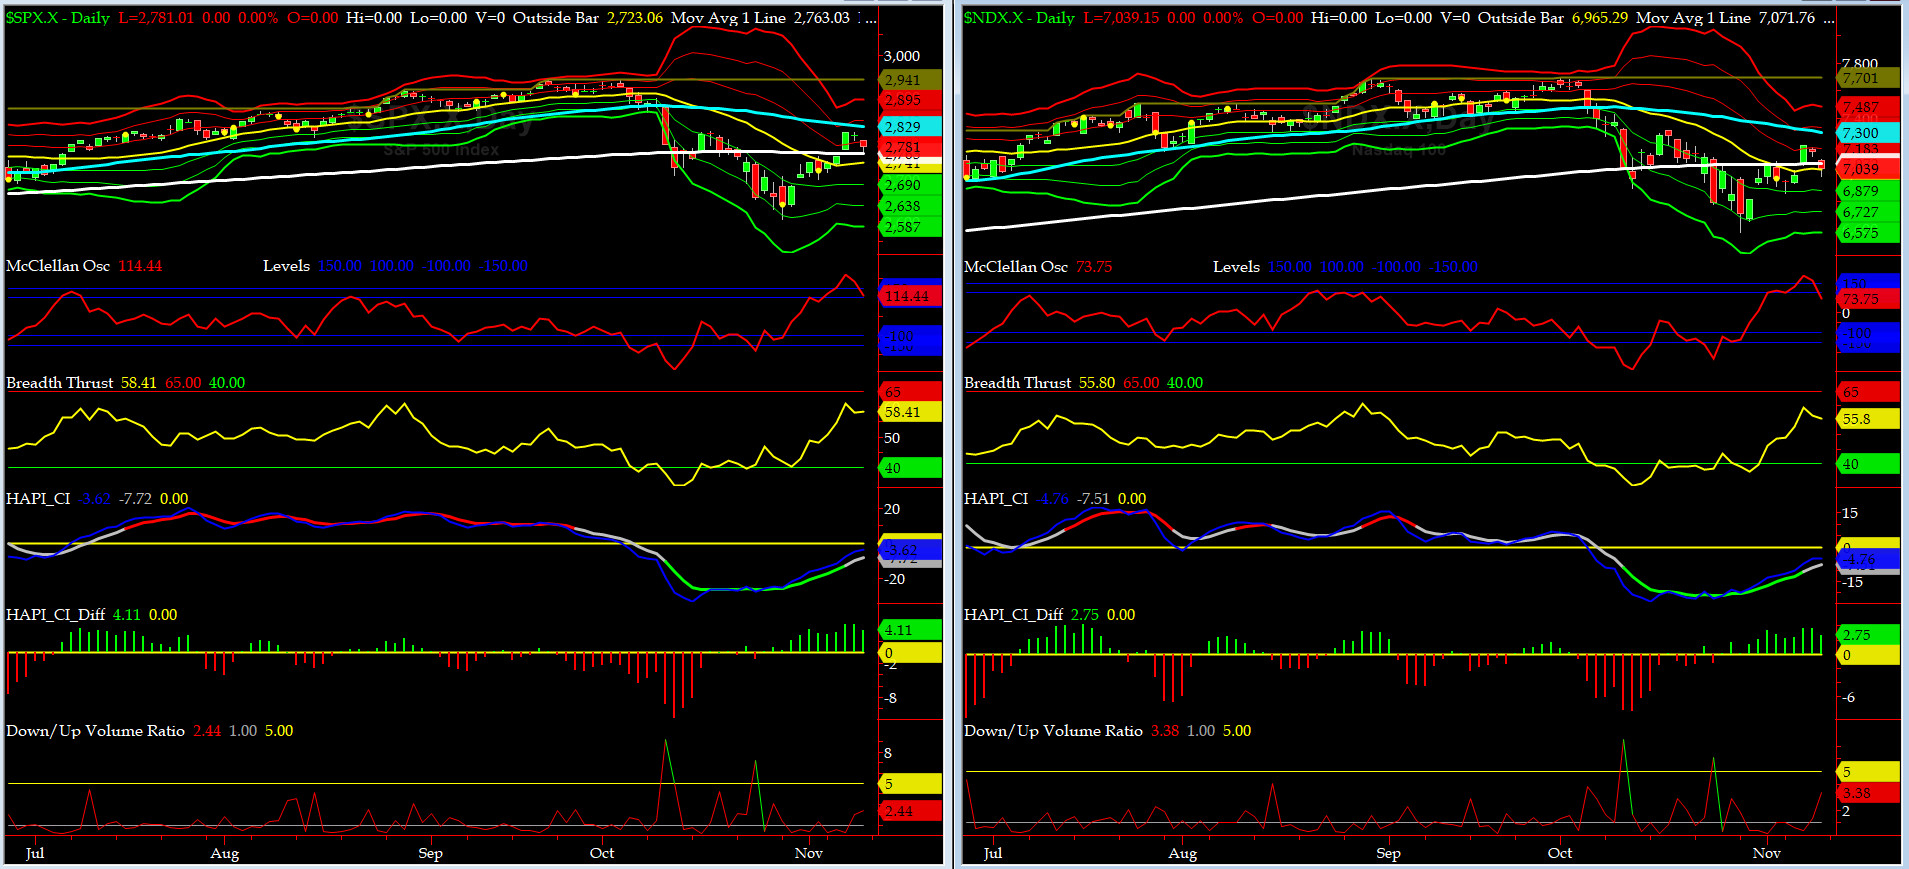
NYSE McClellan Oscillator = +114 (-150 is start of the O/S area; around -275 to -300 area or lower, we go into the �launch-pad� mode; over +150, we are in O/B area)
NYSE Breadth Thrust = 58.4 (40 is considered as oversold and 65 as overbought)
By early Wednesday, it was clear that Goldilocks will be our political system for at least 2 years and markets rallied hard - by Friday we also found out there will be more political storms ahead and our markets sold off hard. More Tea for everyone? Capt Tiko signed a Decree while telling everyone of his 1,200+ Followers YES.
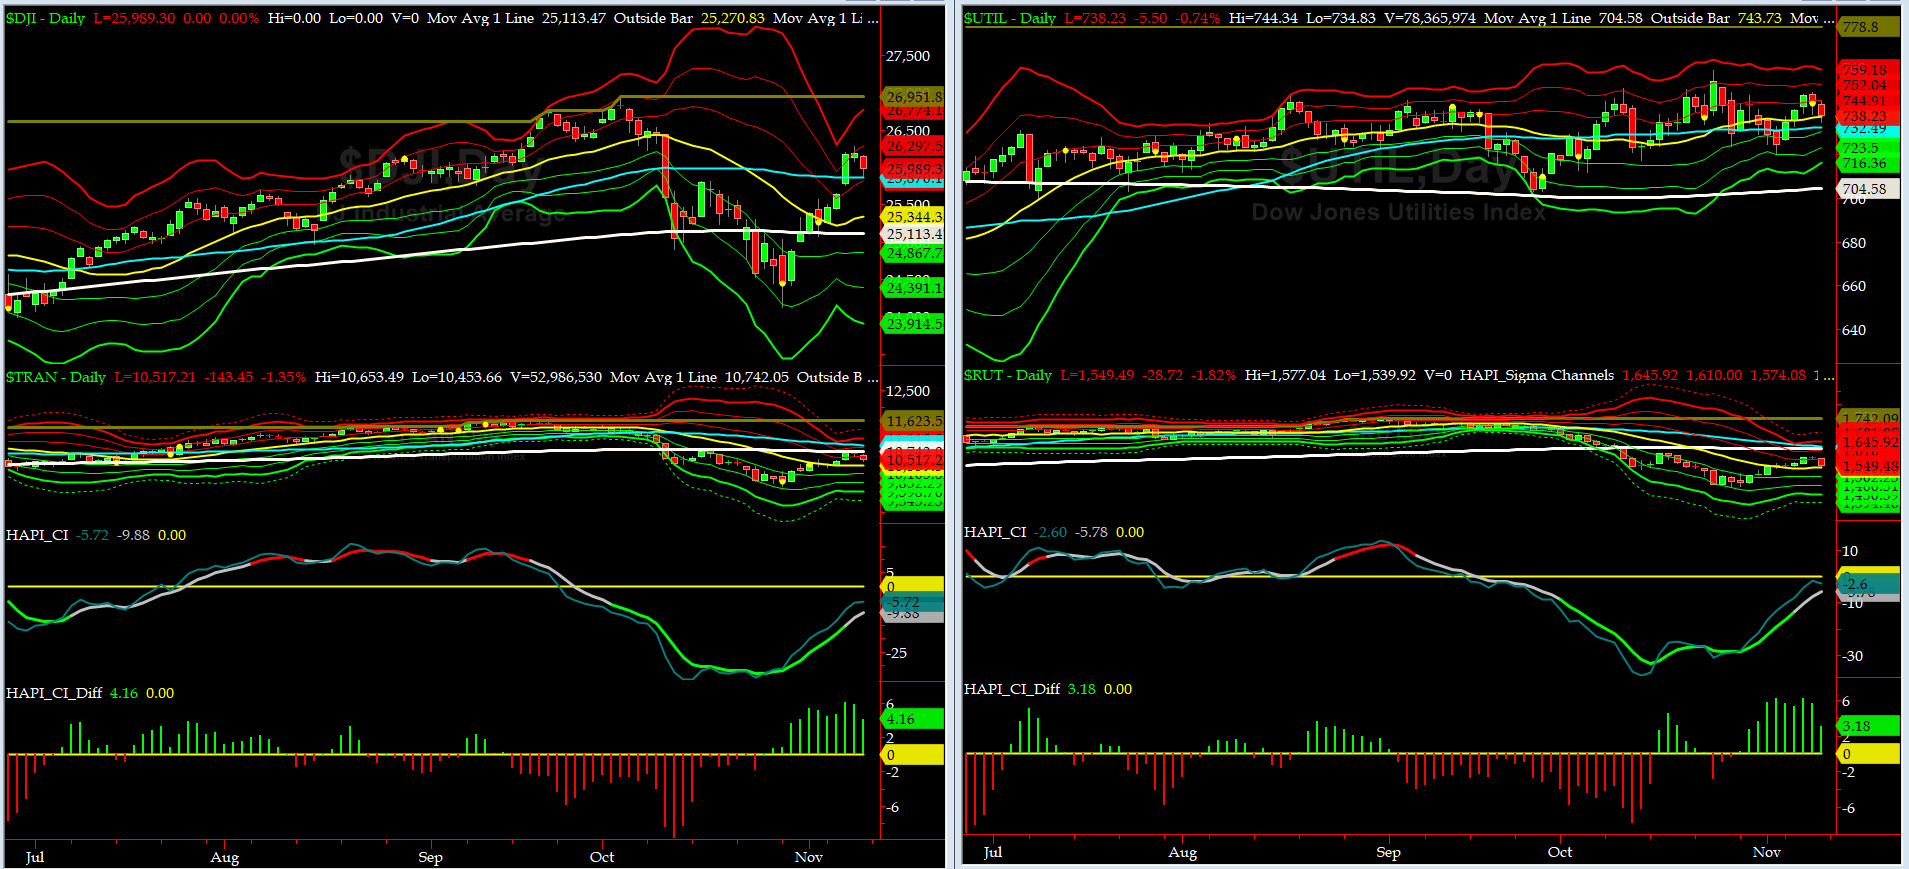
Canaries [in the Coal Mine] Chart for DJ TRAN & RUT Indices
200-Day MA DJ TRAN = 10,742 or 2.1% ABOVE DJ TRAN (max observed in last 7 yrs = 20.2%, min = -20.3%)
200-Day MA RUT = 1616 or 4.1% ABOVE RUT (max observed in last 7 yrs = 21.3%, min = -22.6%)
DJ Transportation Index (proxy for economic conditions 6 to 9 months hence) could not get passed its 200-day MA [for second time in four weeks], while its 50-day MA is getting closer to cross its 200-day MA ("death cross"). Should that occur w/o a quick rebound, we should see more selling thus its name.
Russell 2000 Small Caps Index (proxy for Risk ON/OFF) is also heading fast to its "death cross". RISK is struggling to make a comeback. Stay tuned....
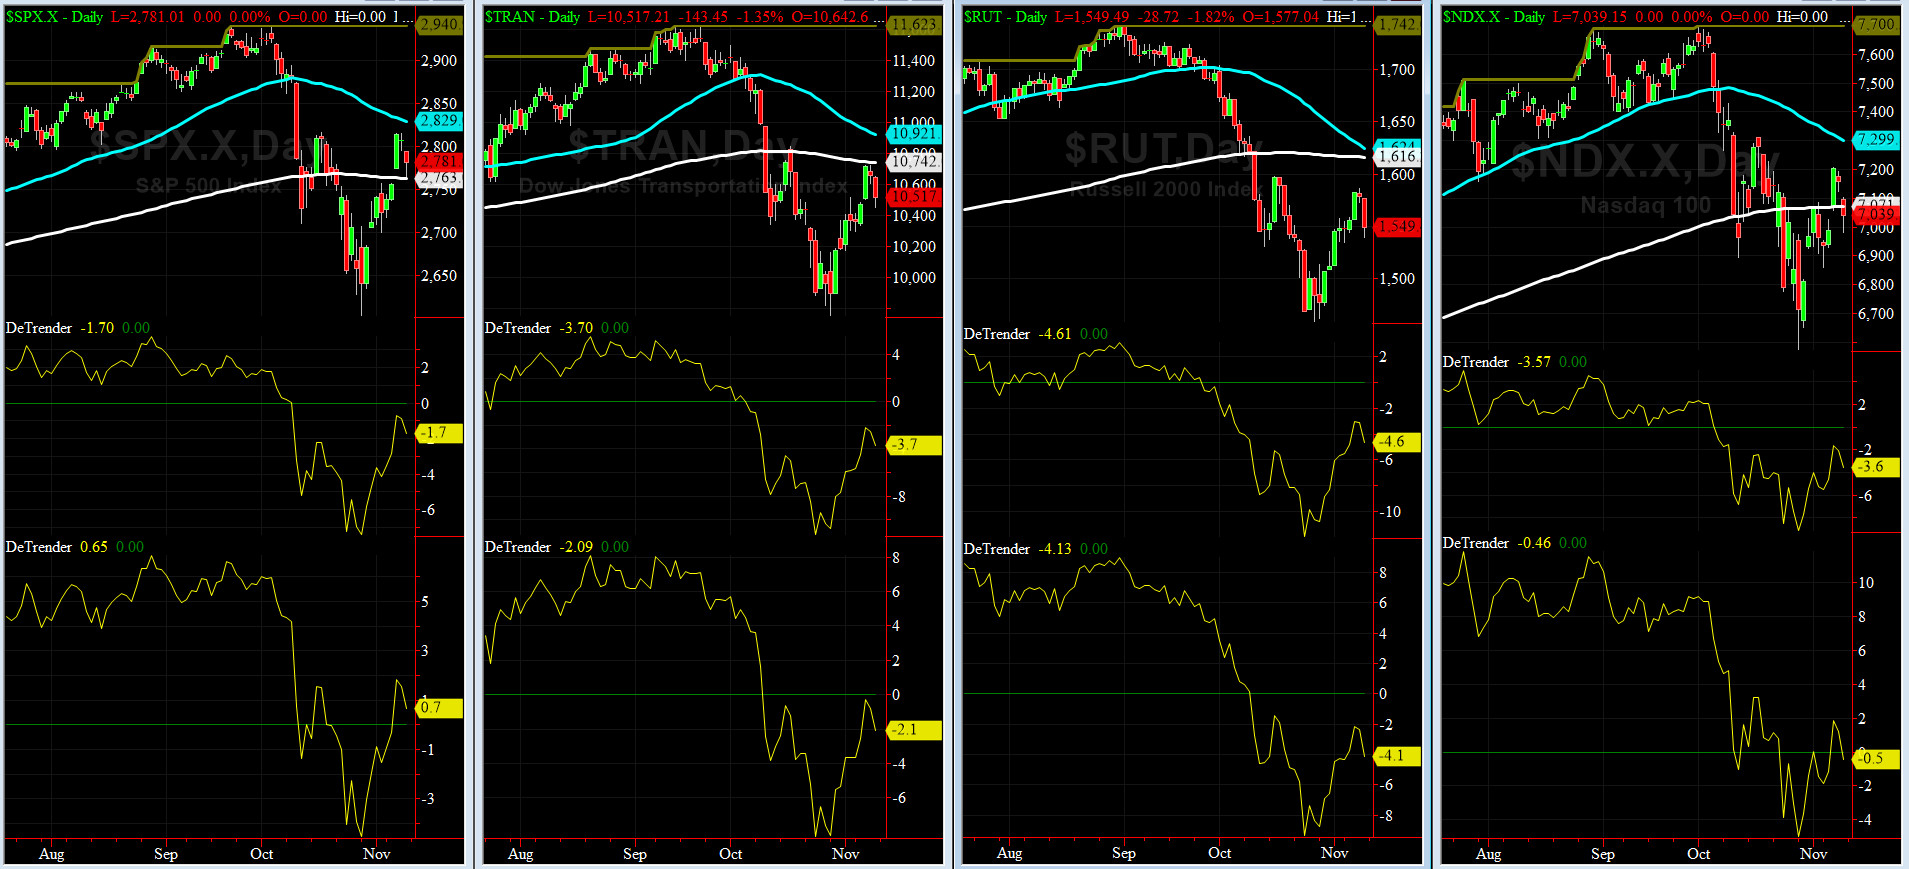
DeTrenders Charts for SPX, NDX, TRAN & RUT Indices
50-Day MA SPX = 2829 or 1.7% ABOVE SPX (max observed in last 7 yrs = +8.6%, min = -9.3%)
200-Day MA SPX = 2763 or 0.7% BELOW SPX (max observed in last 7 yrs = 15.2%, min = -14%)
For the second week in the row, NONE of our EIGHT DeTrenders are in POSITIVE territory. The DeTrenders for DJ Tran & RUT will continue to be harbingers of future price behavior in broad indices.

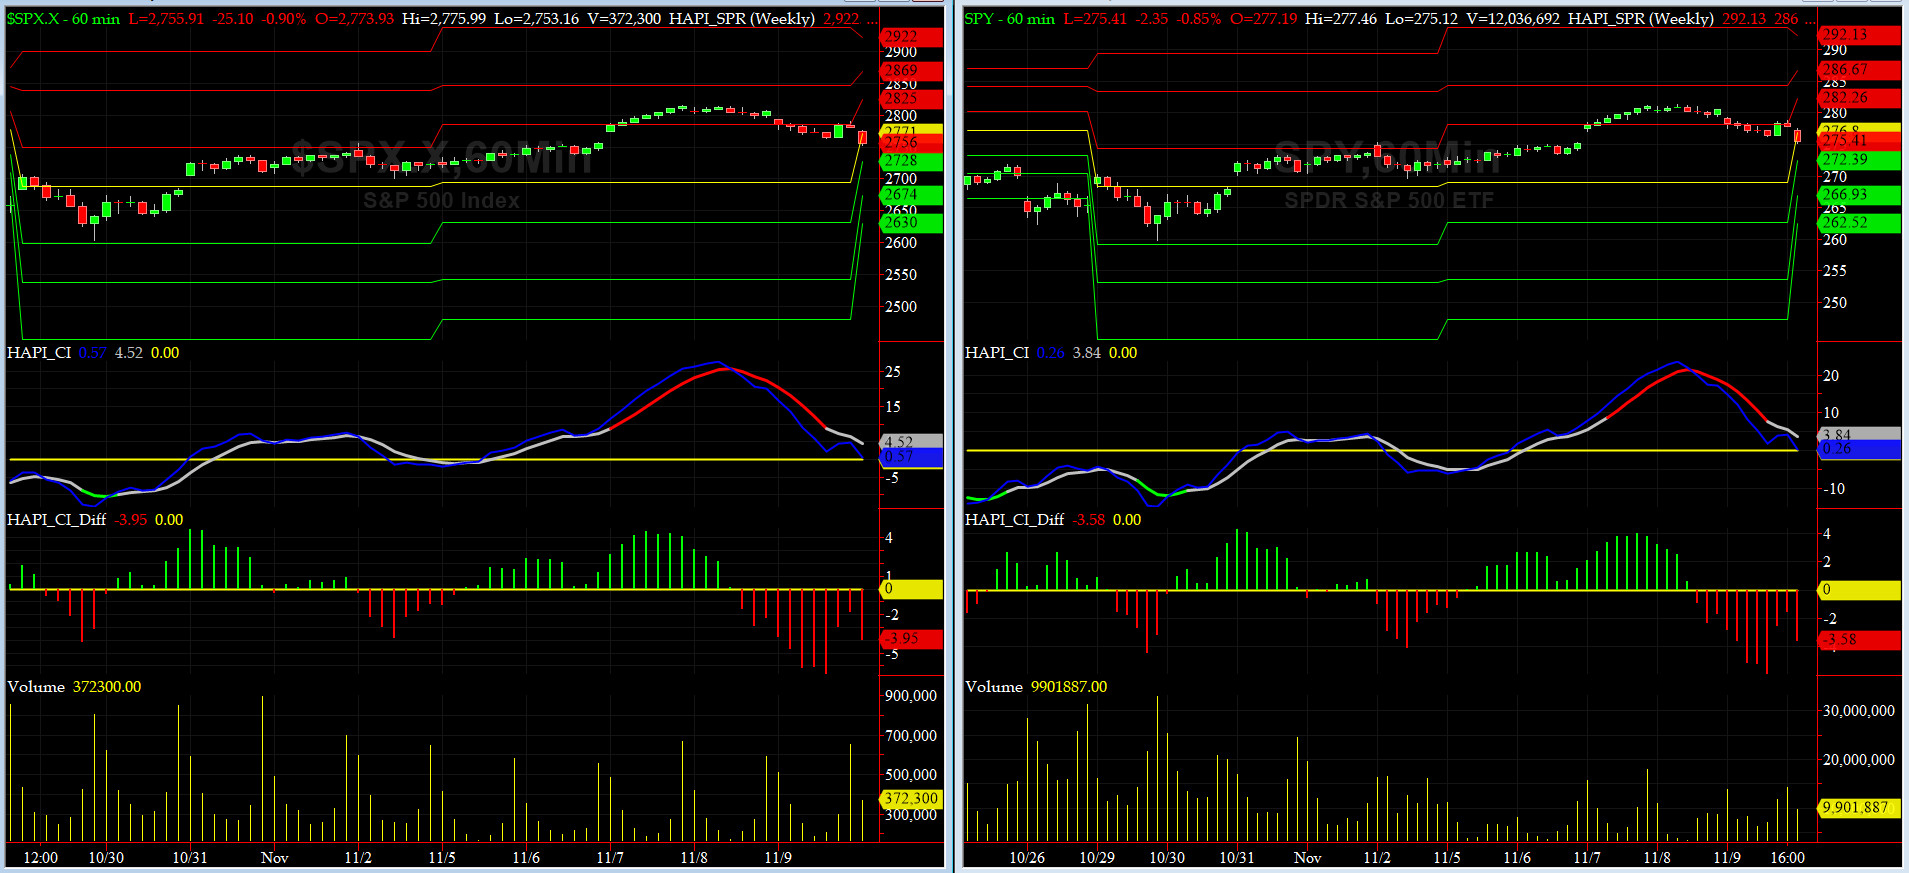
HA_SP1_Momo Chart
WEEKLY Timing Model = on a BUY Signal since Friday, June 15, 2018 CLOSE at 2779
DAILY Timing Model = on a BUY Signal since Monday, November 5, 2018 CLOSE at 2738
Max SPX 52wk-highs reading last week = 13 (over 120-140, the local maxima is in)
Max SPX 52wk-Lows reading last week = 65 (over 40-60, the local minima is in)
HA_SP1 closed at its +1.5 sigma channels
HA_Momo = +5.4 (reversals most likely occur above +10 or below -10)
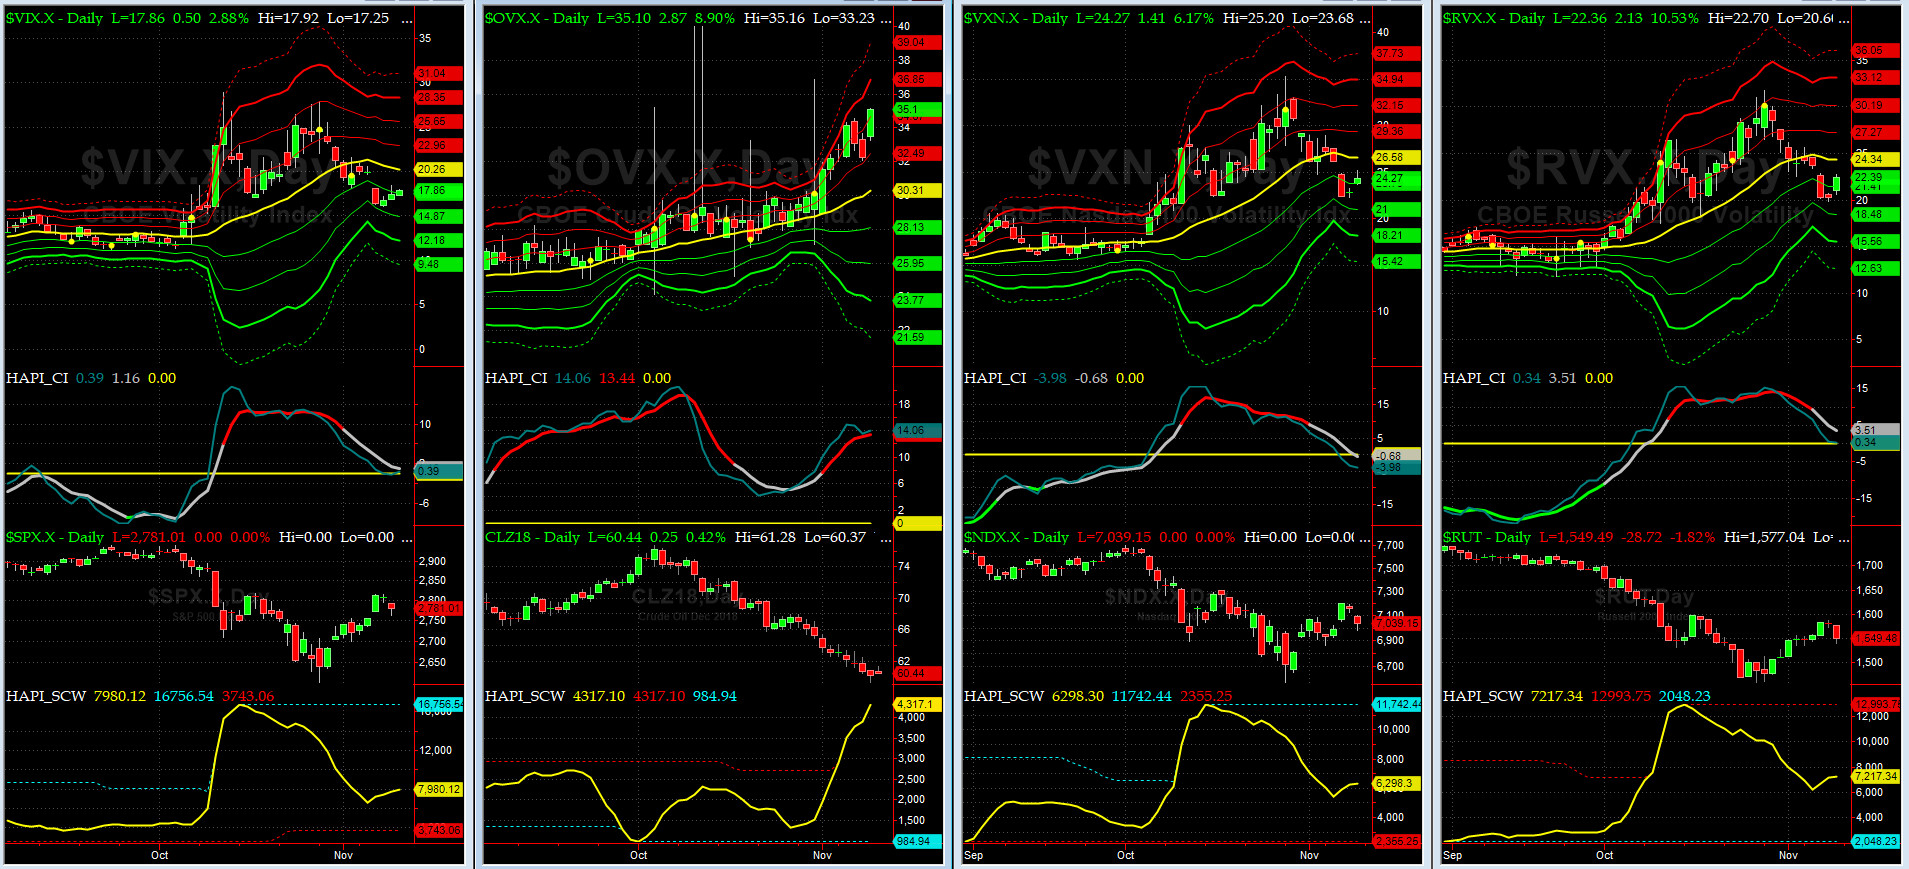
Vol of the Vols Chart
Spot VIX currently stands at 17.8, right about its -1 sigma (remember it's the VIX volatility pattern aka "its sigma channels" that matters, and not the level of VIX itself (this is per Dr. Robert Whaley, a great mentor and inventor of original VIX, now called VXO). VIX usually peaks around a test of its +4 sigma).
VIX & VXN both pulled back hard this past week.
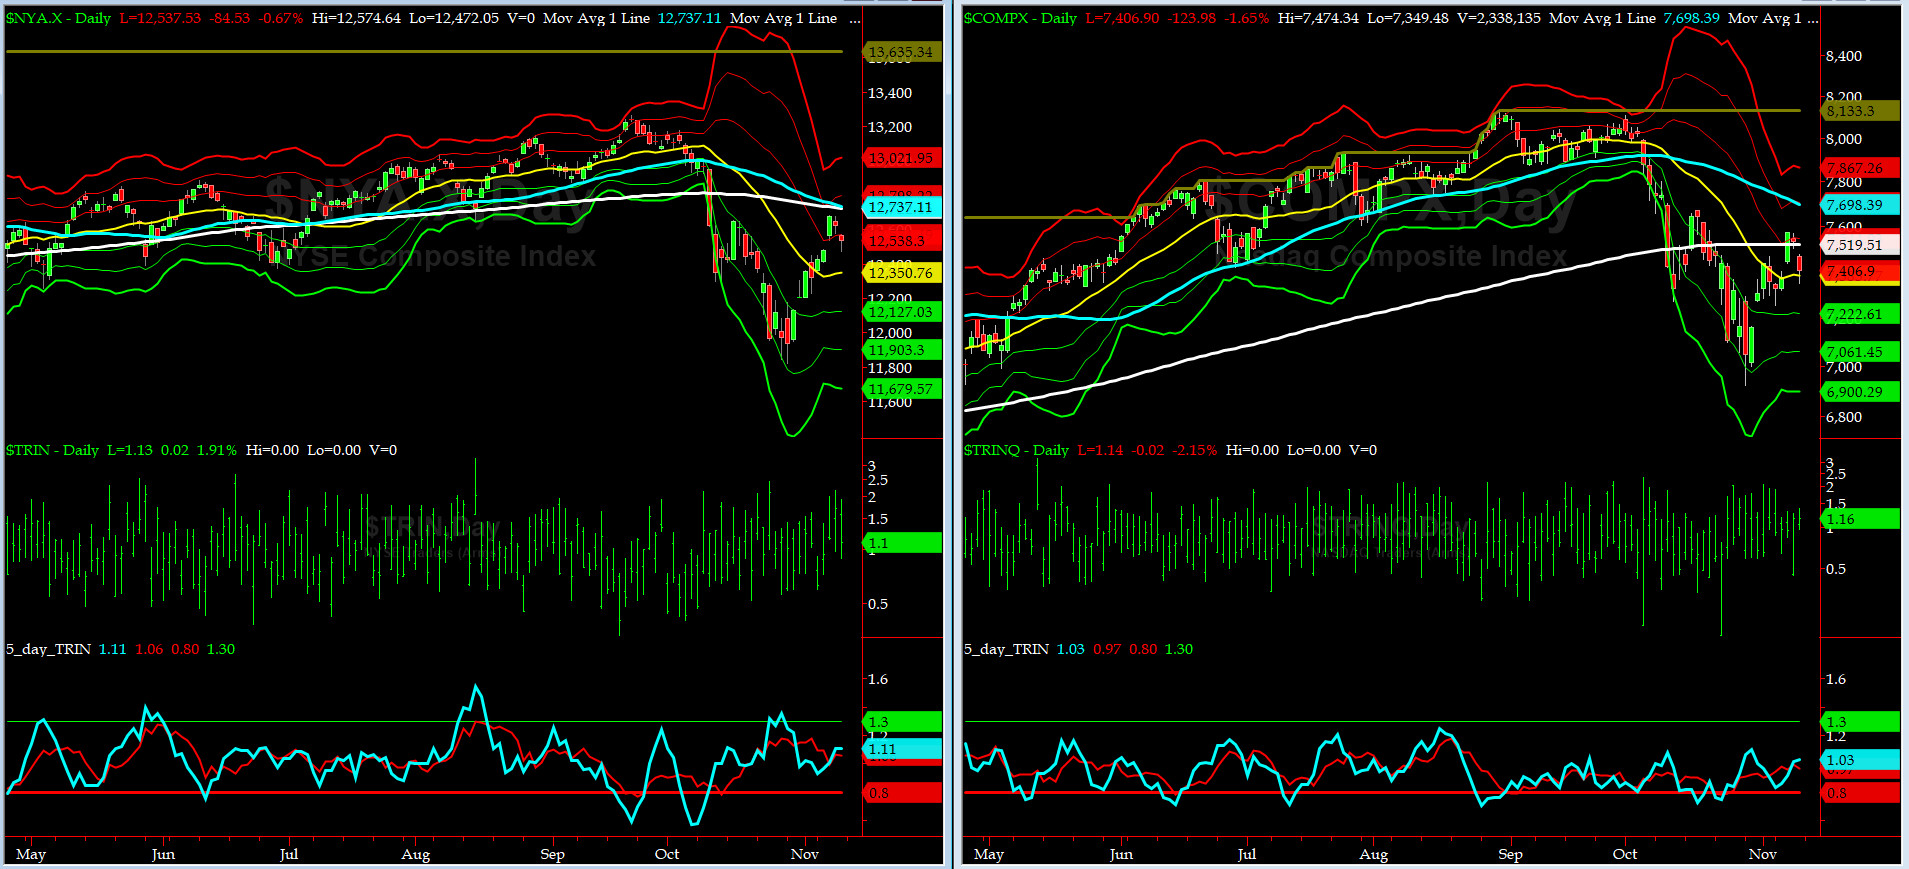
5-day TRIN & TRINQ Charts
Both NYSE 5-day TRIN & NASDAQ 5-day TRINQ are in the NEUTRAL zone.
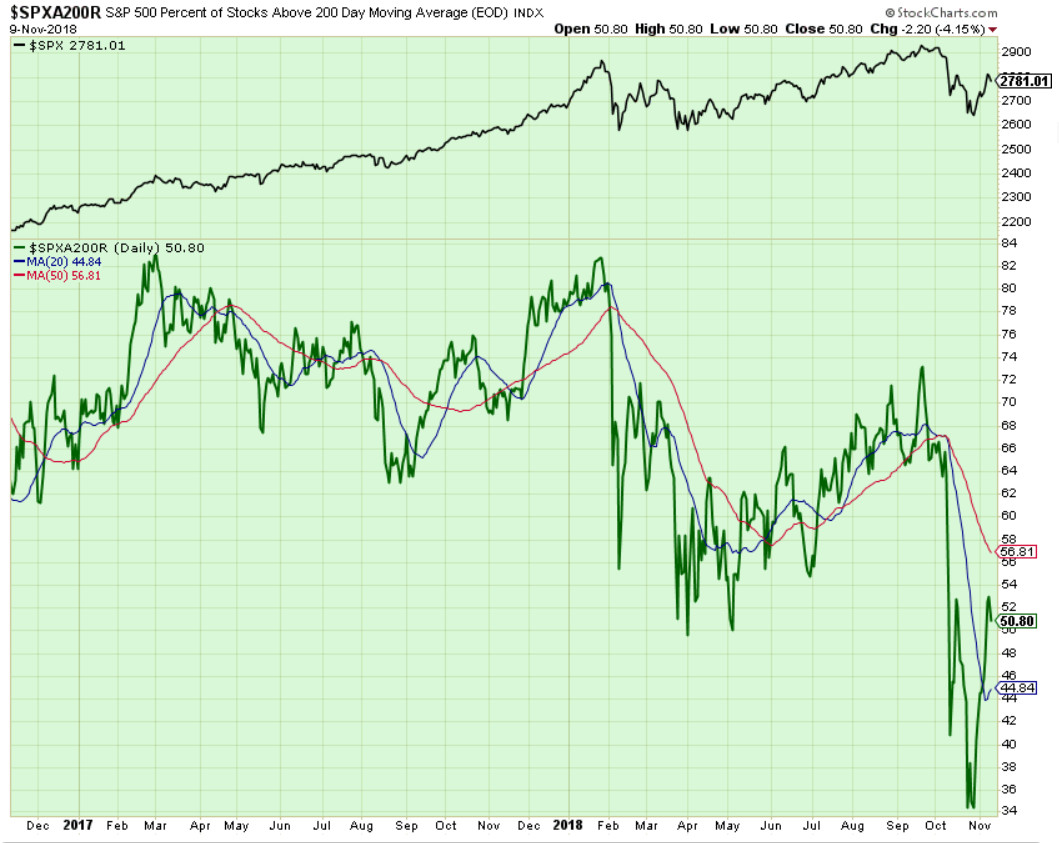
Components of SPX above their respective 200day MA Chart
This scoring indicator rallied to 50% area after crossing its 20-day MA at 45% area.
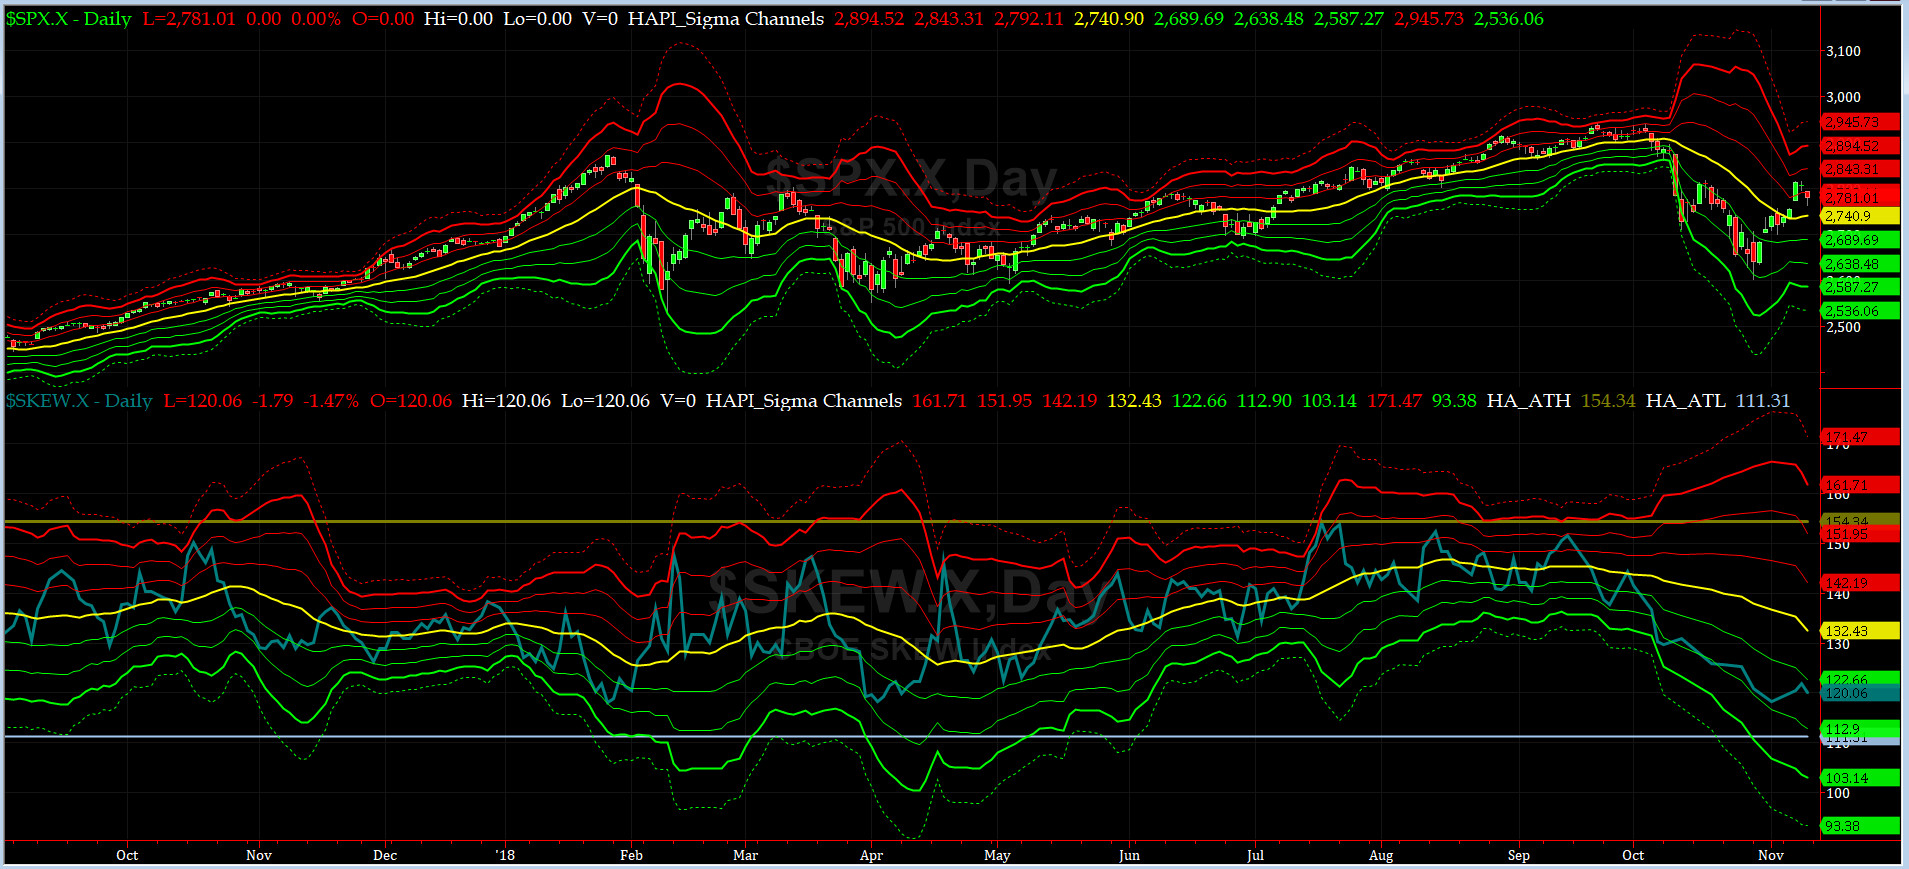
SPX SKEW (Tail Risk) Chart
On Friday, SPX SKEW (Tail Risk) closed near 120, still about its -2 sigma (normal = 120-125, range 100-150).
Is all quiet on the Eastern & Mid-Western Fronts? Our beloved @Capt_Tiko still says MAYBE....
How to interpret the value of SPX SKEW? (from CBOE white paper on SKEW)

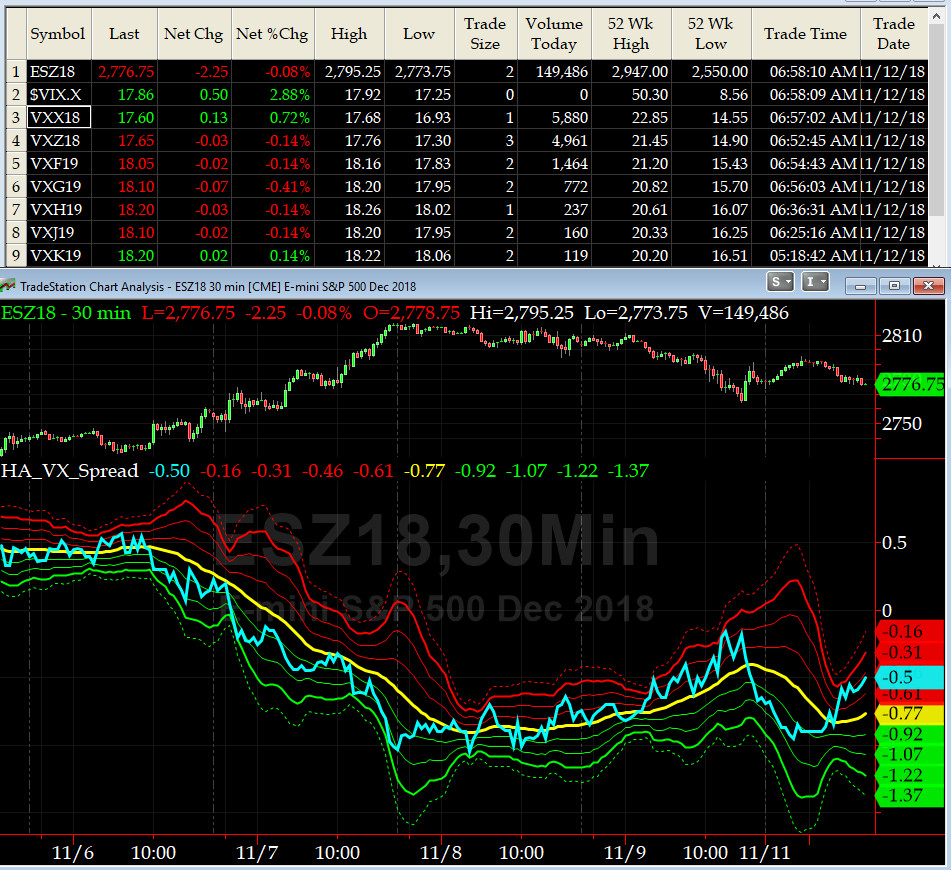
3-month VIX Futures Spread(VX) Chart
This popular timing indicator, (long NOV18, & short FEB19 VIX Futures) closed at -0.65 which is a tad NEUTRAL.
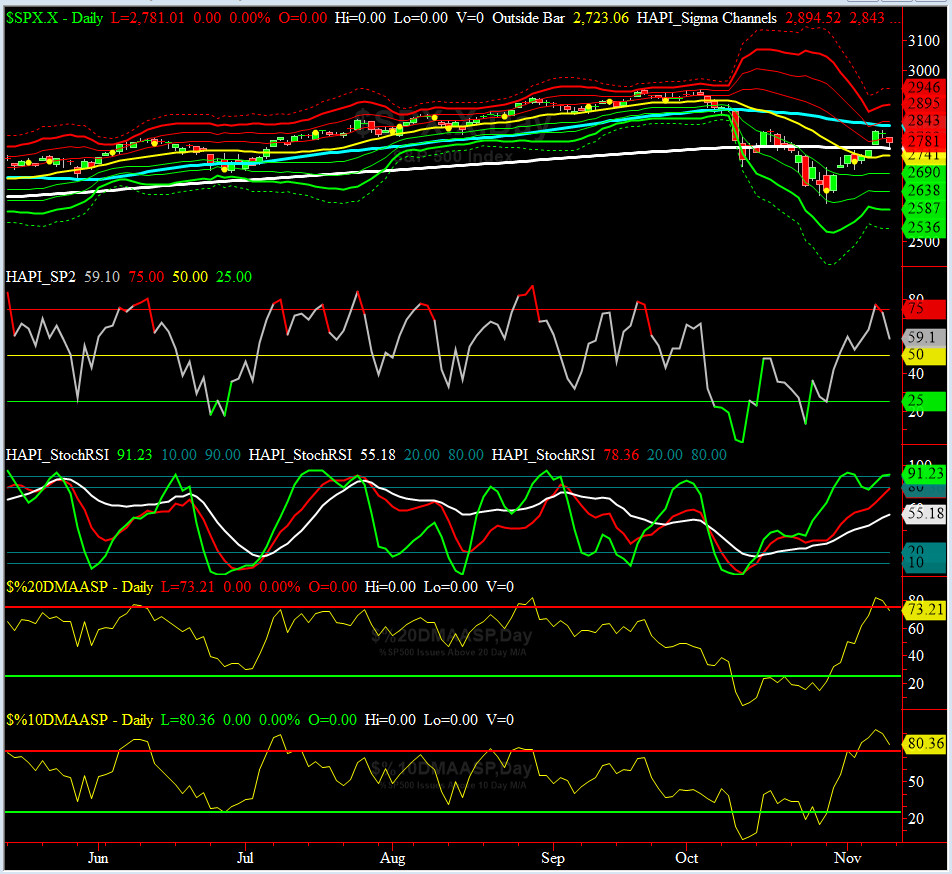
HA_SP2 Chart
HA_SP2 = 53 (Buy signal <= 25, Sell Signal >= 75)
Our coveted SP2 prop indicator rallied from 77 and then settled at 59 on Friday. This is a slight overbought reading.
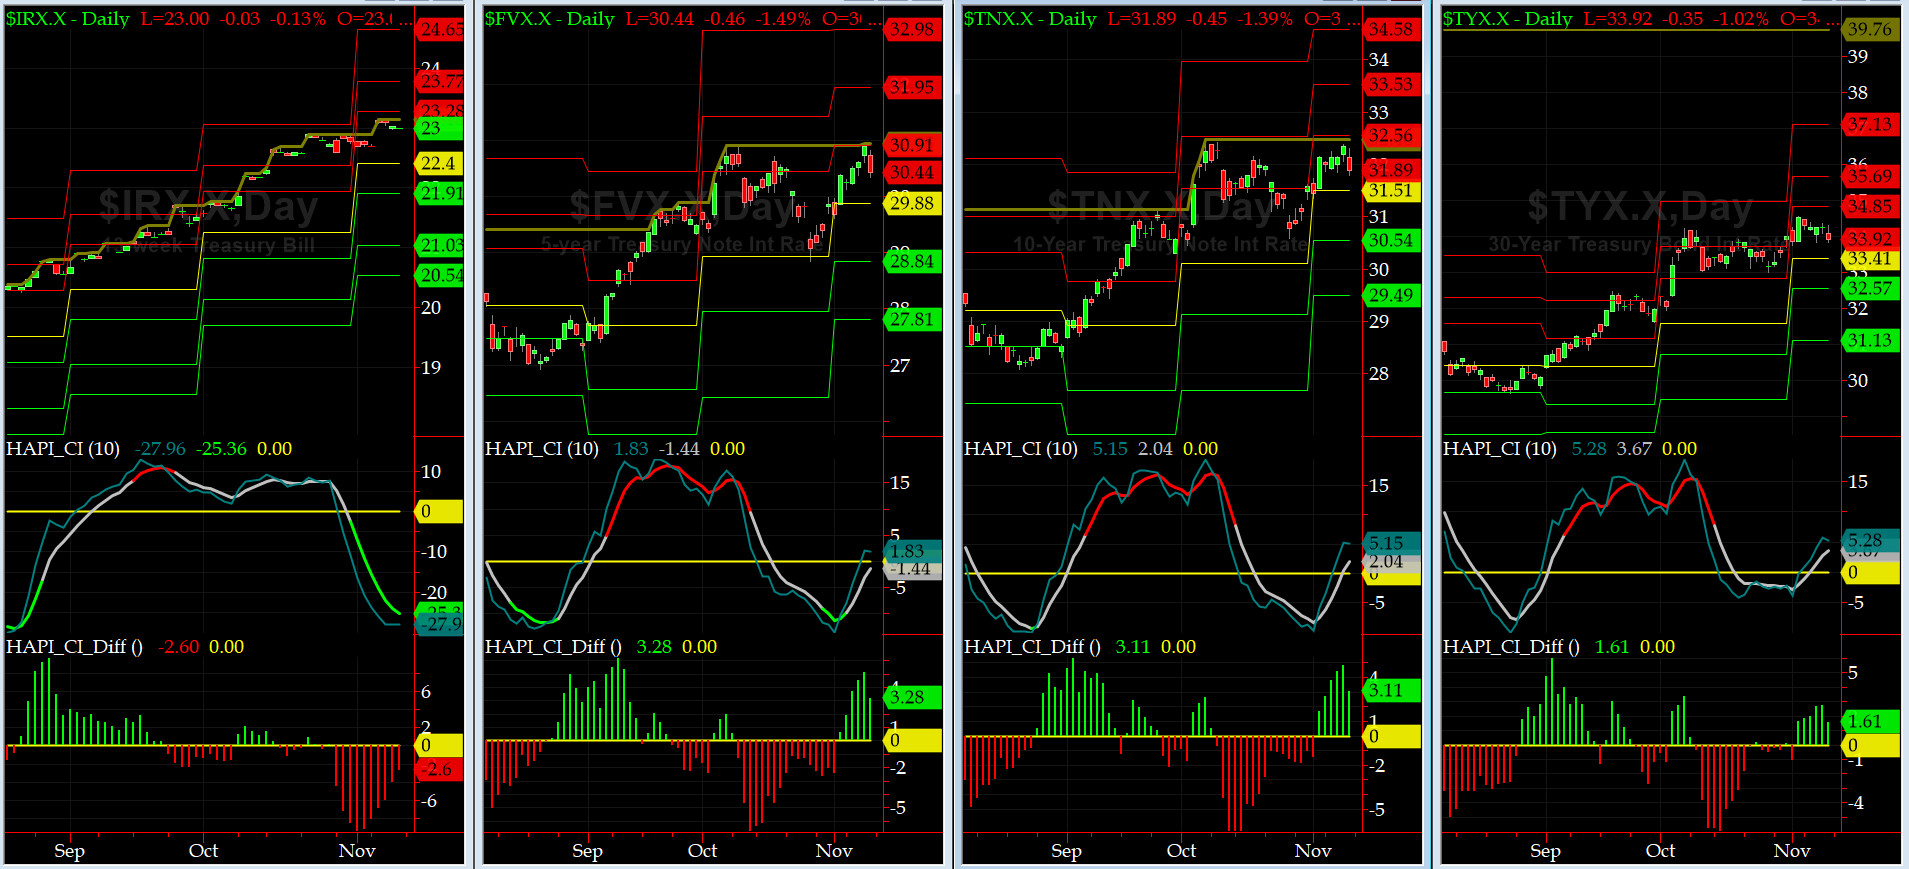
US Treasury T-Notes & T-Bonds Yields Chart
On Friday, the five & ten year YTMs rallied to new 7 yr highs. Mr & Mrs Maury remain jubilant.......
Fari Hamzei
|


 Proactive Market Timing