
|
 |
 |
 |
 |
 |
 |
 |
 |
 Proactive Market Timing Proactive Market Timing
|
|
|
Most Recent PMT vs SPX Performance Chart

|
|
|
|
Wednesday, December 5, 2018, 2326ET
Notice of Change of Bias with Timer Digest
Dear Jim,
With State Funeral of George Herbert Walker Bush, 41 behind us, we resume our SHORT SPX bias�����.
Worth noting https://news.usni.org/2018/12/04/navy-jets-depart-for-texas-ahead-of-unprecedented-21-aircraft-flyover-for-bush-funeral
Both [Pride of the Fleet] F-18E/F SuperHornets and Nimitz-class supercarrier USS George WH Bush CVN-77 were designed & built, by my alma mater, Northrop Grumman.
During WWII, GHWBush41 flew 58 combat missions in torpedo bomber TBM Avengers, also designed & built by Grumman Aircraft, based in Long Island, NY.
Fari Hamzei
|
|
|
|
|
|
Tuesday, December 4, 2018, 1559ET
Notice of Change of Bias with Timer Digest
Dear Jim,
Out of respect for GHWB 41, we shall be out of the markets tomorrow, so we are going FLAT SPX now���
Fari Hamzei
|
|
|
|
|
|
Tuesday, December 4, 2018, 1030ET
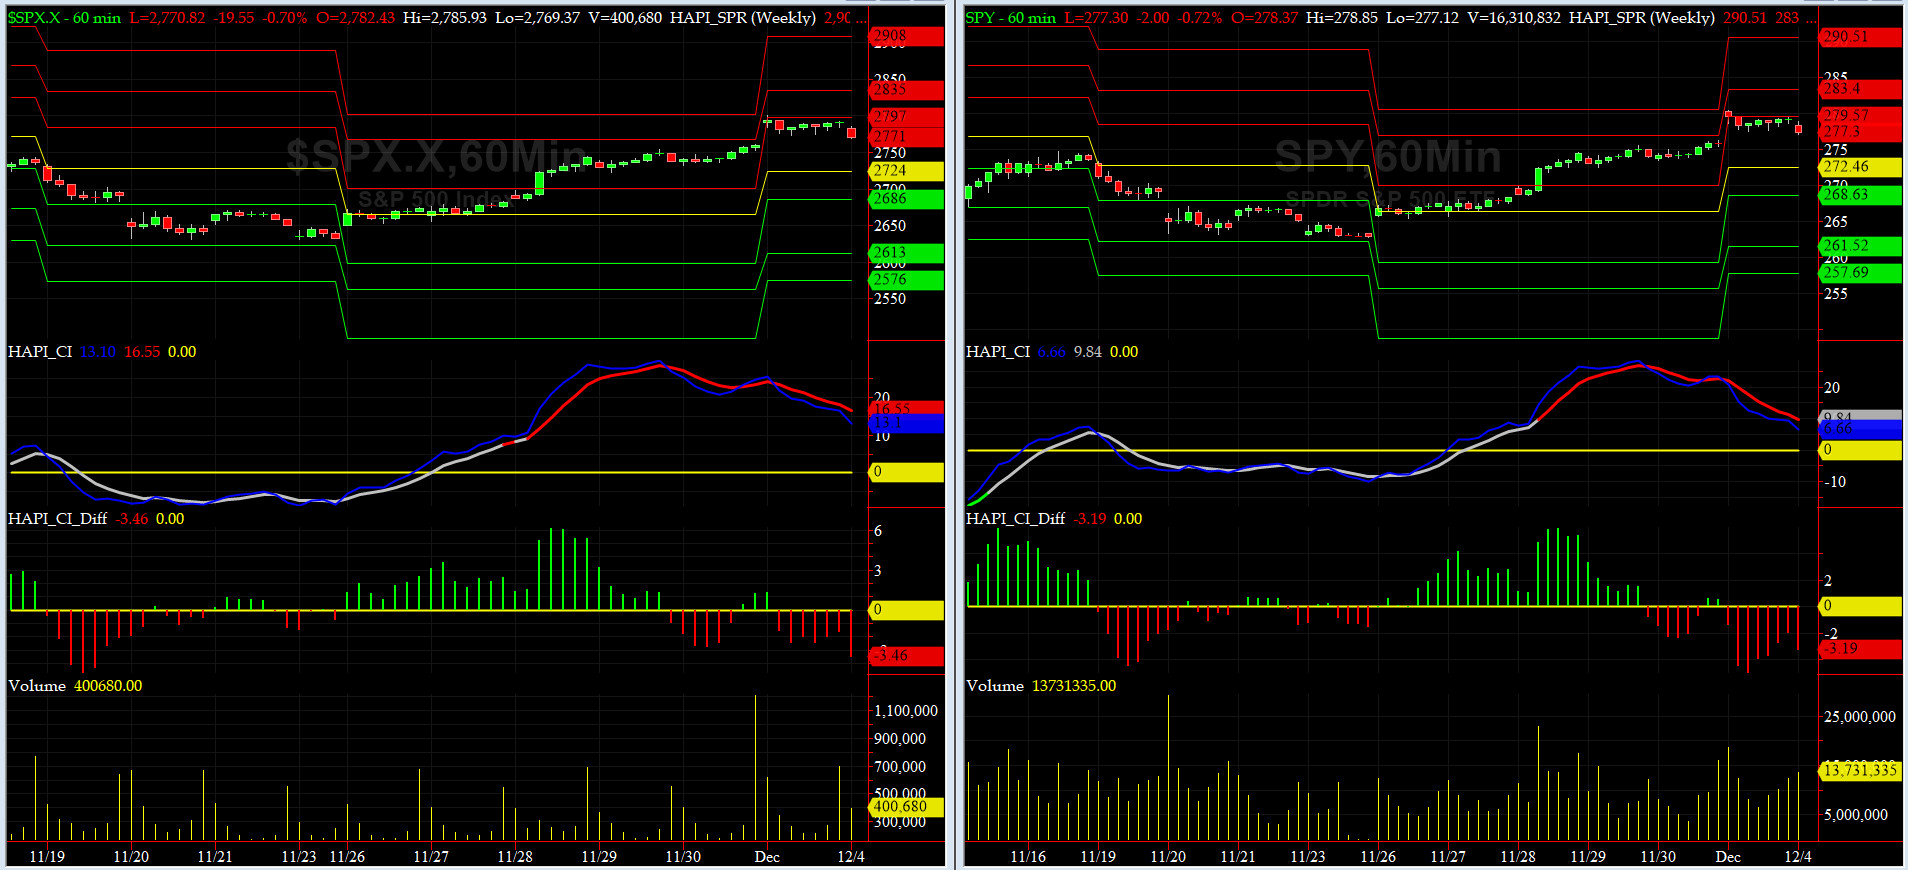
UPDATED Companion Chart for Market Bias Review, Issue #269
|
|
|
|
|
|
Tuesday, December 4, 2018, 1025ET
UPDATED Market Bias for Issue #269
Our current Market Bias with Timer Digest is SHORT SPX as of DEC 3 at 2790
Our previous Market Bias was LONG SPX as of Nov 30 at 2760
Here are the trade parameters for this week:
SPX Money Management Stop for 100% of our position = 2785
SPX BreakEven Stop (Current Price) for last 20% of our position = 2772
SPX Primary Profit Target for first 80% of our position = 2740
SPX Secondary Profit Target for last 20% of our position = 2725
|
| Action |
Asset |
Expiration |
Strike |
Option |
| BUY |
SPY |
Friday DEC 14 |
277 |
Puts |
| SELL SHORT |
SPY |
Friday DEC 14 |
272 |
Puts |
| You need to execute both legs and hold it as a Put-Spread.
|
Note A:
Once the Primary Profit Target has been reached, traders are advised to close 80% of their position in order to lock in profits. The remaining balance can be carried over with a BreakEven STOP, based on the SPX level at the time of entry, in order to make the trade a zero-risk trade with the final position running to reach the Secondary Profit Target.
Once either Secondary Profit or Money Management (BreakEven STOP after the 80% peel-off) is hit, our Option/ETF trade for that week is over. Go to Cash and wait for the next PMT Issue.
Note B:
When we change our Market Bias with Timer Digest, You need to go FLAT asap. With PMT Pro, that is before the Close that day and with the basic PMT, at the open of the next day. The following trading day, we will issue new SPX targets and a new SPY options trade, as long our new market bias with Timer Digest is NOT flat.
Fari Hamzei
|
|
|
|
|
|
Tuesday, December 4, 2018, 0005ET
Notice of Change of Bias with Timer Digest
Dear Jim,
Today�s market action was quite disappointing, once one carefully peels off just a few layers -- pure price action, internals & momentum readings during the RTH session were less than stellar, and at the Close, our equity markets gave away almost half of their overnight gains.
Given the tumultuous legal calendar Team Mueller has planned for this week, we will hereby cautioulsy change tact and get SHORT SPX now now now�.
Fari Hamzei
|
|
|
|
|
|
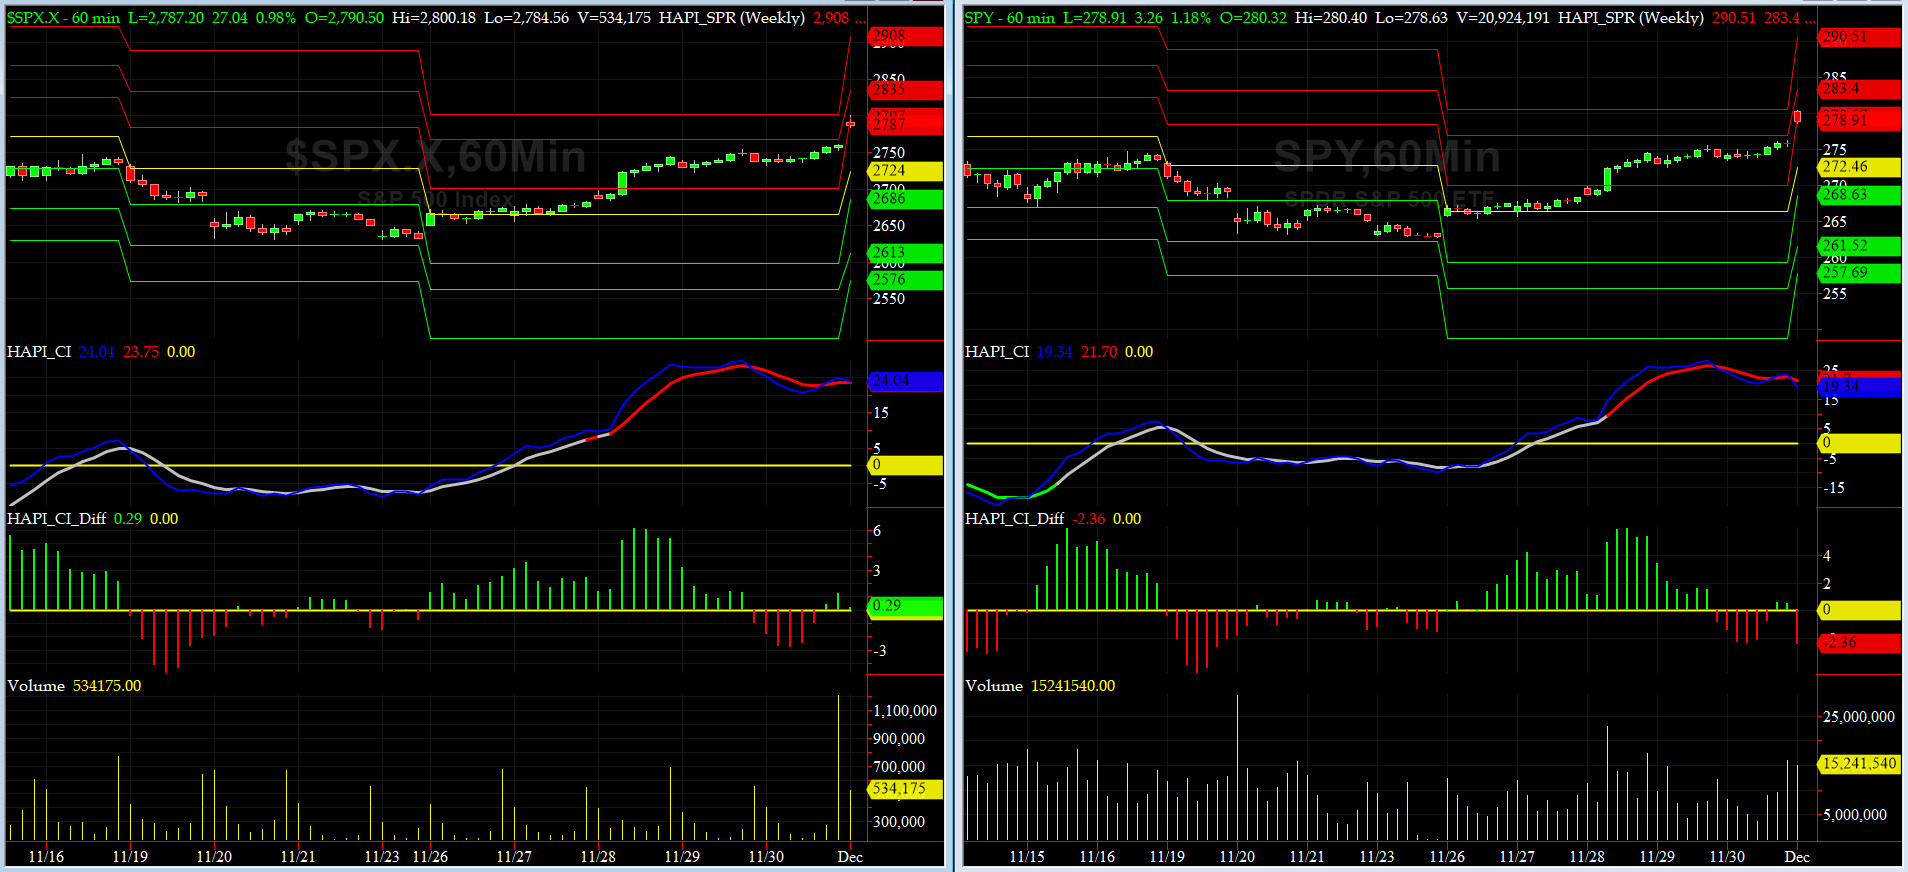
Monday, December 3, 2018, 1017ET
Companion Chart for Market Bias Review, Issue #269
|
|
|
|
|
|
Monday, December 3, 2018, 1015ET
Market Bias for Issue #269
Our current Market Bias with Timer Digest is LONG SPX as of NOV 30 at 2760
Our previous Market Bias was FLAT SPX as of NOV 28 at 2744
Here are the trade parameters for this week:
SPX Secondary Profit Target for last 20% of our position = 2830
SPX Primary Profit Target for first 80% of our position = 2815
SPX BreakEven Stop (Current Price) for last 20% of our position = 2786
SPX Money Management Stop for 100% of our position = 2770
|
| Action |
Asset |
Expiration |
Strike |
Option |
| BUY |
SPY |
Friday DEC 14 |
278 |
Calls |
| SELL SHORT |
SPY |
Friday DEC 14 |
283 |
Calls |
| You need to execute both legs and hold it as a Call-Spread.
|
Note A:
Once the Primary Profit Target has been reached, traders are advised to close 80% of their position in order to lock in profits. The remaining balance can be carried over with a BreakEven STOP, based on the SPX level at the time of entry, in order to make the trade a zero-risk trade with the final position running to reach the Secondary Profit Target.
Once either Secondary Profit or Money Management (BreakEven STOP after the 80% peel-off) is hit, our Option/ETF trade for that week is over. Go to Cash and wait for the next PMT Issue.
Note B:
When we change our Market Bias with Timer Digest, You need to go FLAT asap. With PMT Pro, that is before the Close that day and with the basic PMT, at the open of the next day. The following trading day, we will issue new SPX targets and a new SPY options trade, as long our new market bias with Timer Digest is NOT flat.
Fari Hamzei
|
|
|
|
|
|
Sunday, December 2, 2018, 1851ET
Notice of Change of Bias with Timer Digest
Dear Jim,
As we wrote you Friday after the Close, we planned to see what Grumpino accomplishes with Xi at their Saturday Dinner in Argentia.
Looks like the futures market like it (so far). We are getting LONG SPX�.
Fari Hamzei
|
|
|
|
|
|
Sunday, December 2, 2018, 1700ET
Market Timing Charts, Analysis & Commentary for Issue #269
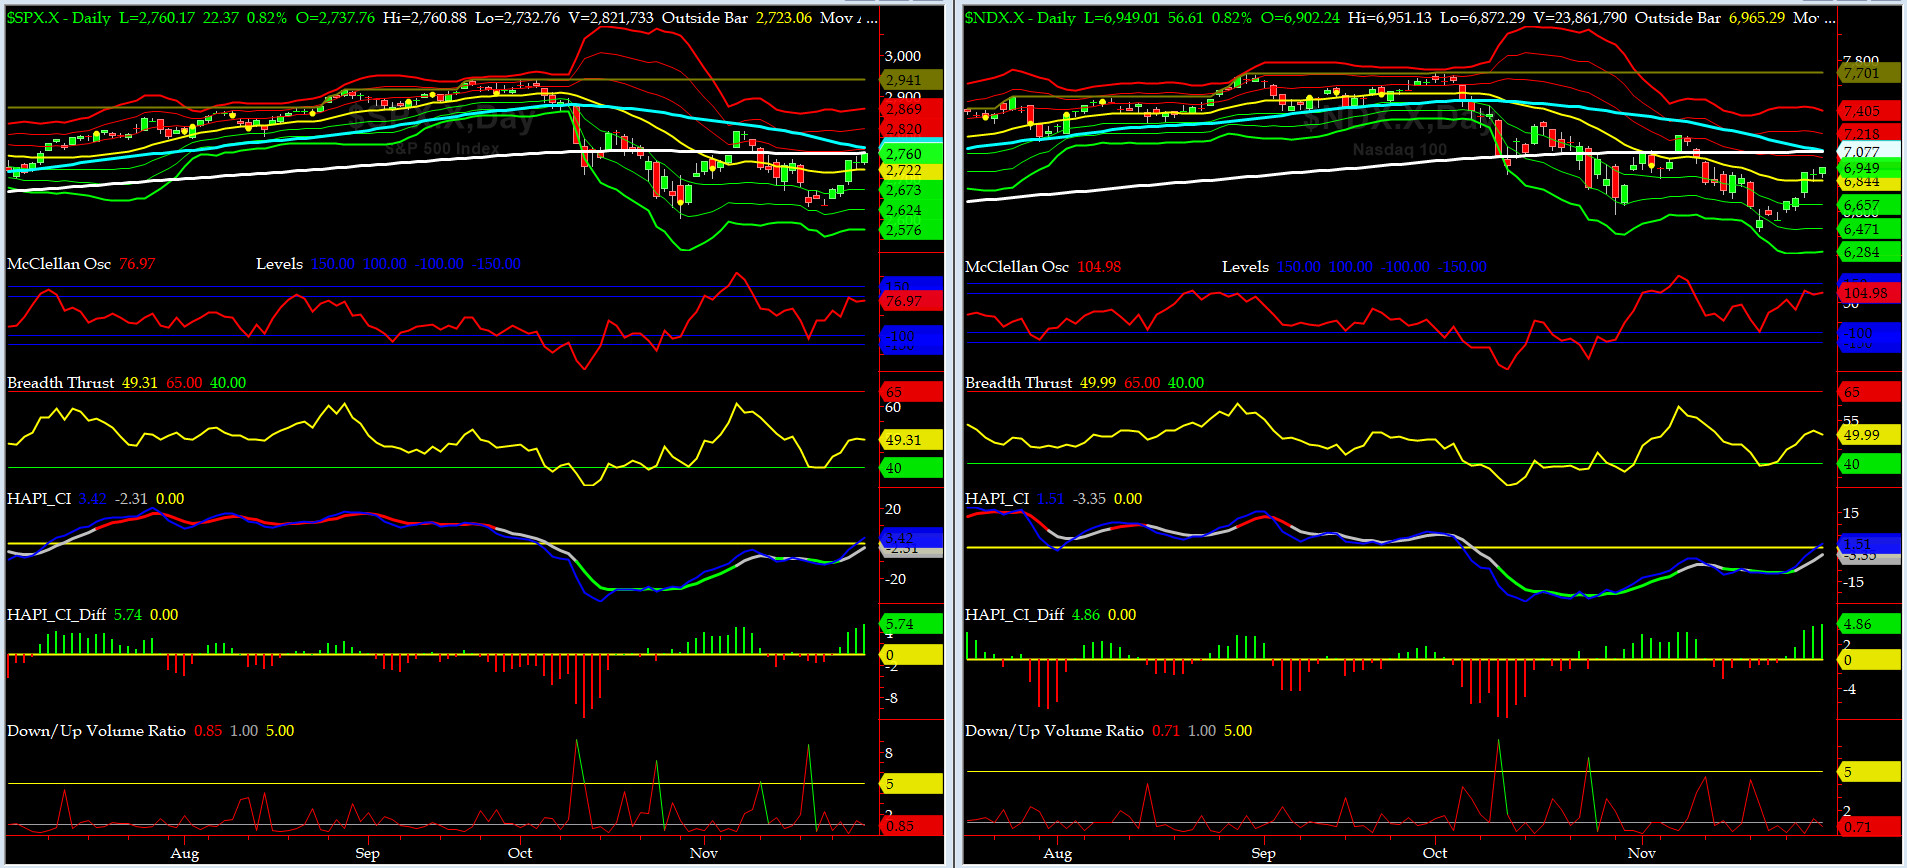
Timer Charts of S&P-500 Cash Index (SPX) + NASDAQ-100 Cash Index (NDX)
Most recent S&P-500 Cash Index (SPX): 2760 up +128 (up +4.9%) for the week ending on Friday, November 30, 2018, which closed just a tad below its +1 sigma.
DJIA ALL TIME INTRADAY HIGH = 26951 (reached on Wednesday, October 3, 2018)
DJ TRAN ALL TIME INTRADAY HIGH = 11623 (reached on Friday, September 14, 2018)
SPX ALL TIME INTRADAY HIGH = 2941 (reached on Friday, September 21, 2018)
NDX ALL TIME INTRADAY HIGH = 7700 (reached on Thursday, October 1, 2018)
RUT ALL TIME INTRADAY HIGH = 1742 (reached on Friday, August 31, 2018)
Current DAILY +2 Sigma SPX = 2820 with WEEKLY +2 Sigma = 2976
Current DAILY 0 Sigma SPX = 2722 with WEEKLY 0 Sigma = 2813
Current DAILY -2 Sigma SPX = 2624 with WEEKLY -2 Sigma = 2649
NYSE McClellan Oscillator = +77 (-150 is start of the O/S area; around -275 to -300 area or lower, we go into the �launch-pad� mode; over +150, we are in O/B area)
NYSE Breadth Thrust = 49.3 (40 is considered as oversold and 65 as overbought)
Huge run-up caused by the comments of our beloved (and Princeton-educated) Jerome Powell, the Fed Chair, blew all the shorts out the ballpark -- last two weeks has afforded us a rare opportunity to take out over 2,100 Dow points of this market. Frankly, Capt Tiko & I are exhausted and thinking about hitting the Cheeca Lodge (Bush Family fav FL vacation spot) in the FL Keys soon.
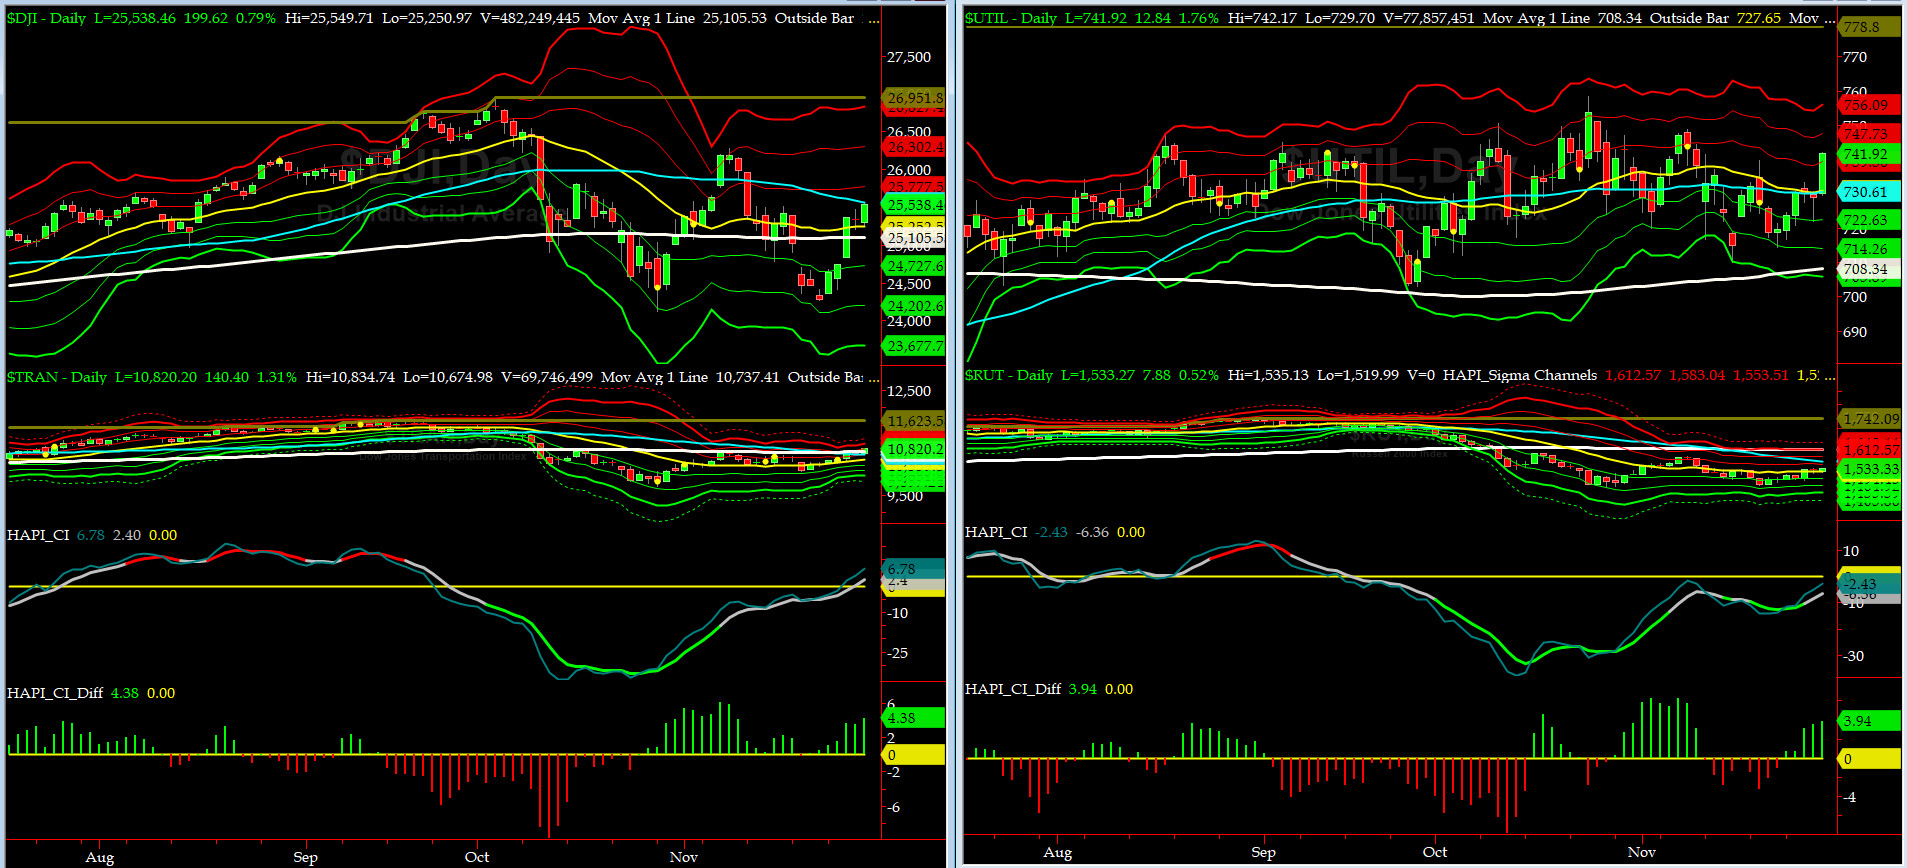
Canaries [in the Coal Mine] Chart for DJ TRAN & RUT Indices
200-Day MA DJ TRAN = 10,737 or 0.8% BELOW DJ TRAN (max observed in last 7 yrs = 20.2%, min = -20.3%)
200-Day MA RUT = 1614 or 5.1% ABOVE RUT (max observed in last 7 yrs = 21.3%, min = -22.6%)
DJ Transportation Index (proxy for economic conditions 6 to 9 months hence) went thru its "death cross" (50-day MA crosses below its 200-day MA) while rising strongly this past week.
Russell 2000 Small Caps Index (proxy for Risk ON/OFF), rose moderately last week. RISK is still struggling to make a comeback.
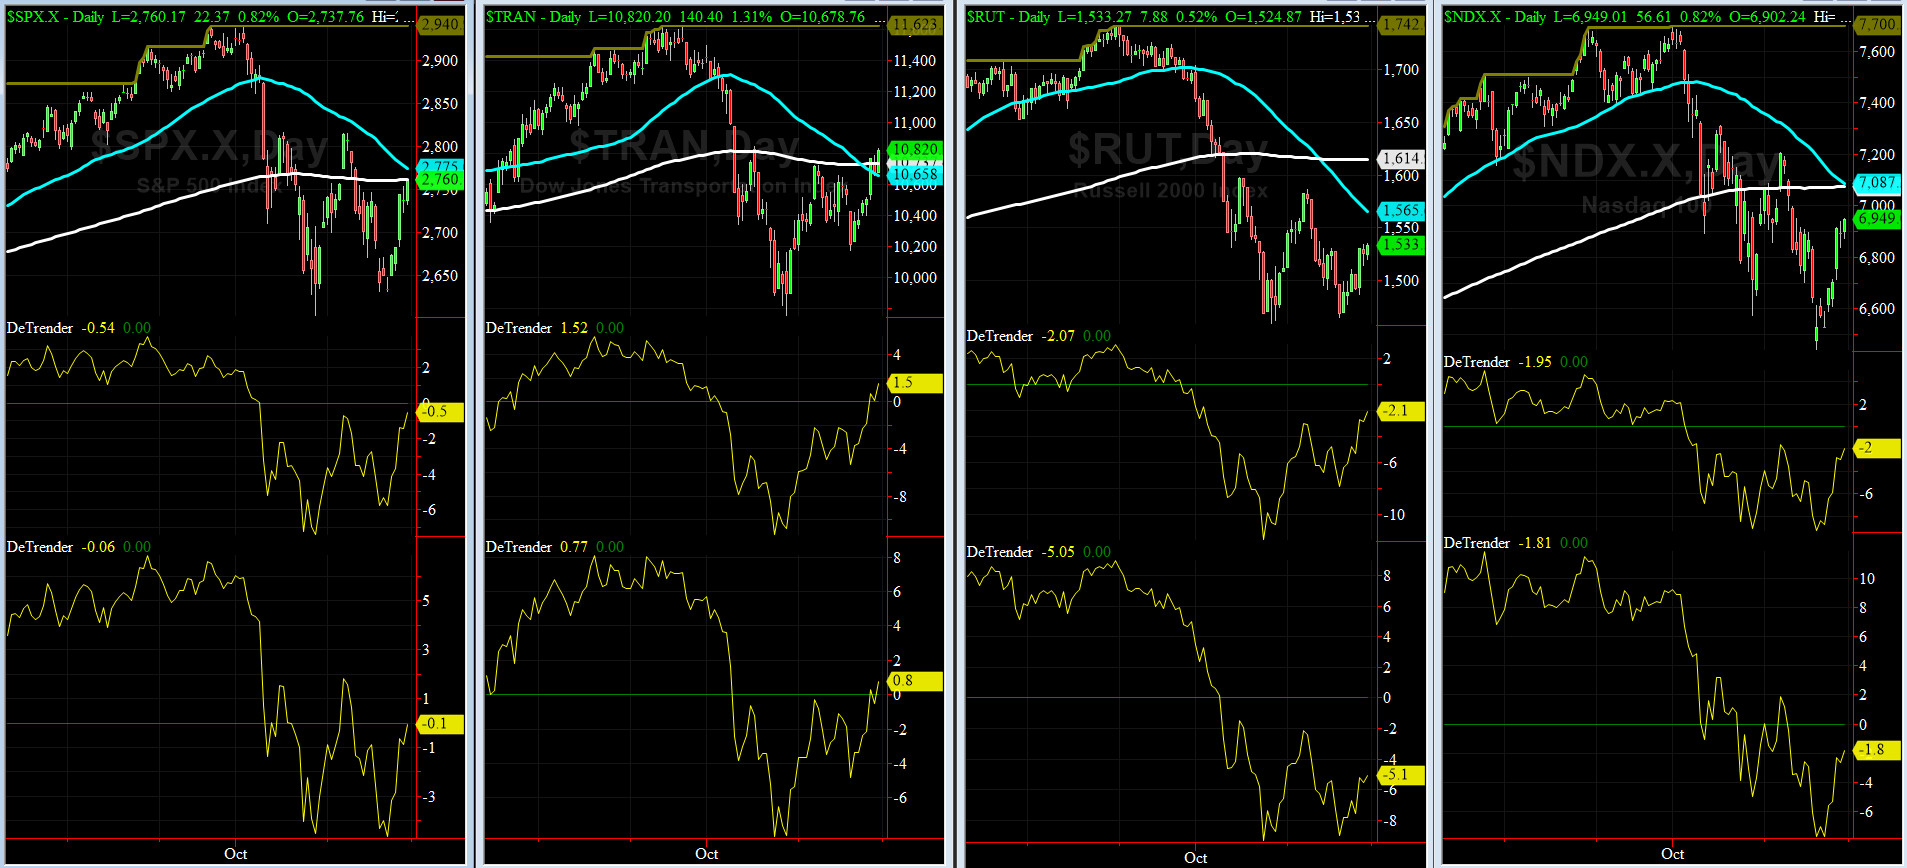
DeTrenders Charts for SPX, NDX, TRAN & RUT Indices
50-Day MA SPX = 2775 or 0.5% ABOVE SPX (max observed in last 7 yrs = +8.6%, min = -9.3%)
200-Day MA SPX = 2761 or 0.1% BELOW SPX (max observed in last 7 yrs = 15.2%, min = -14%)
Almost THREE of our EIGHT DeTrenders are back in the POSITIVE territory. That is a big, noticeable change. The DeTrenders for DJ Tran & RUT will continue to be harbingers of future price behavior in broad indices.

HA_SP1_Momo Chart
WEEKLY Timing Model = on a SELL Signal since Friday, November 16, 2018 CLOSE at 2736
DAILY Timing Model = on a BUY Signal since Friday, November 30, 2018 CLOSE at 2760
Max SPX 52wk-highs reading last week = 27 (over 120-140, the local maxima is in)
Max SPX 52wk-Lows reading last week = 7 (over 40-60, the local minima is in)
HA_SP1 closed at its +2 sigma channels
HA_Momo = +4.8 (reversals most likely occur above +10 or below -10)
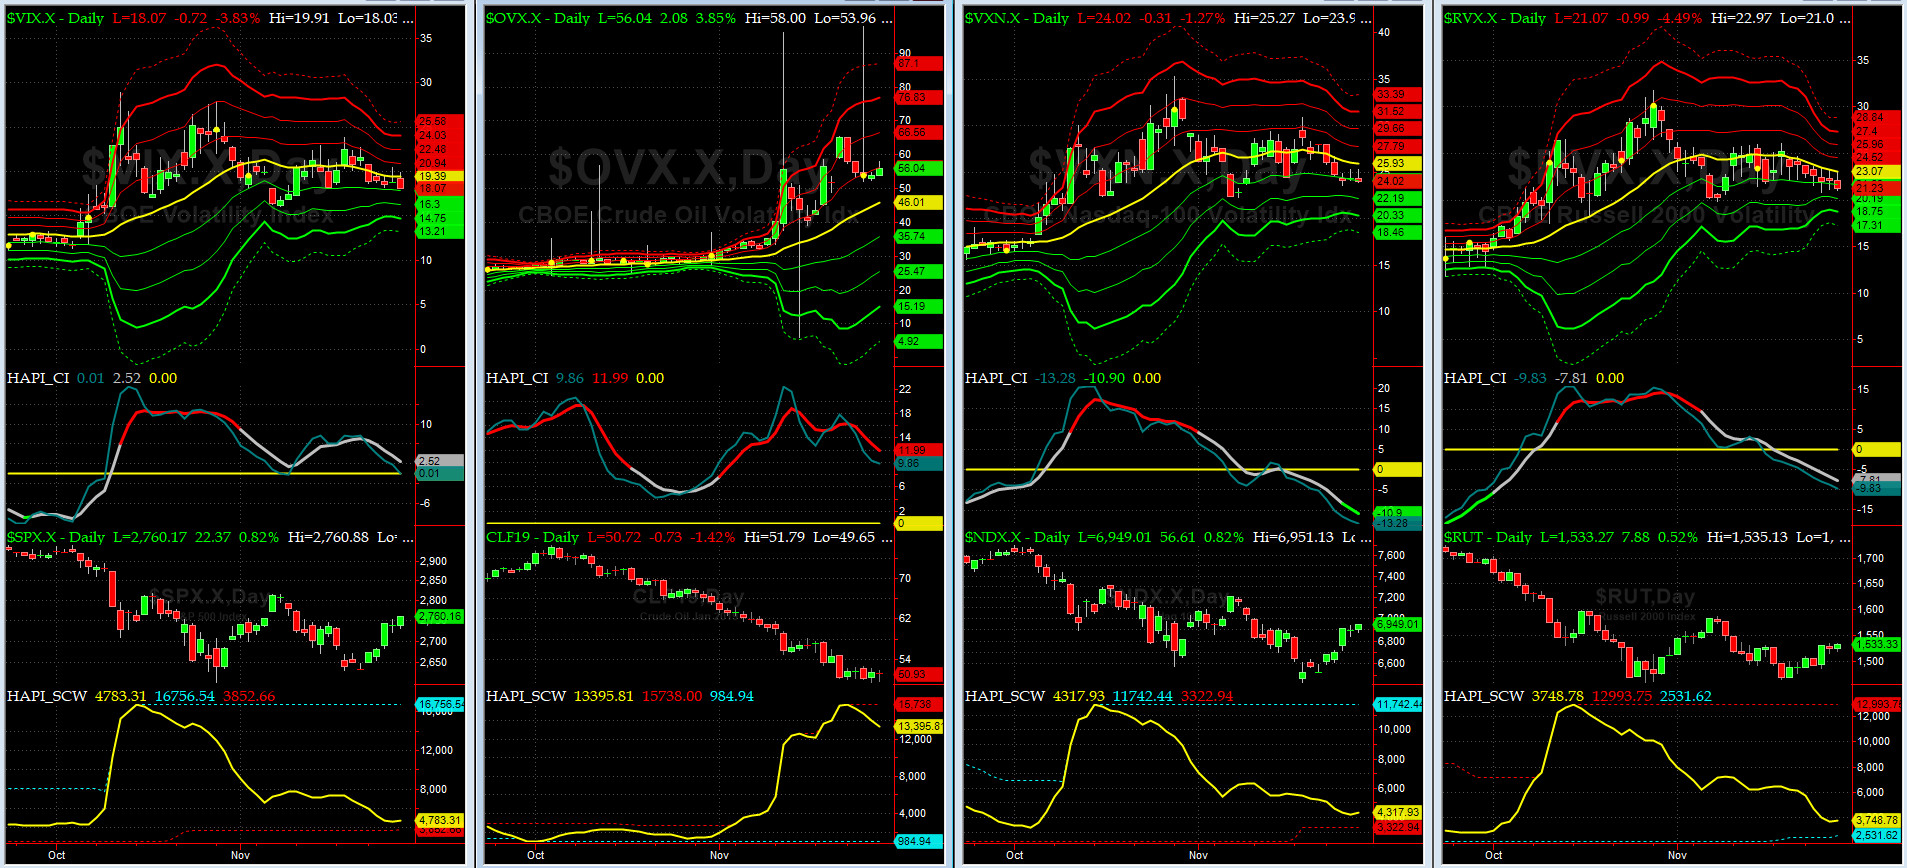
Vol of the Vols Chart
Spot VIX currently stands at 18.7, right above its zero sigma (remember it's the VIX volatility pattern aka "its sigma channels" that matters, and not the level of VIX itself (this is per Dr. Robert Whaley, a great mentor and inventor of original VIX, now called VXO). VIX usually peaks around a test of its +4 sigma).
VIX & VXN both have become very quiet for second week in a row.
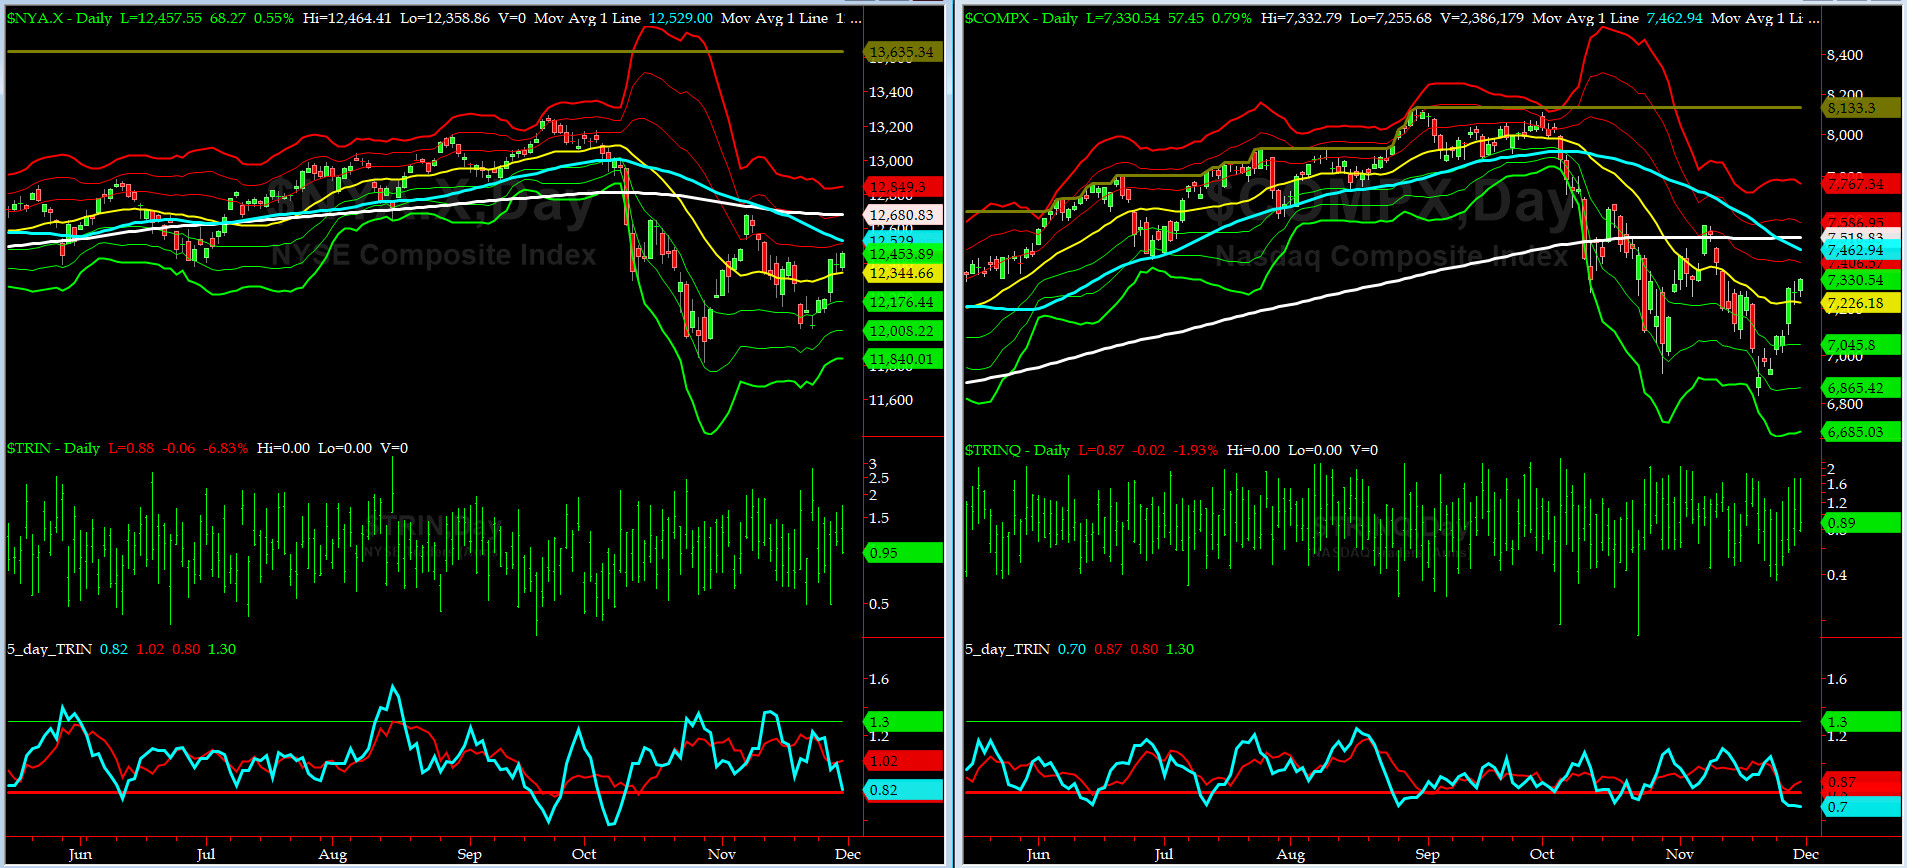
5-day TRIN & TRINQ Charts
Both NYSE 5-day TRIN & NASDAQ 5-day TRINQ are in the SELL zone.
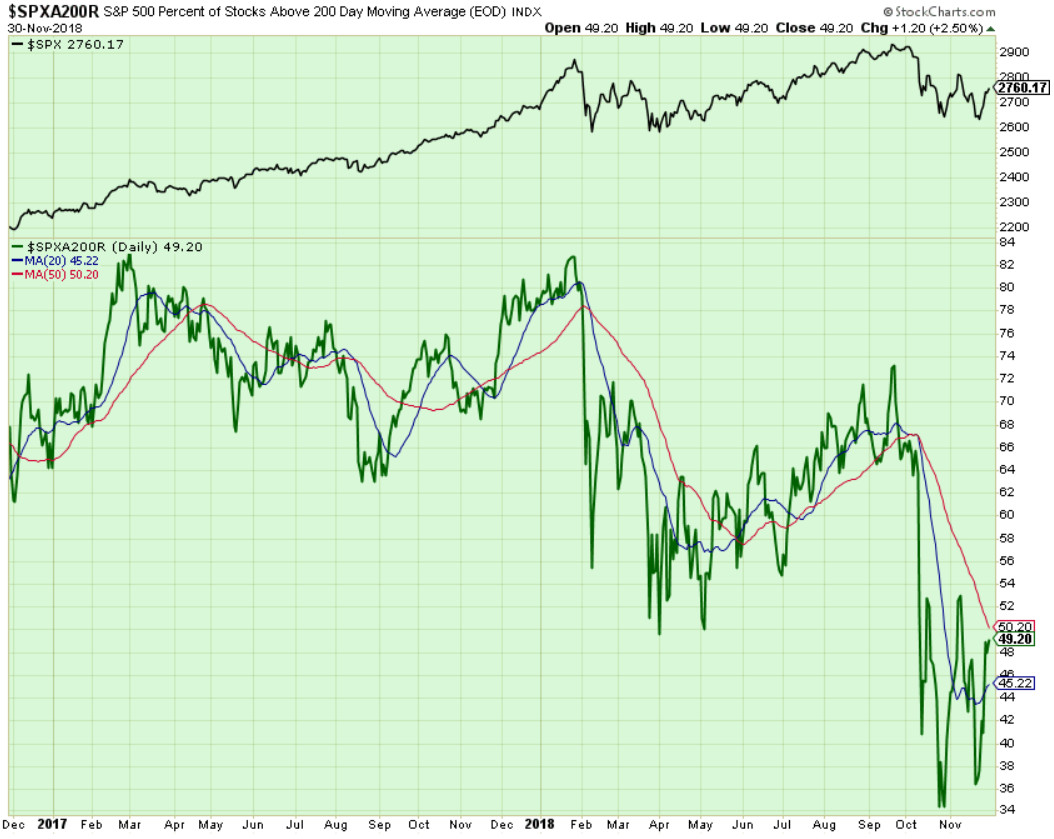
Components of SPX above their respective 200day MA Chart
This scoring indicator rallied to 49% area. This is a NEUTRAL reading here.
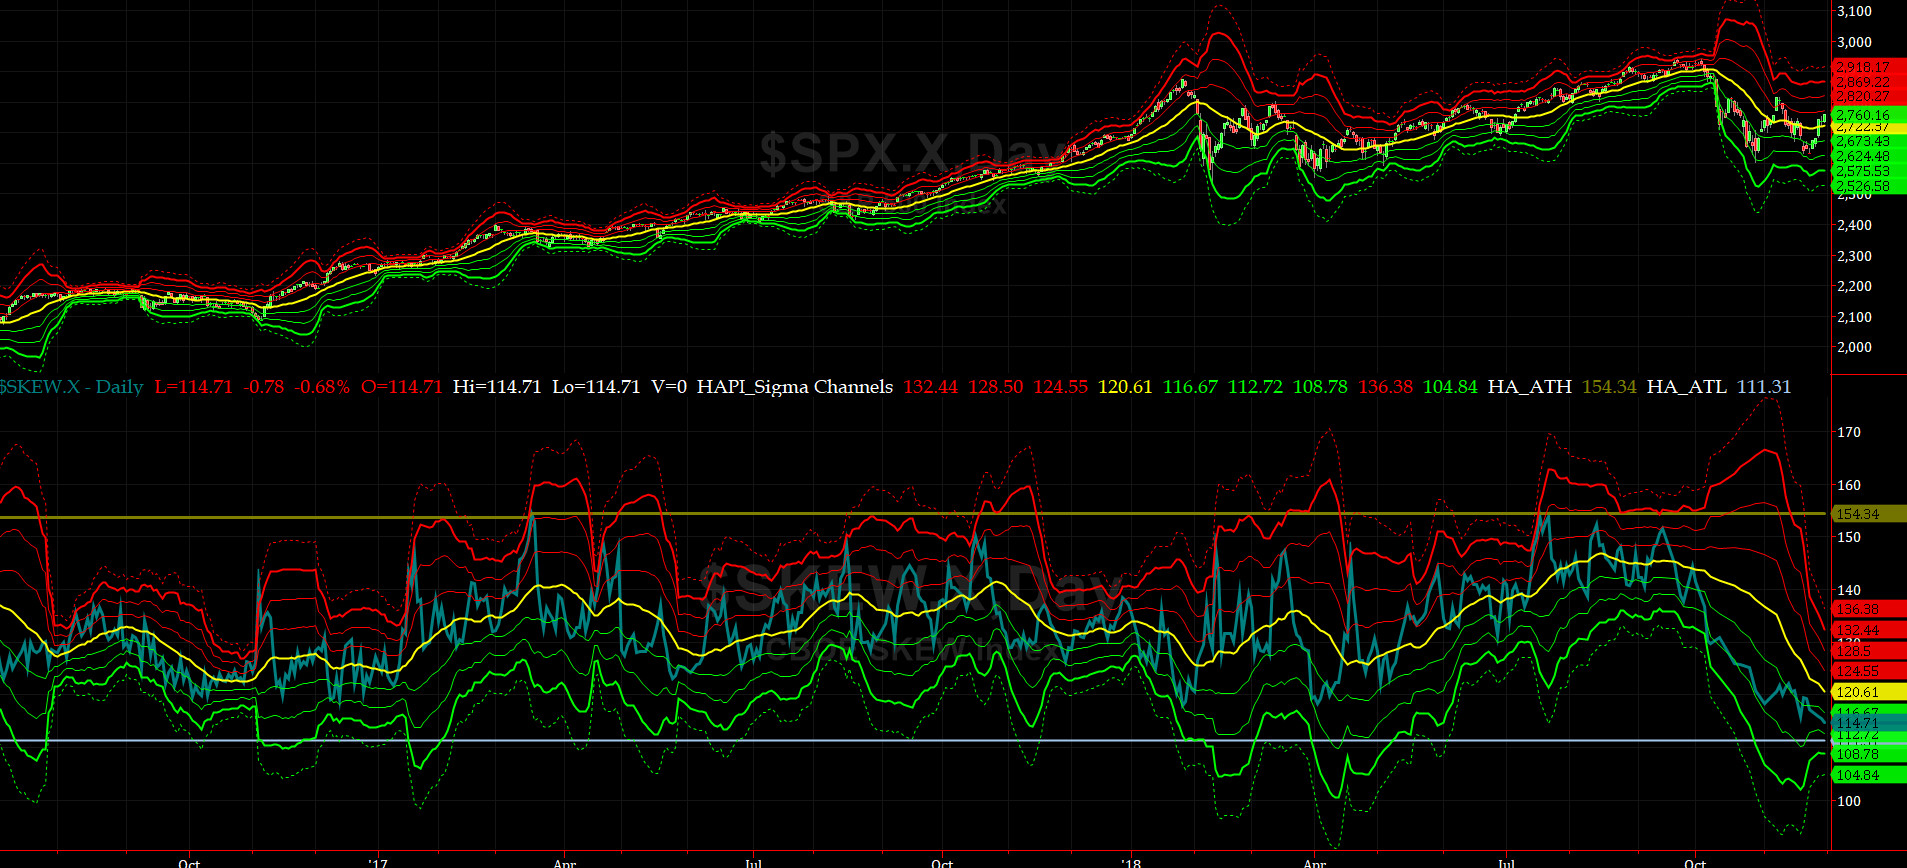
SPX SKEW (Tail Risk) Chart
On Friday, SPX SKEW (Tail Risk) closed near 114.7, still about its -1 sigma (normal = 120-125, range 100-150).
Is all quiet on the Eastern & Mid-Western Fronts? Our beloved @Capt_Tiko now says YES....
How to interpret the value of SPX SKEW? (from CBOE white paper on SKEW)

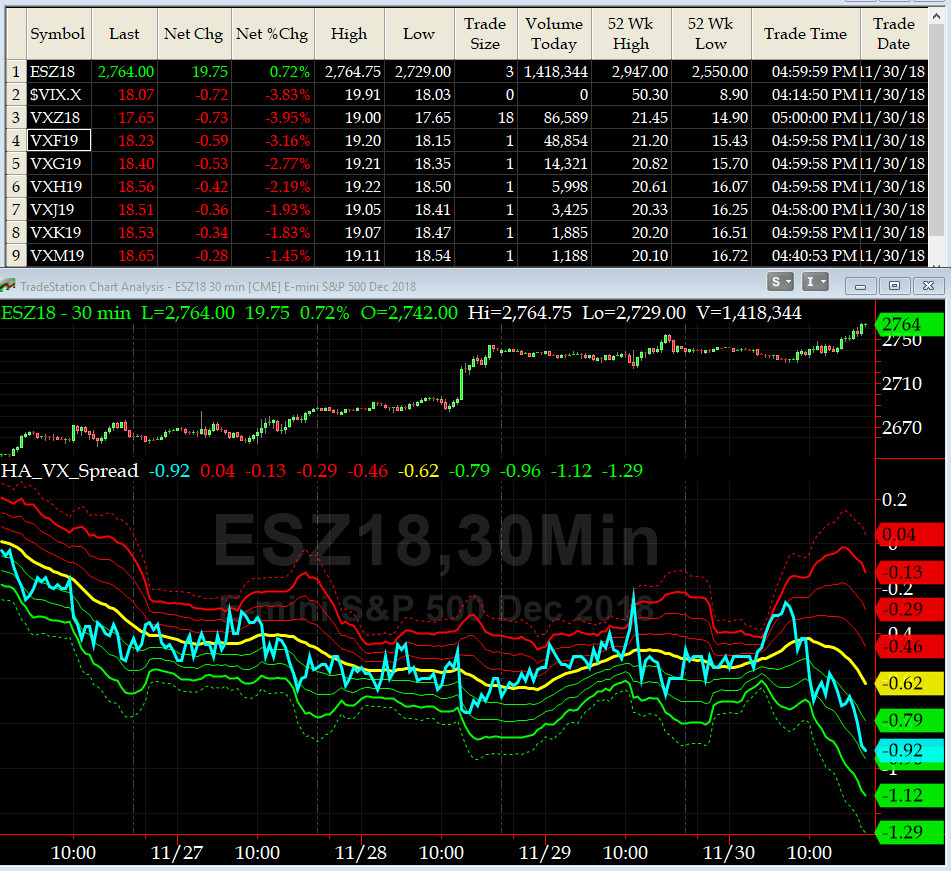
3-month VIX Futures Spread(VX) Chart
This popular timing indicator, (long DEEZ18, & short MAR19 VIX Futures) closed at -0.9 which is slightly OVERBOUGHT.
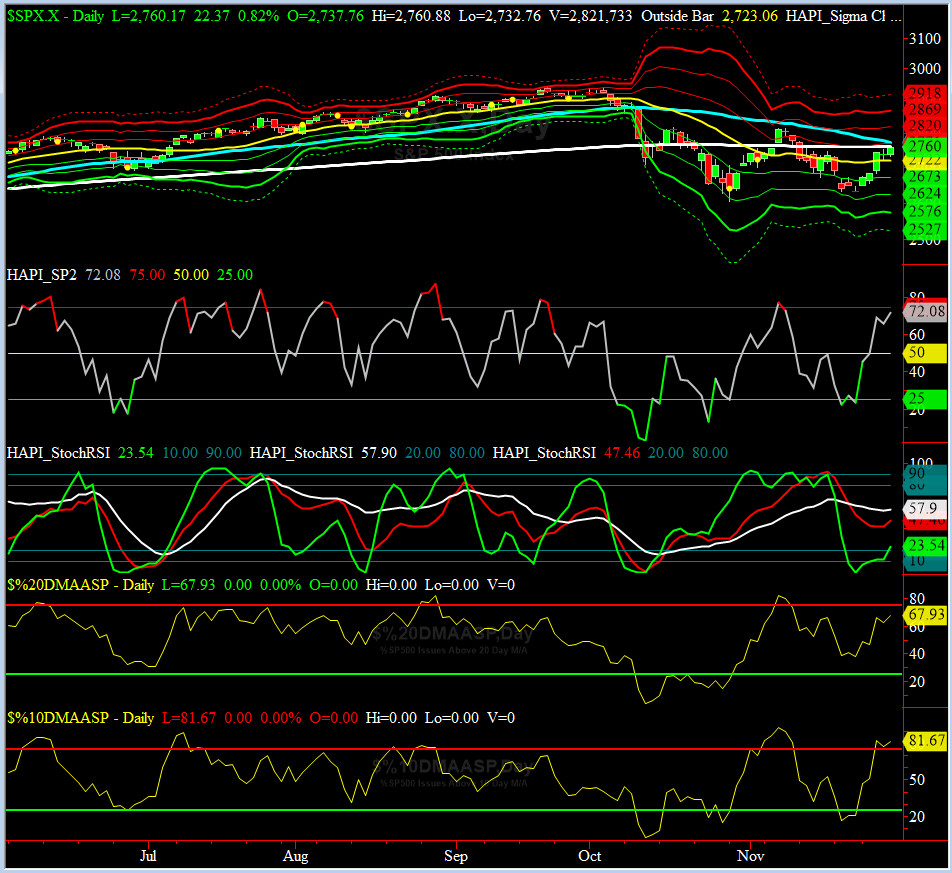
HA_SP2 Chart
HA_SP2 = 72 (Buy signal <= 25, Sell Signal >= 75)
Our coveted SP2 prop indicator zoomed up from 23 into 70+ area in 3 days, pulled back on Thursday and then settled at 72 by Friday Close. We are now slowly entering the OVERBOUGHT zone.
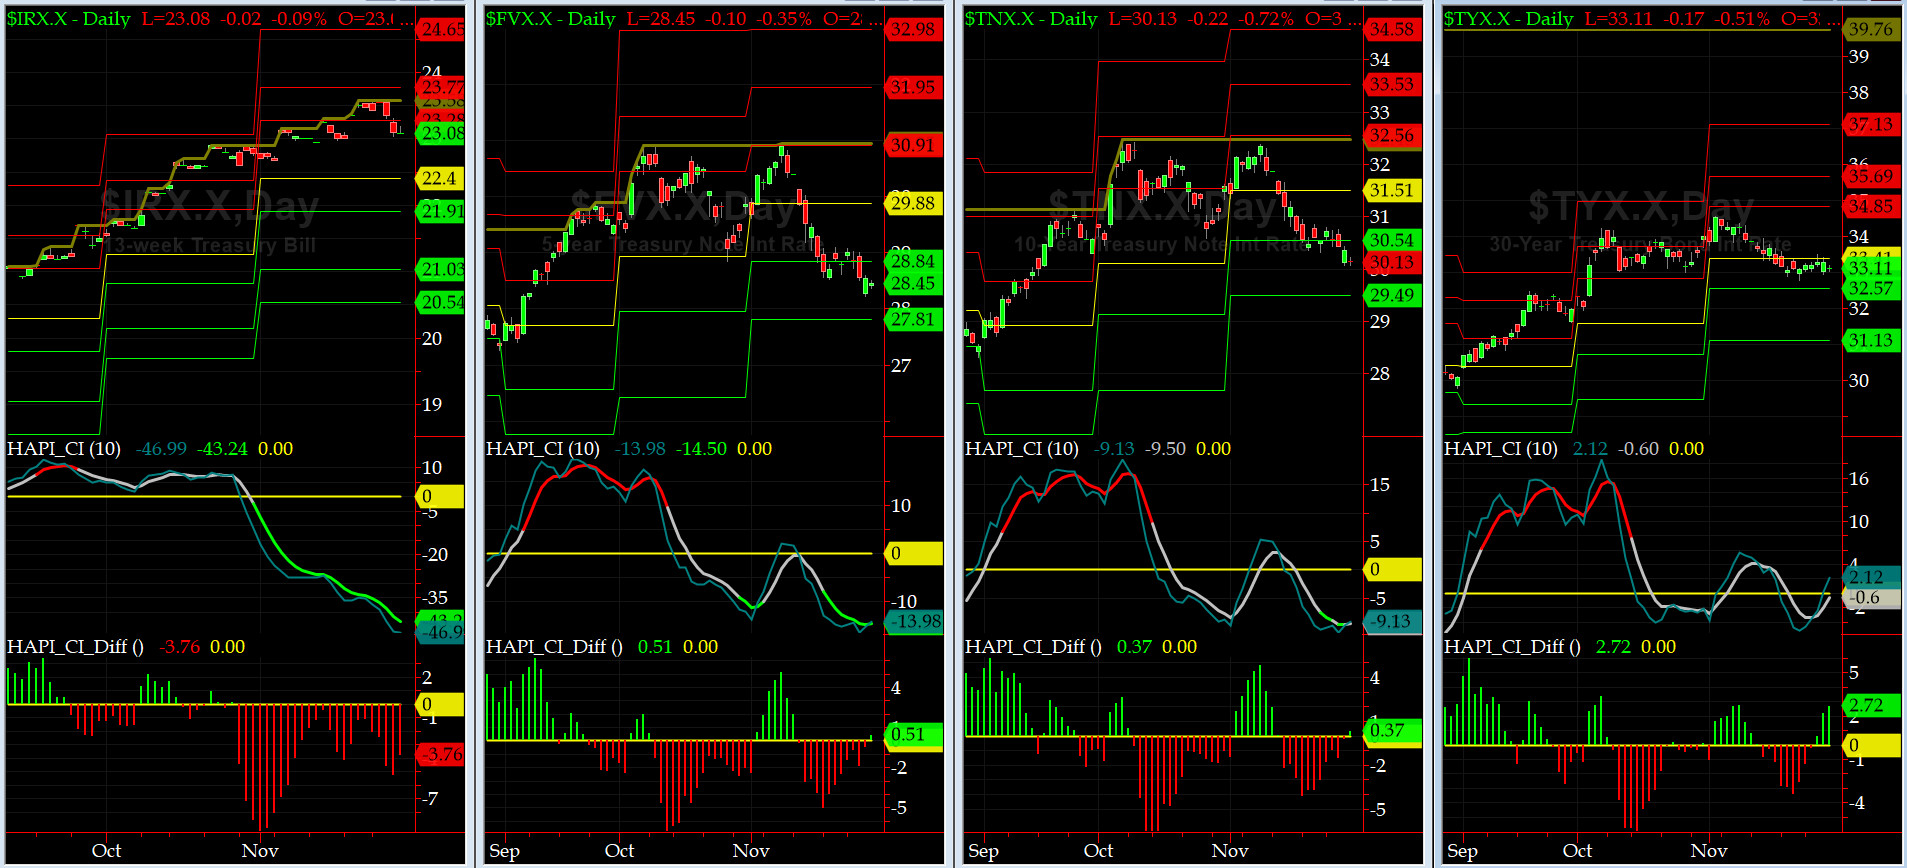
US Treasury T-Notes & T-Bonds Yields Chart
Again, this past week, flight-to-safety trades continued across the Yield Curve and all YTMs sank again (including FF). Mr & Mrs Maury are not talking to each other. The feud this time, is over her Hanukkah Gifts Budget....BH is not cheap.
Fari Hamzei
|
|
|
|
|
|
Customer Care:
|
|
|
|
|
|
|
 |
 |
|
 |
|
 |
 |
 |
HA YouTube Channel ::: HA Blog ::: Testimonials ::: Tutorials & FAQs ::: Privacy Policy
|
Trading Derivatives (Options & Futures) contains substantial risk and is not for every investor. An investor could potentially lose all or more than his/her initial investment.
Only risk capital should be used for trading and only those with sufficient risk capital should consider trading derivatives. Past performance is not
necessarily indicative of future results. Testimonials appearing on this website may not be representative of other clients or customers
and are not a guarantee of future performance or success.
|
| (c) 1998-2025, Hamzei Analytics, LLC.® All Rights Reserved. |
|
|