
|
 |
 |
 |
 |
 |
 |
 |
 |
 Proactive Market Timing Proactive Market Timing
|
|
|
Most Recent PMT vs SPX Performance Chart

|
|
|
|
Wednesday, December 19, 2018, 0940ET
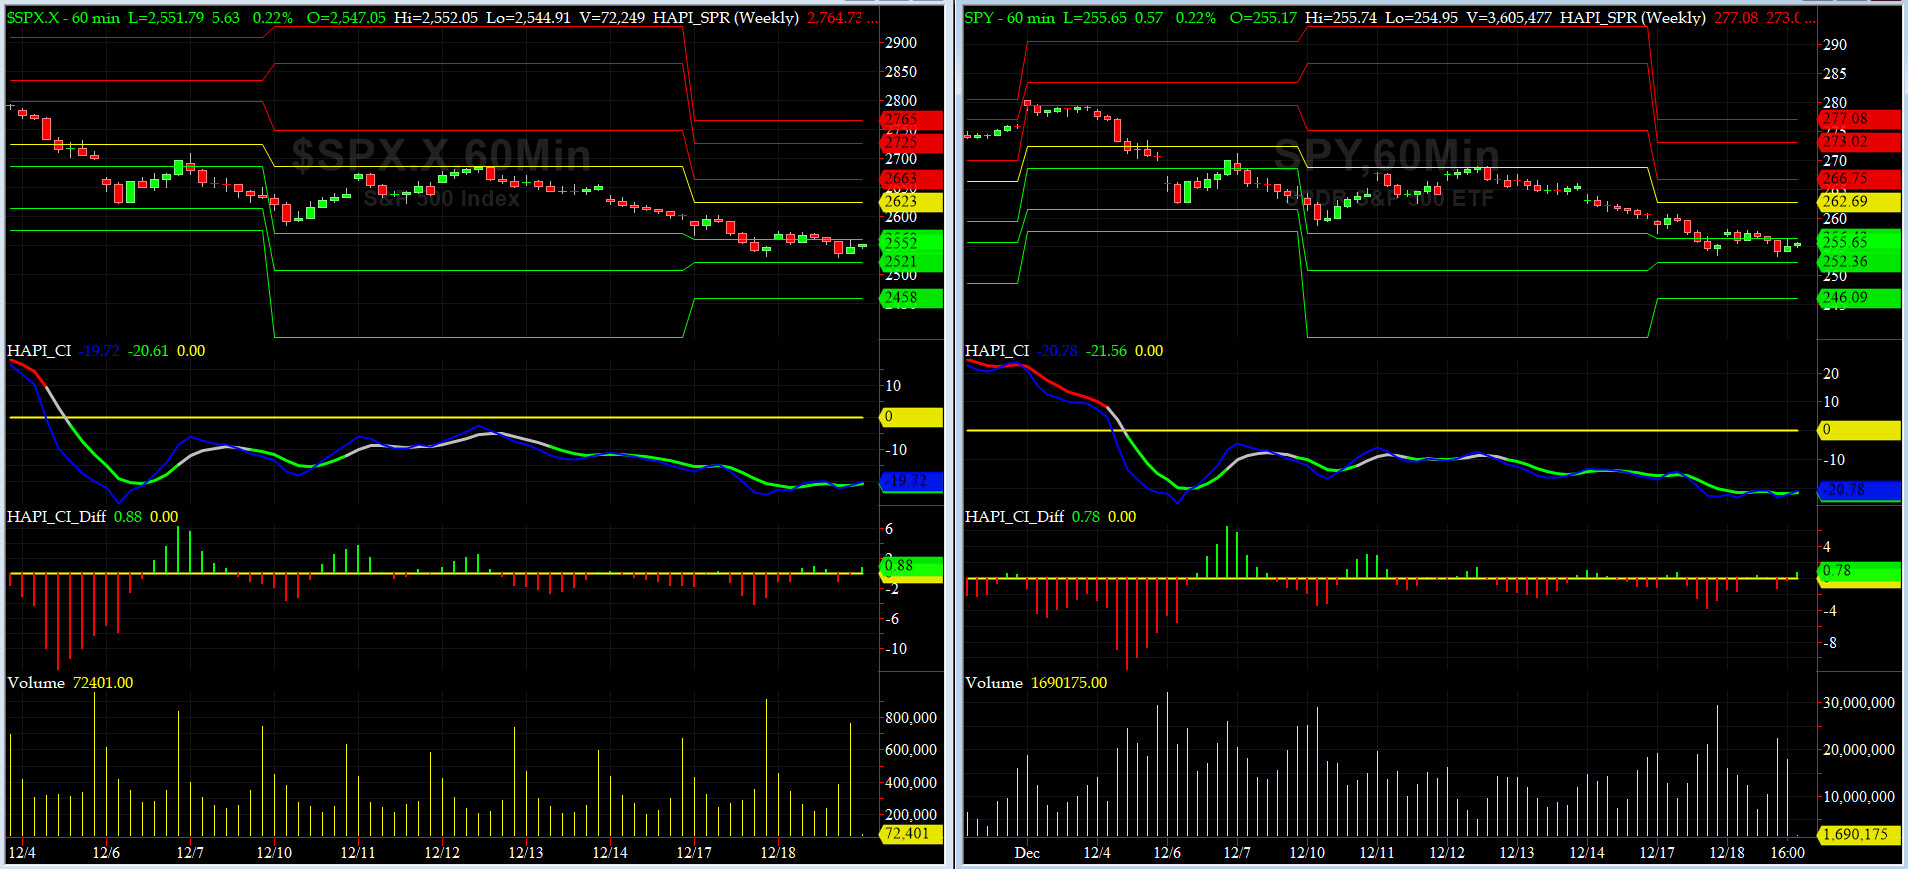
UPDATED Companion Chart for Market Bias Review, Issue #271
|
|
|
|
|
|
Wednesday, December 19, 2018, 0938ET
UPDATED Market Bias for Issue #271
Our current Market Bias with Timer Digest is LONG SPX as of DEC 18 at 2546
Our previous Market Bias was SHORT SPX as of DEC 13 at 2650
Here are the trade parameters for this week:
SPX Secondary Profit Target for last 20% of our position = 2620
SPX Primary Profit Target for first 80% of our position = 2600
SPX BreakEven Stop (Current Price) for last 20% of our position = 2552
SPX Money Management Stop for 100% of our position = 2525
|
| Action |
Asset |
Expiration |
Strike |
Option |
| BUY |
SPY |
Friday DEC 28 |
256 |
Calls |
| SELL SHORT |
SPY |
Friday DEC 28 |
262 |
Calls |
| You need to execute both legs and hold it as a Call-Spread.
|
Note A:
Once the Primary Profit Target has been reached, traders are advised to close 80% of their position in order to lock in profits. The remaining balance can be carried over with a BreakEven STOP, based on the SPX level at the time of entry, in order to make the trade a zero-risk trade with the final position running to reach the Secondary Profit Target.
Once either Secondary Profit or Money Management (BreakEven STOP after the 80% peel-off) is hit, our Option/ETF trade for that week is over. Go to Cash and wait for the next PMT Issue.
Note B:
When we change our Market Bias with Timer Digest, You need to go FLAT asap. With PMT Pro, that is before the Close that day and with the basic PMT, at the open of the next day. The following trading day, we will issue new SPX targets and a new SPY options trade, as long our new market bias with Timer Digest is NOT flat.
Fari Hamzei
|
|
|
|
|
|
Tuesday, December 18, 2018, 2319ET
Notice of Change of Bias with Timer Digest
Dear Jim,
Interesting market action today with another huge gap-up, and, then yet another sell-off hard in the late afternoon, ahead of DEEZ FOMC tomorrow. We are very oversold here, and ioho, we think Chairman Powell will be very nuanced tomorrow both in his statement and presser.
Ceteris paribus, with FDX guiding lower after the Close today, we put the chance of a Fed rate hike tomorrow as less than 50-50.
Getting LONG SPX for one more dead cat bounce before the year end. Cheers���.
Fari Hamzei
|
|
|
|
|
|
Monday, December 17, 2018, 0950ET
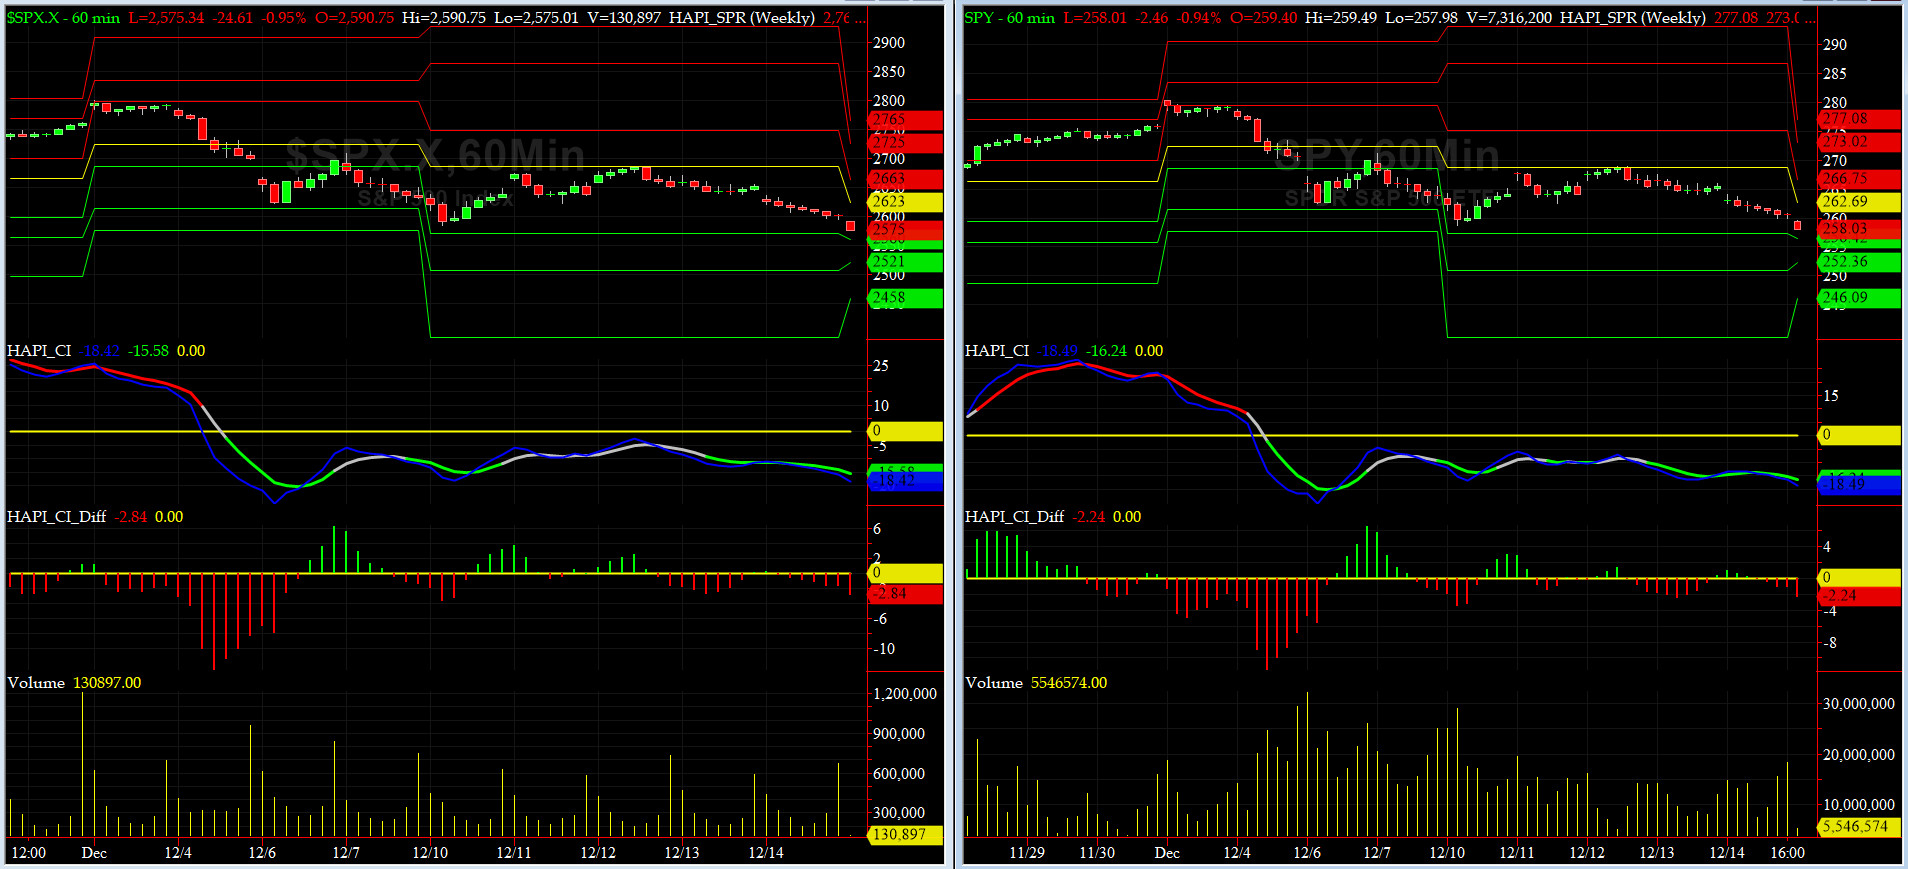
Companion Chart for Market Bias Review, Issue #271
|
|
|
|
|
|
Monday, December 17, 2018, 0945ET
Market Bias for Issue #271
Our current Market Bias with Timer Digest is SHORT SPX as of DEC 13 at 2650
Our previous Market Bias was LONG SPX as of DEC 10 at 2637
Here are the trade parameters for this week:
SPX Money Management Stop for 100% of our position = 2620
SPX BreakEven Stop (Current Price) for last 20% of our position = 2582
SPX Primary Profit Target for first 80% of our position = 2540
SPX Secondary Profit Target for last 20% of our position = 2520
|
| Action |
Asset |
Expiration |
Strike |
Option |
| BUY |
SPY |
Friday DEC 28 |
257 |
Puts |
| SELL SHORT |
SPY |
Friday DEC 28 |
252 |
Puts |
| You need to execute both legs and hold it as a Put-Spread.
|
Note A:
Once the Primary Profit Target has been reached, traders are advised to close 80% of their position in order to lock in profits. The remaining balance can be carried over with a BreakEven STOP, based on the SPX level at the time of entry, in order to make the trade a zero-risk trade with the final position running to reach the Secondary Profit Target.
Once either Secondary Profit or Money Management (BreakEven STOP after the 80% peel-off) is hit, our Option/ETF trade for that week is over. Go to Cash and wait for the next PMT Issue.
Note B:
When we change our Market Bias with Timer Digest, You need to go FLAT asap. With PMT Pro, that is before the Close that day and with the basic PMT, at the open of the next day. The following trading day, we will issue new SPX targets and a new SPY options trade, as long our new market bias with Timer Digest is NOT flat.
Fari Hamzei
|
|
|
|
|
|
Sunday, December 16, 2018, 2345ET
Market Timing Charts, Analysis & Commentary for Issue #271

Timer Charts of S&P-500 Cash Index (SPX) + NASDAQ-100 Cash Index (NDX)
Most recent S&P-500 Cash Index (SPX): 2600 down -33 (down -1.3%) for the week ending on Friday, December 14, 2018, which closed just a tad above its -2 sigma.
DJIA ALL TIME INTRADAY HIGH = 26951 (reached on Wednesday, October 3, 2018)
DJ TRAN ALL TIME INTRADAY HIGH = 11623 (reached on Friday, September 14, 2018)
SPX ALL TIME INTRADAY HIGH = 2941 (reached on Friday, September 21, 2018)
NDX ALL TIME INTRADAY HIGH = 7700 (reached on Thursday, October 1, 2018)
RUT ALL TIME INTRADAY HIGH = 1742 (reached on Friday, August 31, 2018)
Current DAILY +2 Sigma SPX = 2785 with WEEKLY +2 Sigma = 2995
Current DAILY 0 Sigma SPX = 2684 with WEEKLY 0 Sigma = 2793
Current DAILY -2 Sigma SPX = 2583 with WEEKLY -2 Sigma = 2592
NYSE McClellan Oscillator = -126 (-150 is start of the O/S area; around -275 to -300 area or lower, we go into the �launch-pad� mode; over +150, we are in O/B area)
NYSE Breadth Thrust = 39.3 (40 is considered as oversold and 65 as overbought)
Very tough week for the WH and markets sensed and sold it.
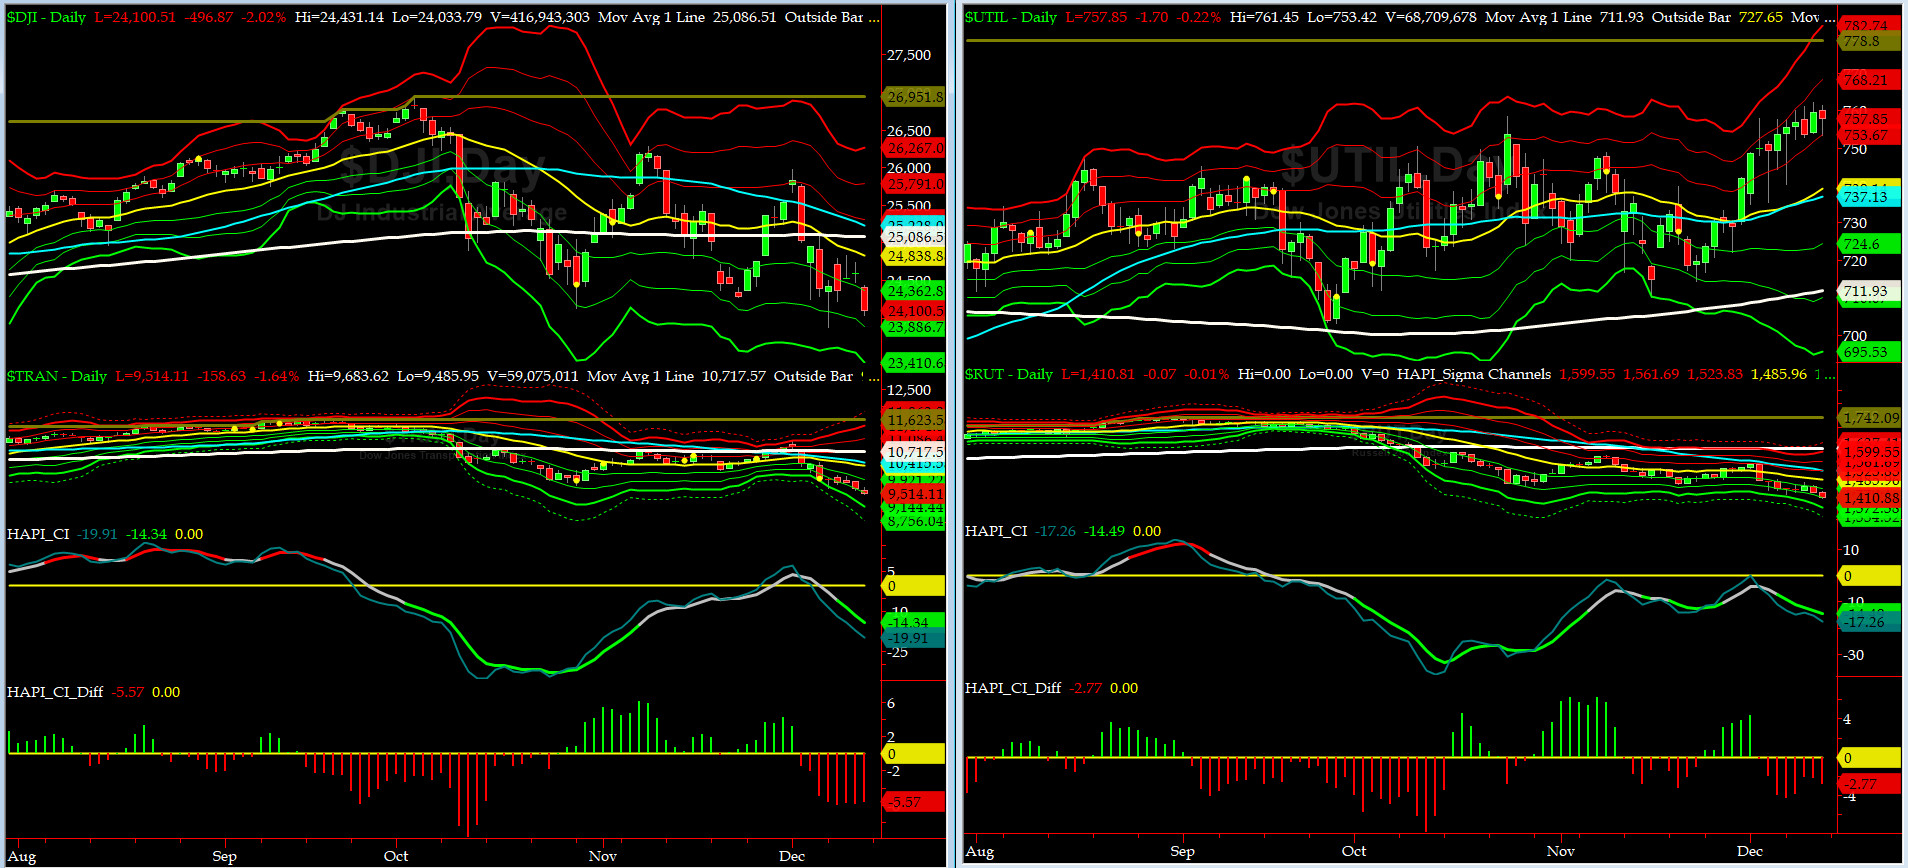
Canaries [in the Coal Mine] Chart for DJ TRAN & RUT Indices
200-Day MA DJ TRAN = 10,717 or 11.2% ABOVE DJ TRAN (max observed in last 7 yrs = 20.2%, min = -20.3%)
200-Day MA RUT = 1611 or 12.5% ABOVE RUT (max observed in last 7 yrs = 21.3%, min = -22.6%)
DJ Transportation Index (proxy for economic conditions 6 to 9 months hence) another painful week for TRAN. This chart speaks volumes of trouble ahead, imho.
Russell 2000 Small Caps Index (proxy for Risk ON/OFF) puked more. RISK is OFF.
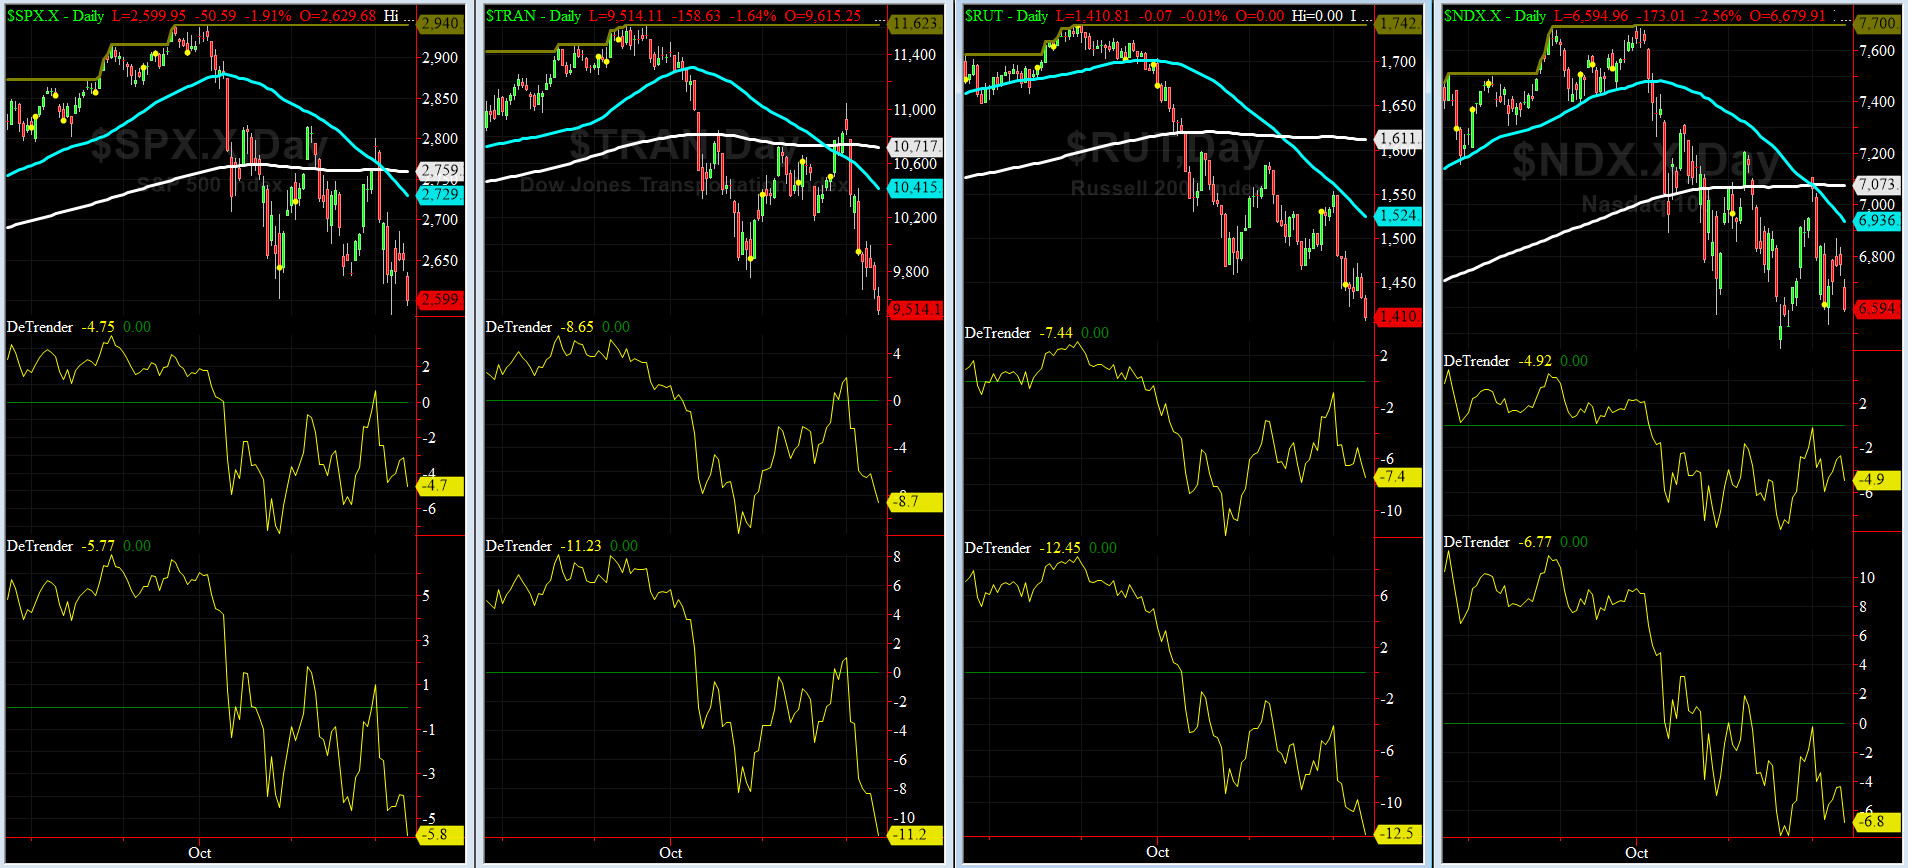
DeTrenders Charts for SPX, NDX, TRAN & RUT Indices
50-Day MA SPX = 2729 or 4.7% BELOW SPX (max observed in last 7 yrs = +8.6%, min = -9.3%)
200-Day MA SPX = 2759 or 5.8% BELOW SPX (max observed in last 7 yrs = 15.2%, min = -14%)
All EIGHT out of EIGHT of our DeTrenders are in the NEGATIVE territory. The DeTrenders for DJ Tran & RUT will continue to be harbingers of future price behavior in broad indices.
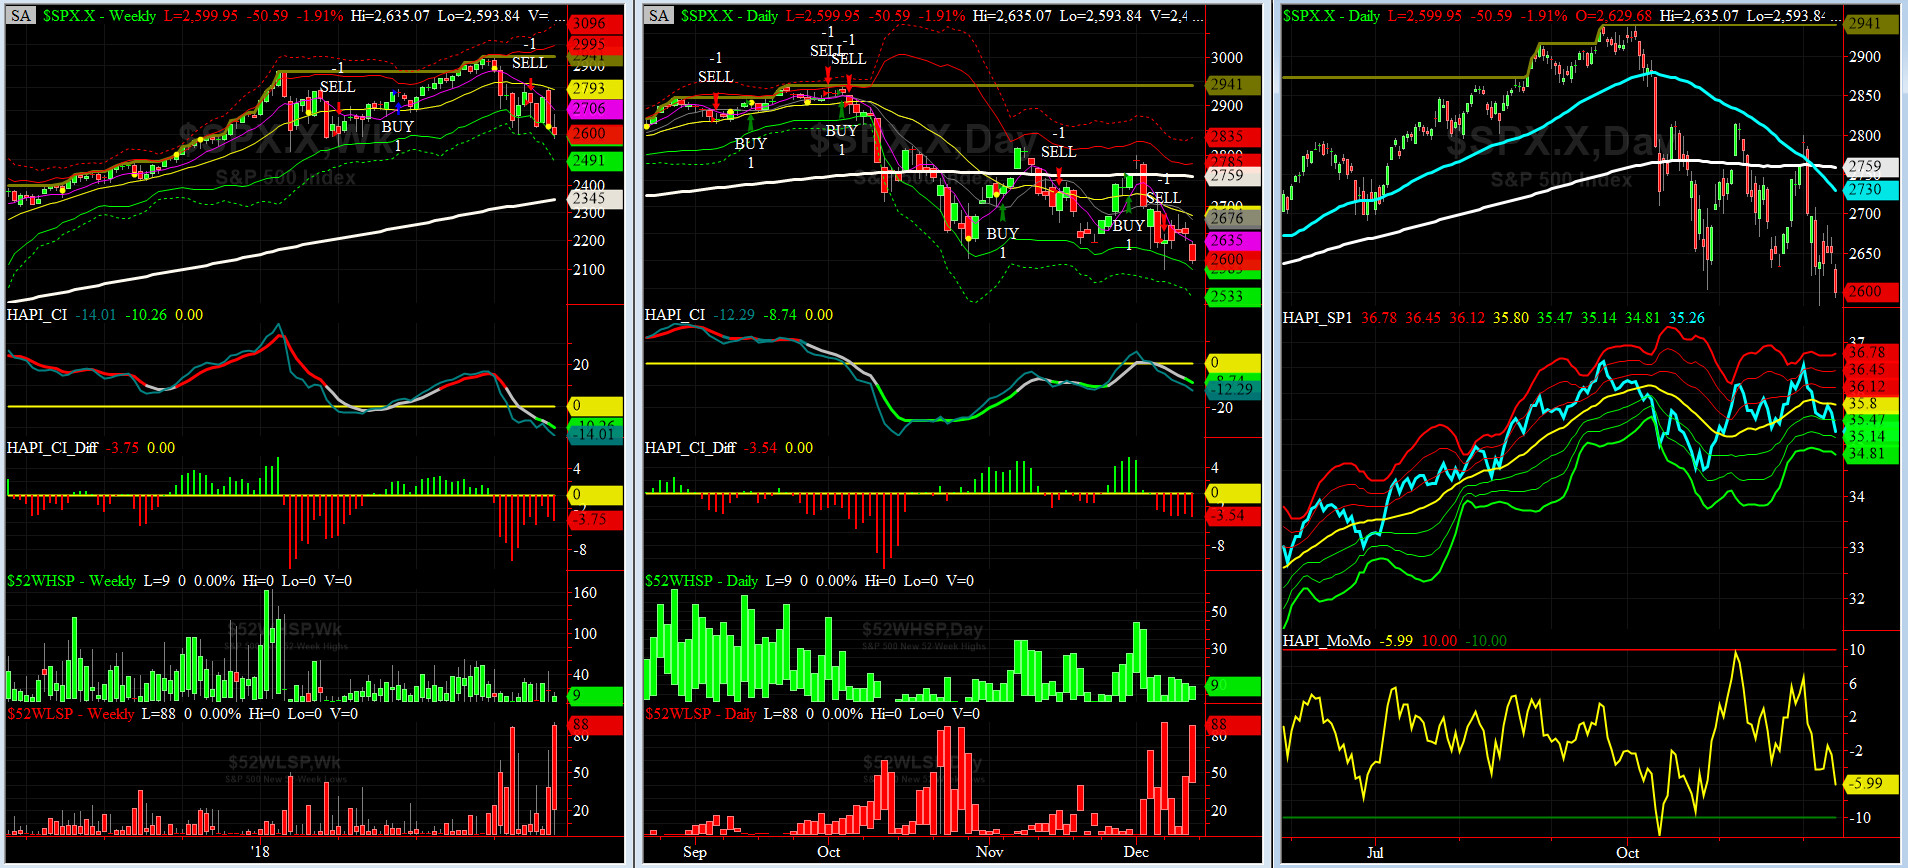
HA_SP1_Momo Chart
WEEKLY Timing Model = on a SELL Signal since Friday, November 16, 2018 CLOSE at 2736
DAILY Timing Model = on a SELL Signal since Monday, December 10, 2018 CLOSE at 2637
Max SPX 52wk-highs reading last week = 14 (over 120-140, the local maxima is in)
Max SPX 52wk-Lows reading last week = 90 (over 40-60, the local minima is in)
HA_SP1 closed near its -2 sigma channels
HA_Momo = -6 (reversals most likely occur above +10 or below -10)
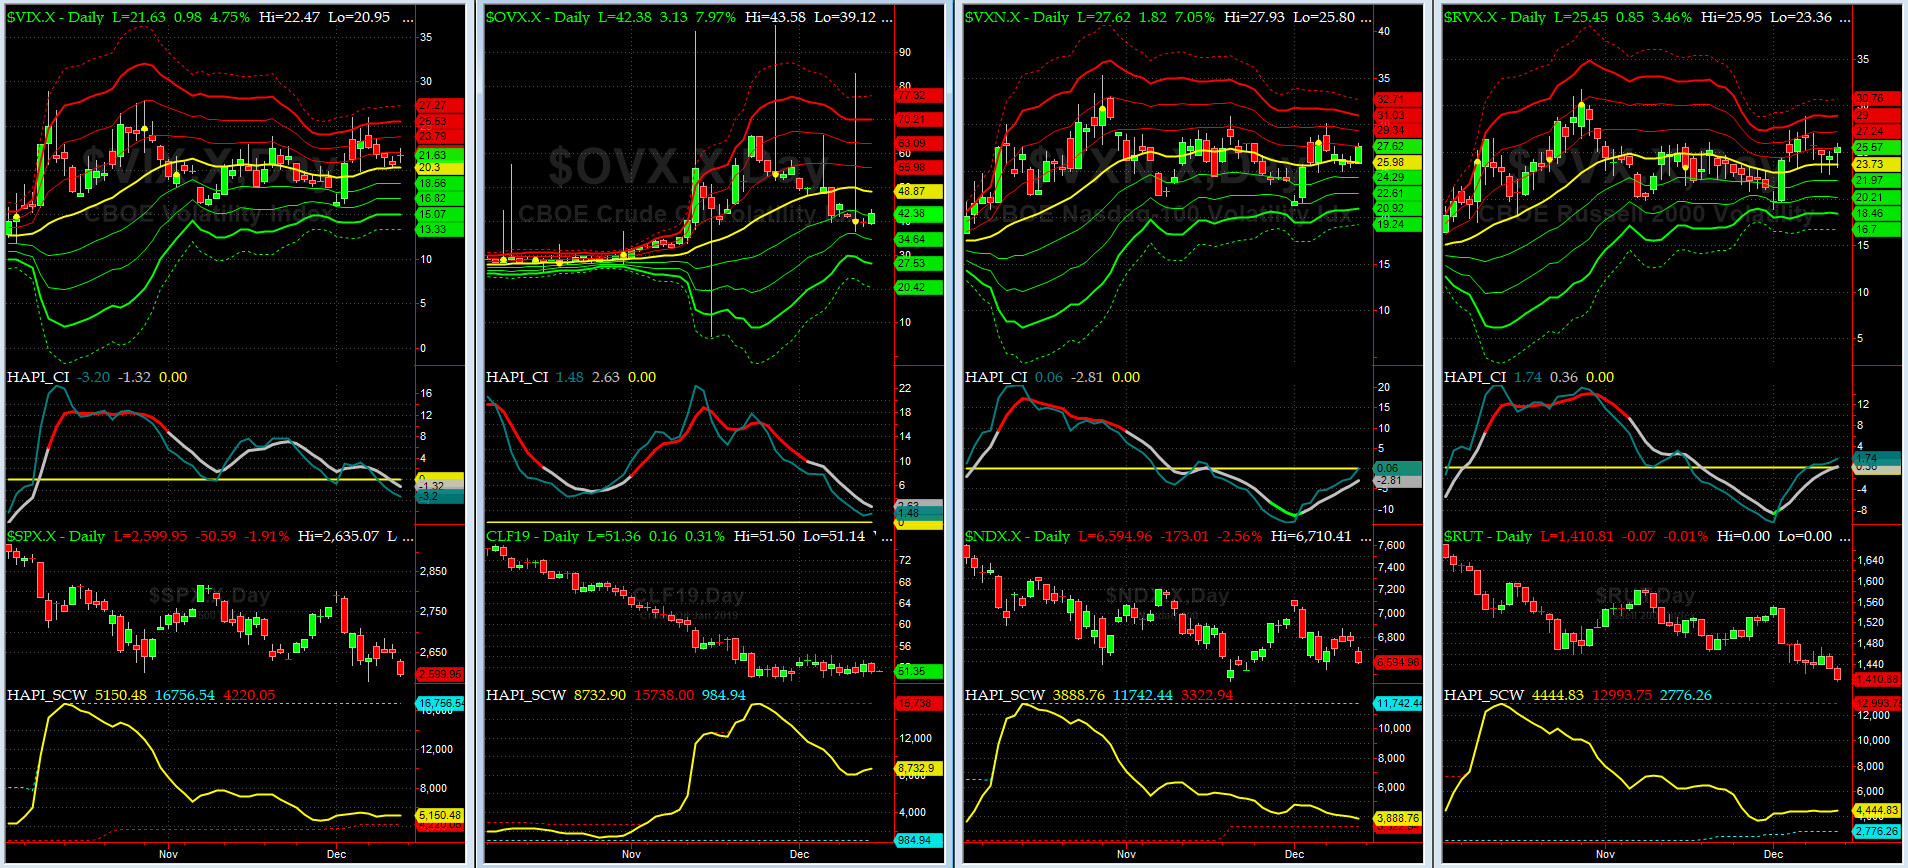
Vol of the Vols Chart
Spot VIX currently stands at 21.6, at about its +2 sigma (remember it's the VIX volatility pattern aka "its sigma channels" that matters, and not the level of VIX itself (this is per Dr. Robert Whaley, a great mentor and inventor of original VIX, now called VXO). VIX usually peaks around a test of its +4 sigma).
VIX & VXN are showing side-way motion with a slight uptick. Are big boys are getting complacent?
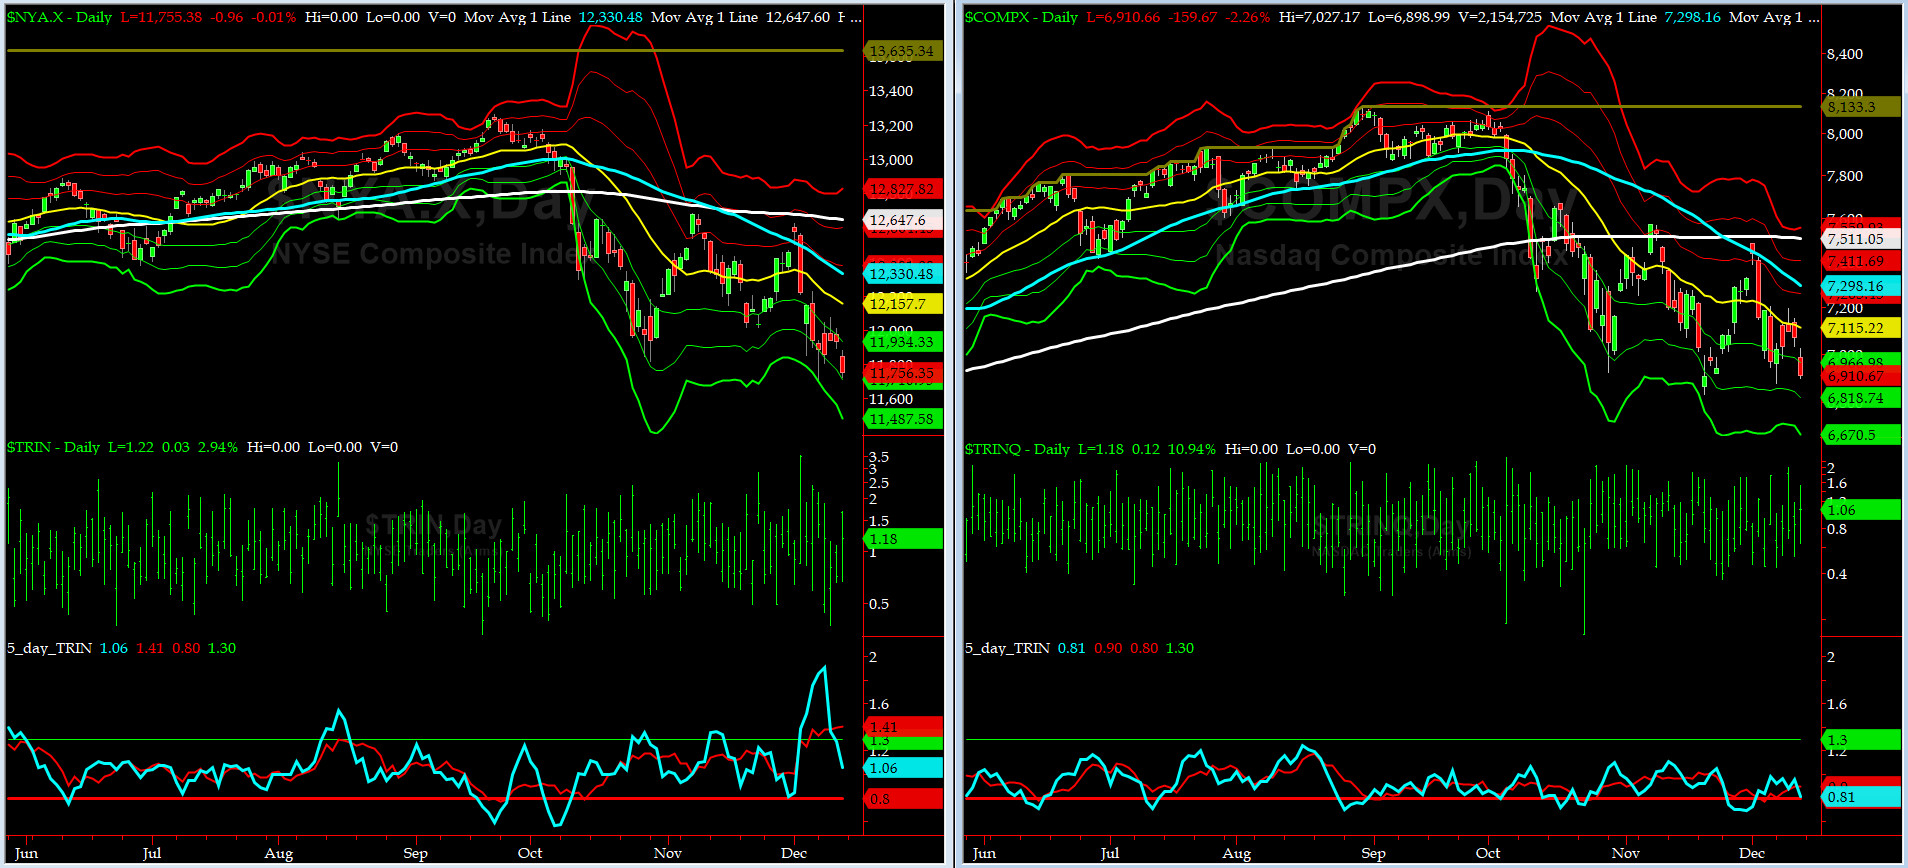
5-day TRIN & TRINQ Charts
NYSE 5-day TRIN is in the NEUTRAL zone while the NASDAQ 5-day TRINQ is in the SELL zone.

Components of SPX above their respective 200day MA Chart
This scoring indicator rallied to 32.4% area. This index has now clearly moved into the negative territory here.
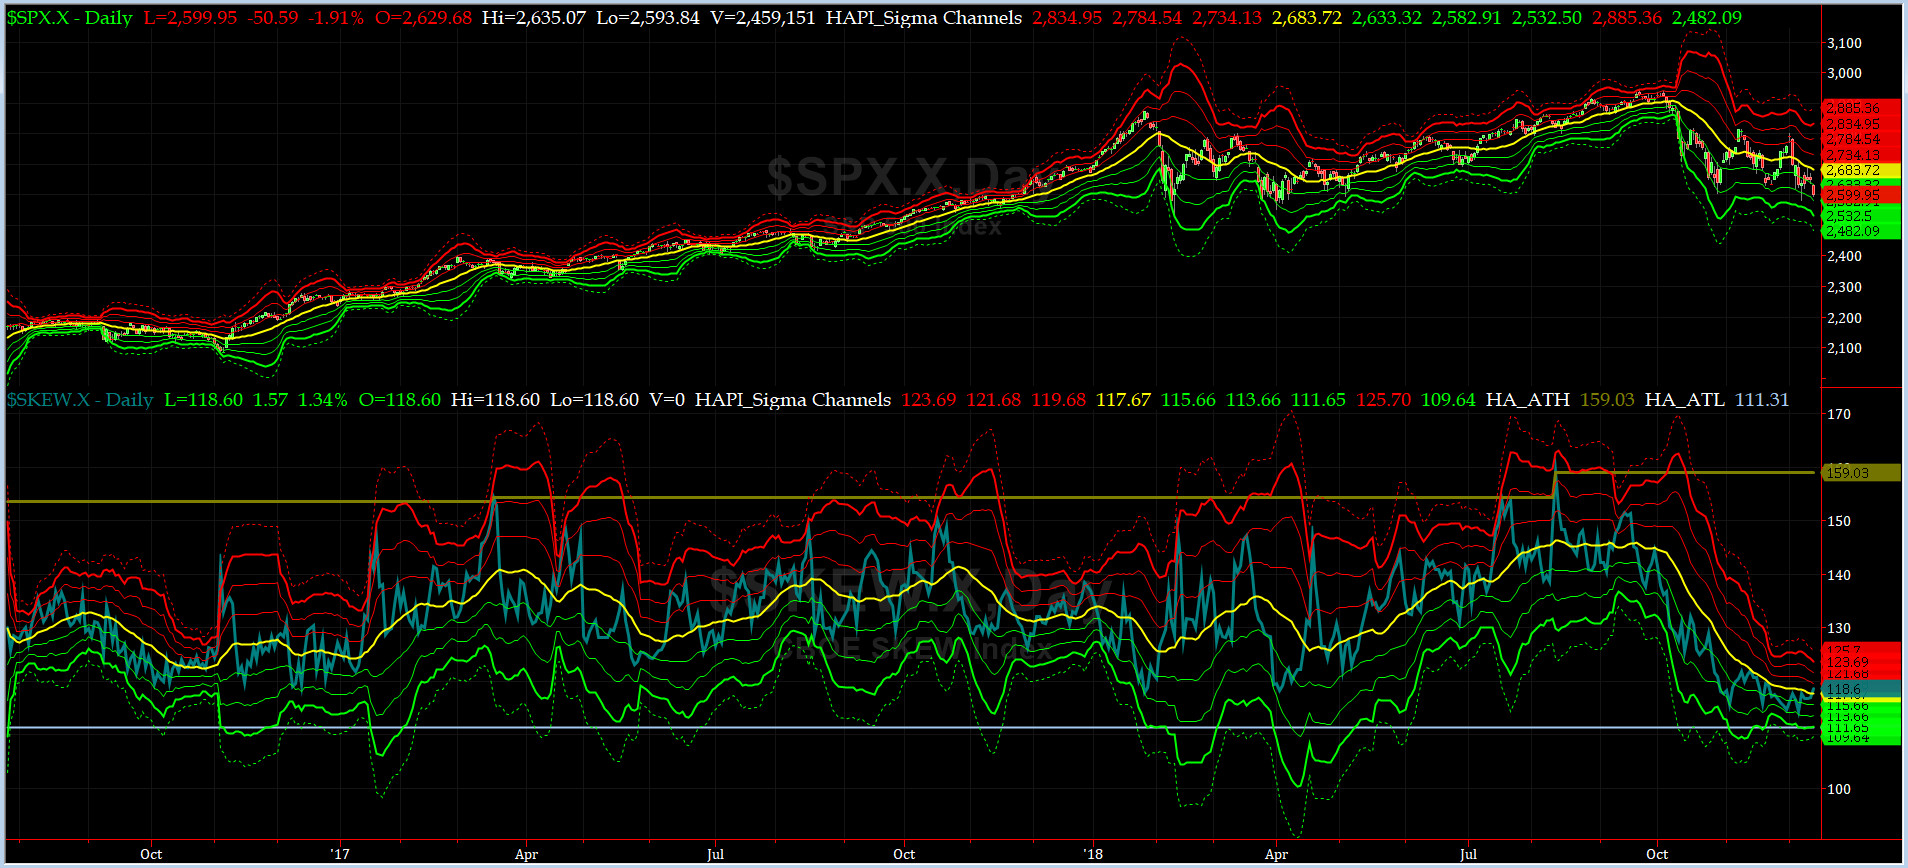
SPX SKEW (Tail Risk) Chart
On Friday, SPX SKEW (Tail Risk) closed near 118.6, still about its zero sigma (normal = 120-125, range 100-150).
Is all quiet on the Eastern & Mid-Western Fronts? Our beloved @Capt_Tiko shares with us that this was SKEW's first uptick in a long time....stay tuned.
How to interpret the value of SPX SKEW? (from CBOE white paper on SKEW)

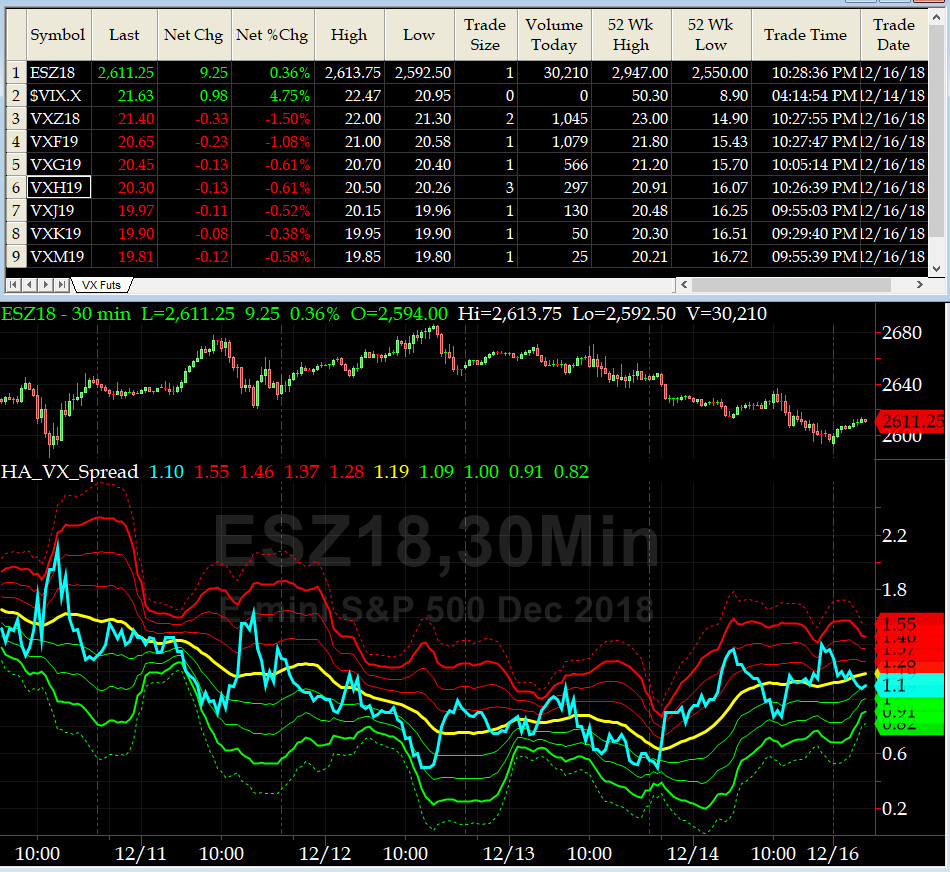
3-month VIX Futures Spread(VX) Chart
This popular timing indicator, (long DEEZ18, & short MAR19 VIX Futures) closed at +1.36 which says SPX is OVERSOLD.
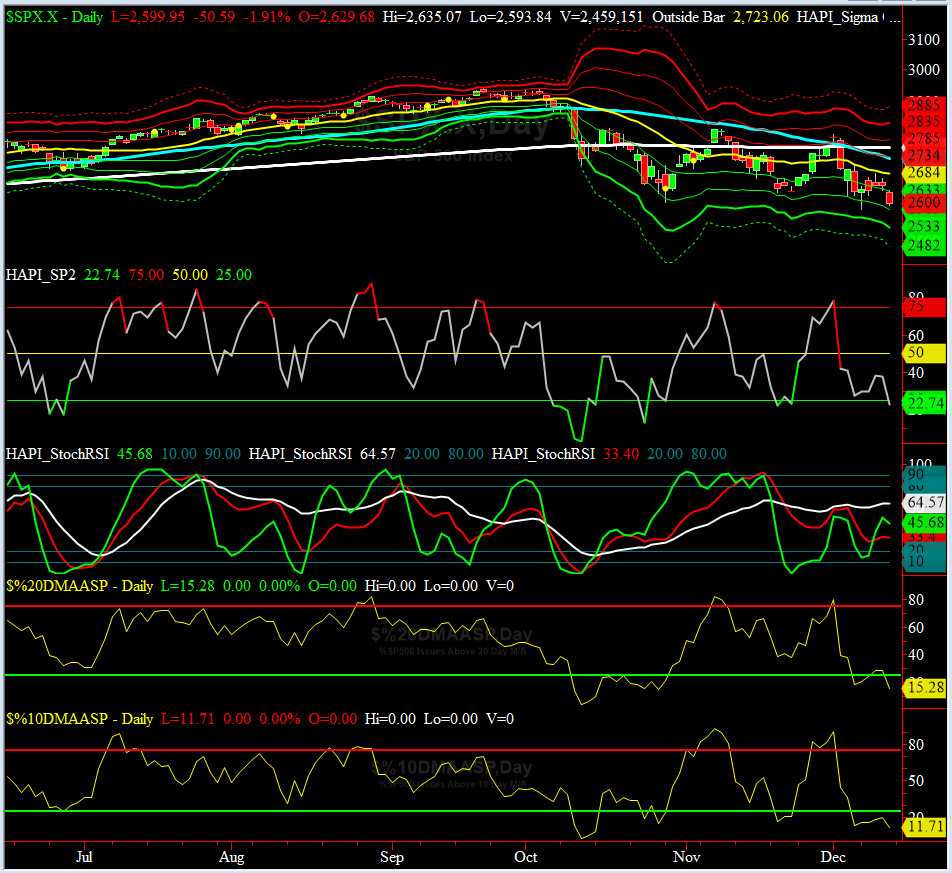
HA_SP2 Chart
HA_SP2 = 22.7 (Buy signal <= 25, Sell Signal >= 75)
Our coveted SP2 prop indicator is again in oversold zone. We should expect a bounce here.
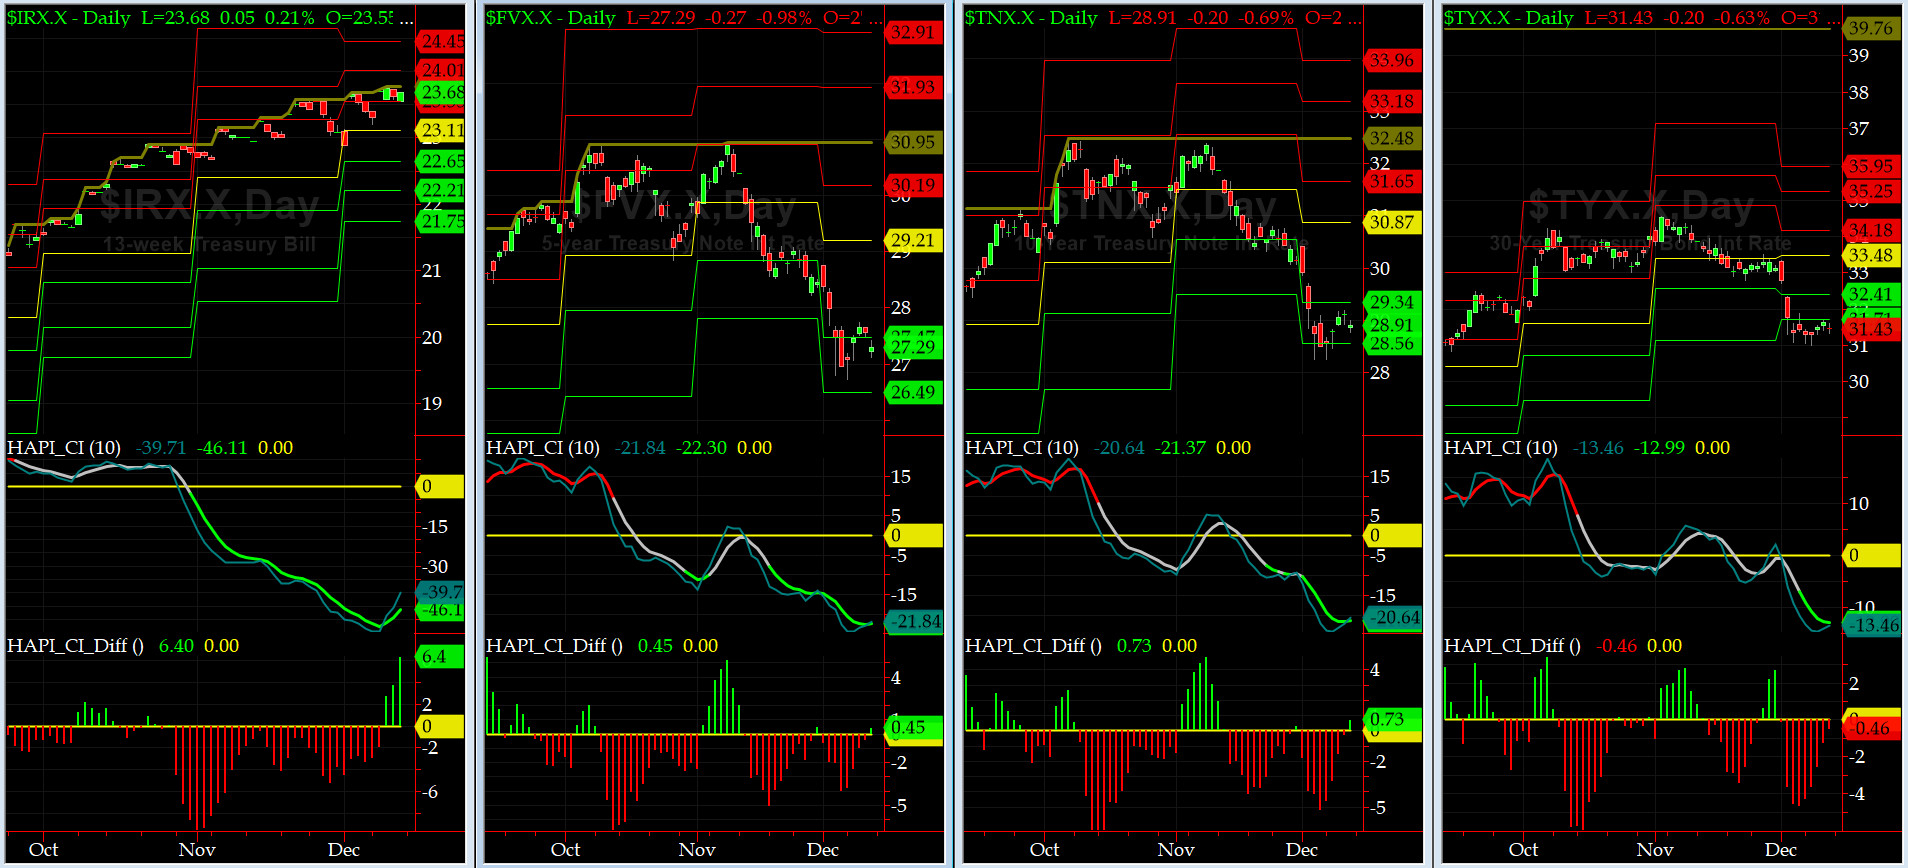
US Treasury T-Notes & T-Bonds Yields Chart
There was very little change in YTMs this week. All eyes are on Wednesday, the last FOMC Meeting for 2018.
Fari Hamzei
|
|
|
|
|
|
Customer Care:
|
|
|
|
|
|
|
 |
 |
|
 |
|
 |
 |
 |
HA YouTube Channel ::: HA Blog ::: Testimonials ::: Tutorials & FAQs ::: Privacy Policy
|
Trading Derivatives (Options & Futures) contains substantial risk and is not for every investor. An investor could potentially lose all or more than his/her initial investment.
Only risk capital should be used for trading and only those with sufficient risk capital should consider trading derivatives. Past performance is not
necessarily indicative of future results. Testimonials appearing on this website may not be representative of other clients or customers
and are not a guarantee of future performance or success.
|
| (c) 1998-2025, Hamzei Analytics, LLC.® All Rights Reserved. |
|
|