|
Tuesday, December 25, 2018, 2200ET
Market Timing Charts, Analysis & Commentary for Issue #272

Timer Charts of S&P-500 Cash Index (SPX) + NASDAQ-100 Cash Index (NDX)
Most recent S&P-500 Cash Index (SPX): 2351 down -249 (down -9.6%) for the six trading days ending on Monday, December 24, 2018, which closed about its -2.5 sigma.
DJIA ALL TIME INTRADAY HIGH = 26951 (reached on Wednesday, October 3, 2018)
DJ TRAN ALL TIME INTRADAY HIGH = 11623 (reached on Friday, September 14, 2018)
SPX ALL TIME INTRADAY HIGH = 2941 (reached on Friday, September 21, 2018)
NDX ALL TIME INTRADAY HIGH = 7700 (reached on Thursday, October 1, 2018)
RUT ALL TIME INTRADAY HIGH = 1742 (reached on Friday, August 31, 2018)
Current DAILY +2 Sigma SPX = 2850 with WEEKLY +2 Sigma = 3063
Current DAILY 0 Sigma SPX = 2621 with WEEKLY 0 Sigma = 2748
Current DAILY -2 Sigma SPX = 2393 with WEEKLY -2 Sigma = 2433
NYSE McClellan Oscillator = -313 (-150 is start of the O/S area; around -275 to -300 area or lower, we go into the �launch-pad� mode; over +150, we are in O/B area)
NYSE Breadth Thrust = 28.5 (40 is considered as oversold and 65 as overbought)
We just went thru the worst week for SPX in several years as Washington continues to deliver back to back fumbles, much to the delight of the shorts.
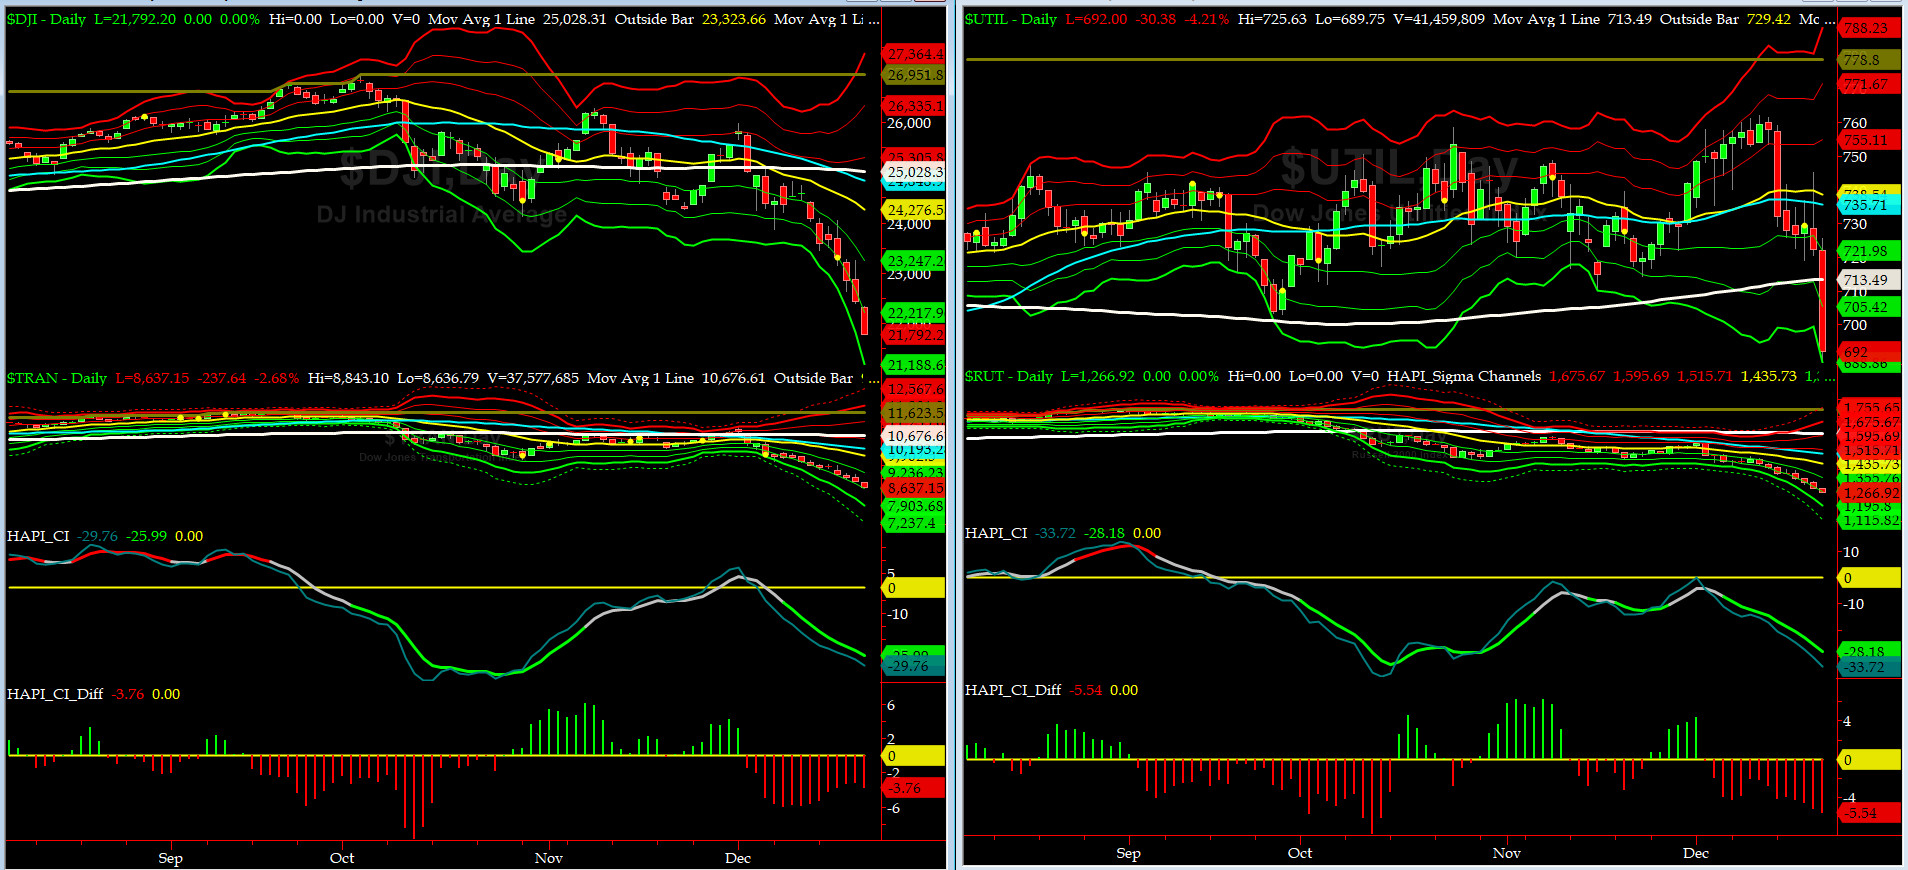
Canaries [in the Coal Mine] Chart for DJ TRAN & RUT Indices
200-Day MA DJ TRAN = 10,676 or 19.1% ABOVE DJ TRAN (max observed in last 7 yrs = 20.2%, min = -20.3%)
200-Day MA RUT = 1604 or 21.5% ABOVE RUT (max observed in last 7 yrs = 21.3%, min = -22.6%)
DJ Transportation Index (proxy for economic conditions 6 to 9 months hence) fell off the cliff.
Russell 2000 Small Caps Index (proxy for Risk ON/OFF) double flushed the weak hands. RISK ON is history.

DeTrenders Charts for SPX, NDX, TRAN & RUT Indices
50-Day MA SPX = 2684 or 12.4% ABOVE SPX (max observed in last 7 yrs = +8.6%, min = -9.3%)
200-Day MA SPX = 2751 or 14.6% ABOVE SPX (max observed in last 7 yrs = 15.2%, min = -14%)
All EIGHT out of EIGHT of our DeTrenders are in the VERY NEGATIVE territory. The DeTrenders for DJ Tran & RUT will continue to be harbingers of future price behavior in broad indices.
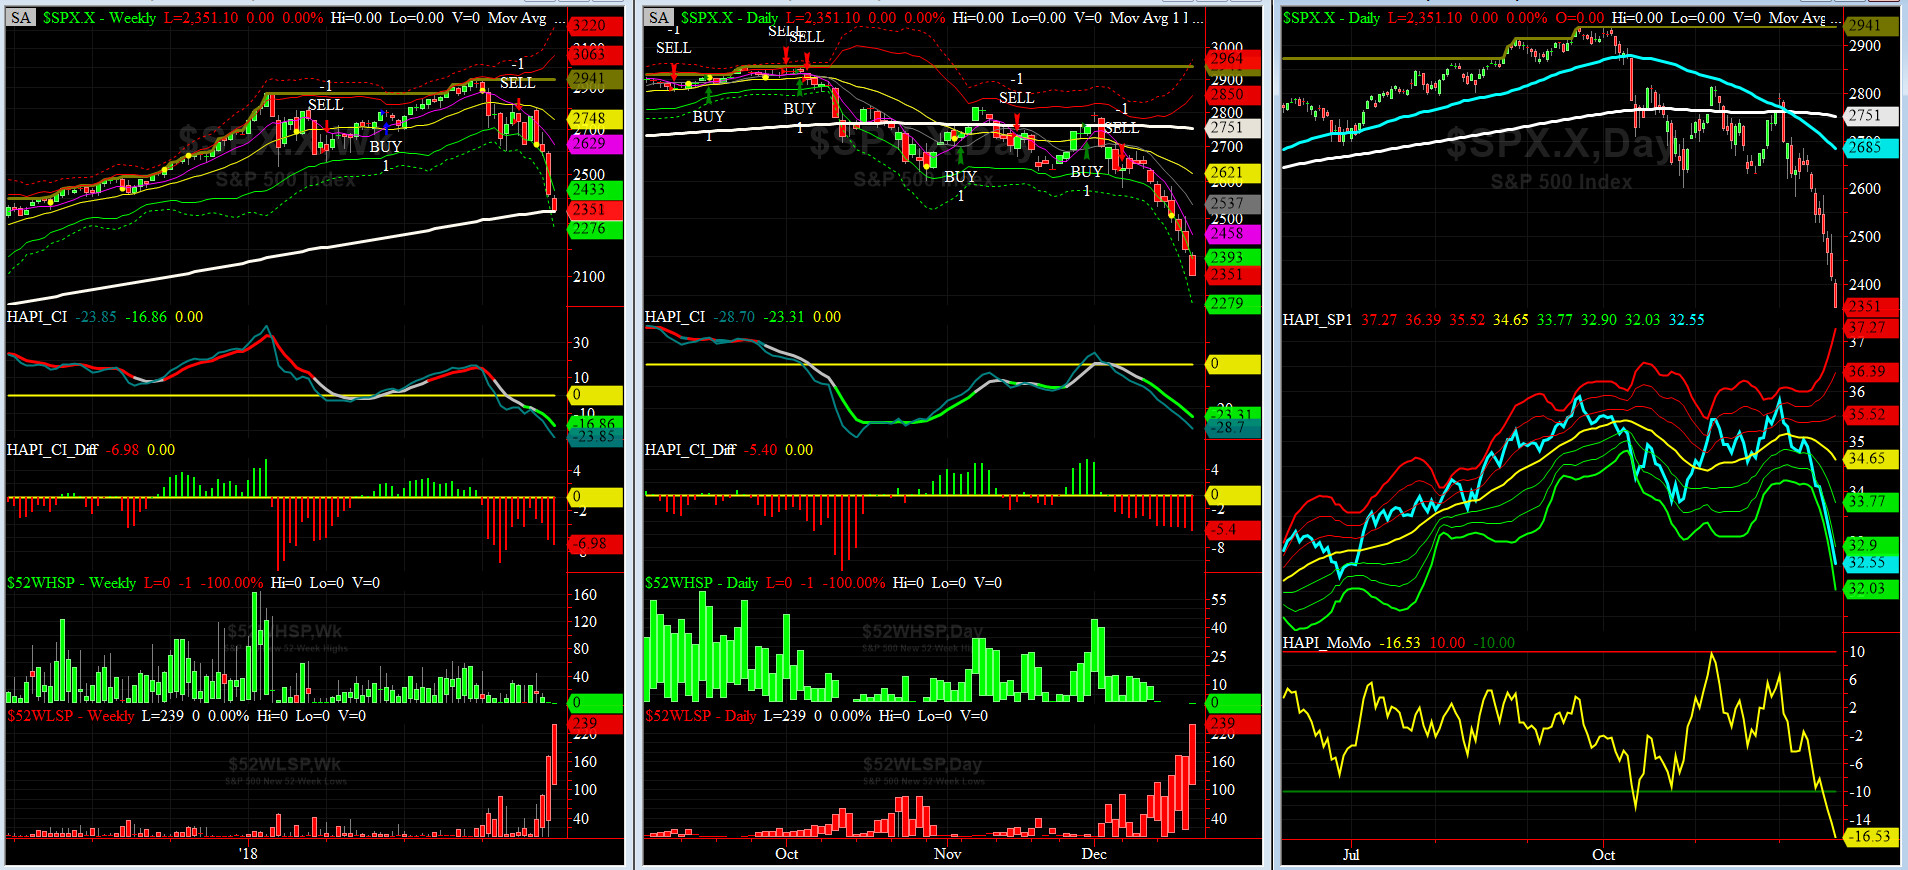
HA_SP1_Momo Chart
WEEKLY Timing Model = on a SELL Signal since Friday, November 16, 2018 CLOSE at 2736
DAILY Timing Model = on a SELL Signal since Monday, December 10, 2018 CLOSE at 2637
Max SPX 52wk-highs reading last week = 0 (over 120-140, the local maxima is in)
Max SPX 52wk-Lows reading last week = 239 (over 40-60, the local minima is in)
HA_SP1 closed near its -2.5 sigma channels
HA_Momo = -16.5 (reversals most likely occur above +10 or below -10)
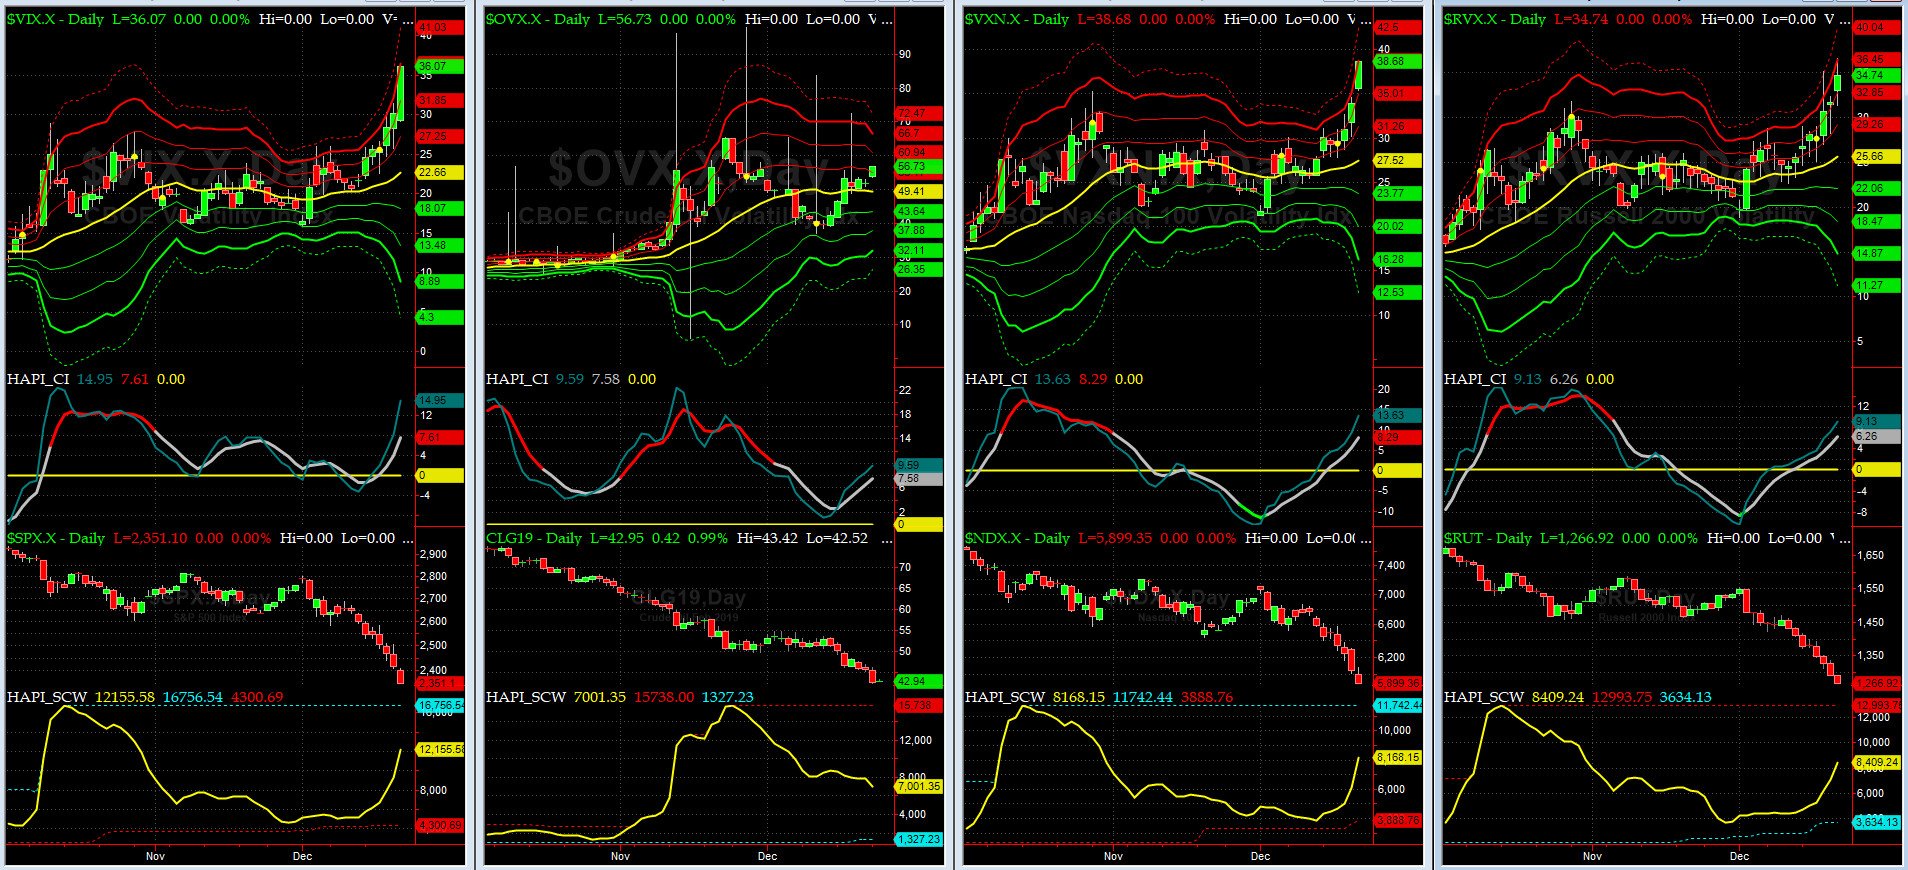
Vol of the Vols Chart
Spot VIX currently stands at 36.1, at about its +3 sigma (remember it's the VIX volatility pattern aka "its sigma channels" that matters, and not the level of VIX itself (this is per Dr. Robert Whaley, a great mentor and inventor of original VIX, now called VXO). VIX usually peaks around a test of its +4 sigma).
Last shockwave of 2018 is here.
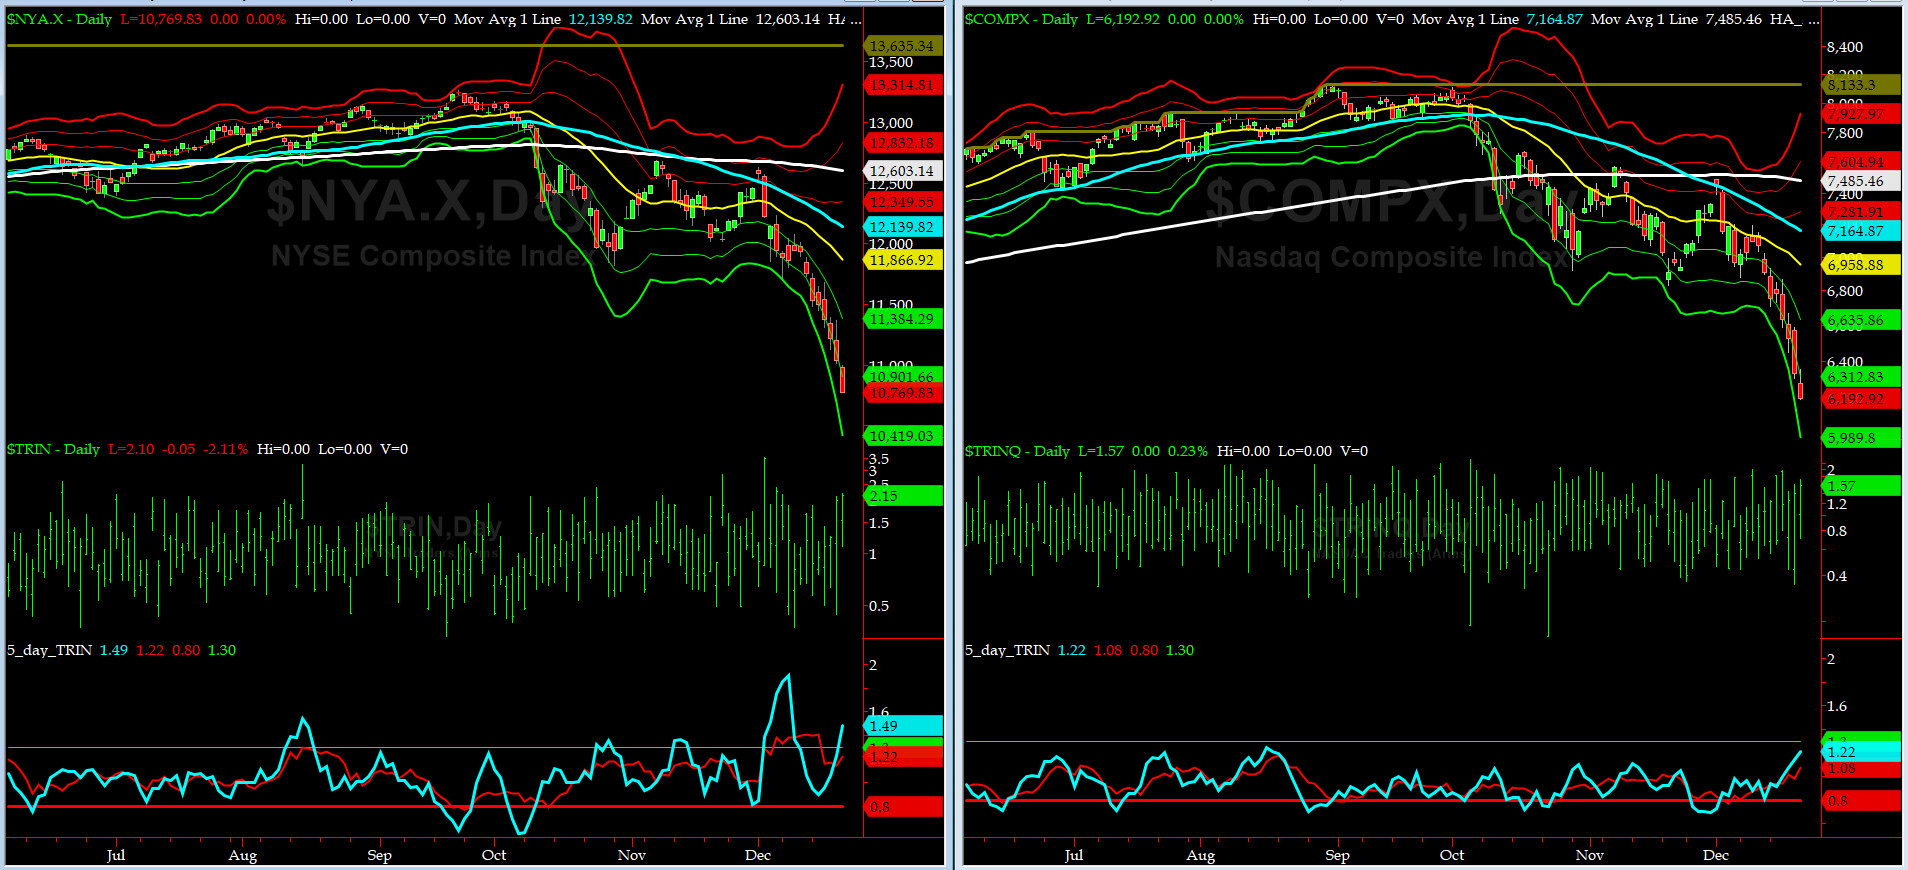
5-day TRIN & TRINQ Charts
Both NYSE & NASDAQ 5-day TRINs are in or near the BUY zone.
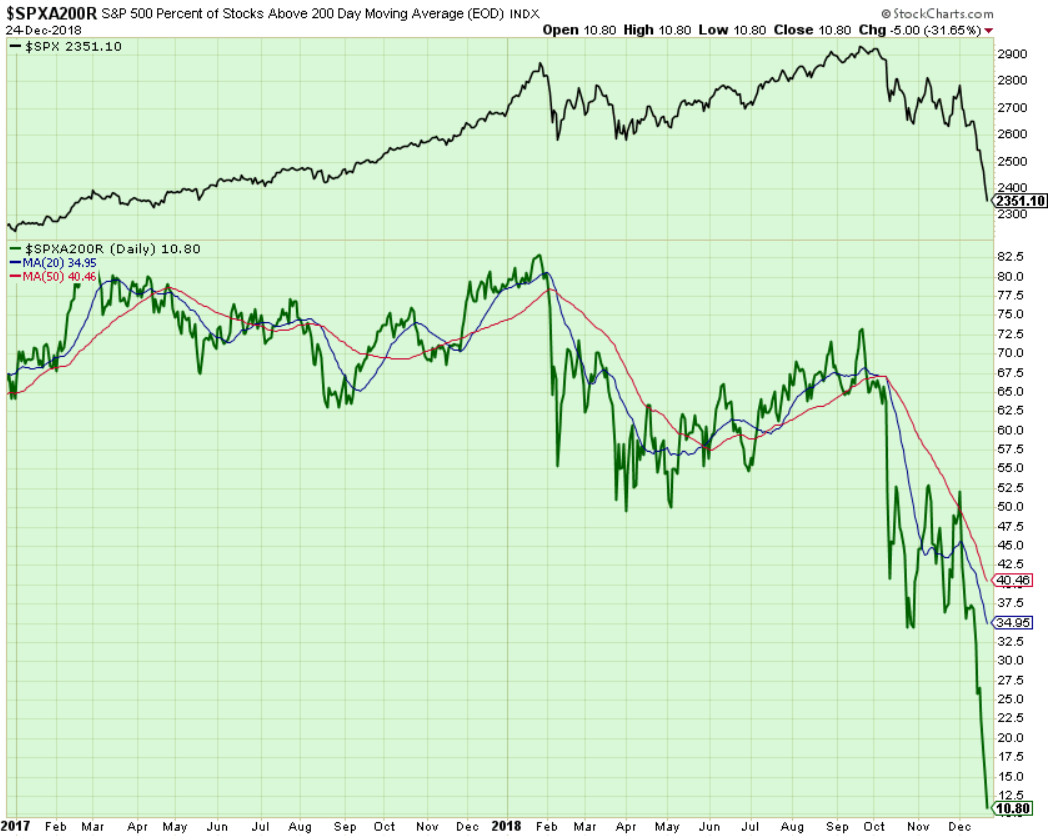
Components of SPX above their respective 200day MA Chart
This scoring indicator rallied to 10.8% area. This index has now clearly moved into the OVERSOLD territory here.
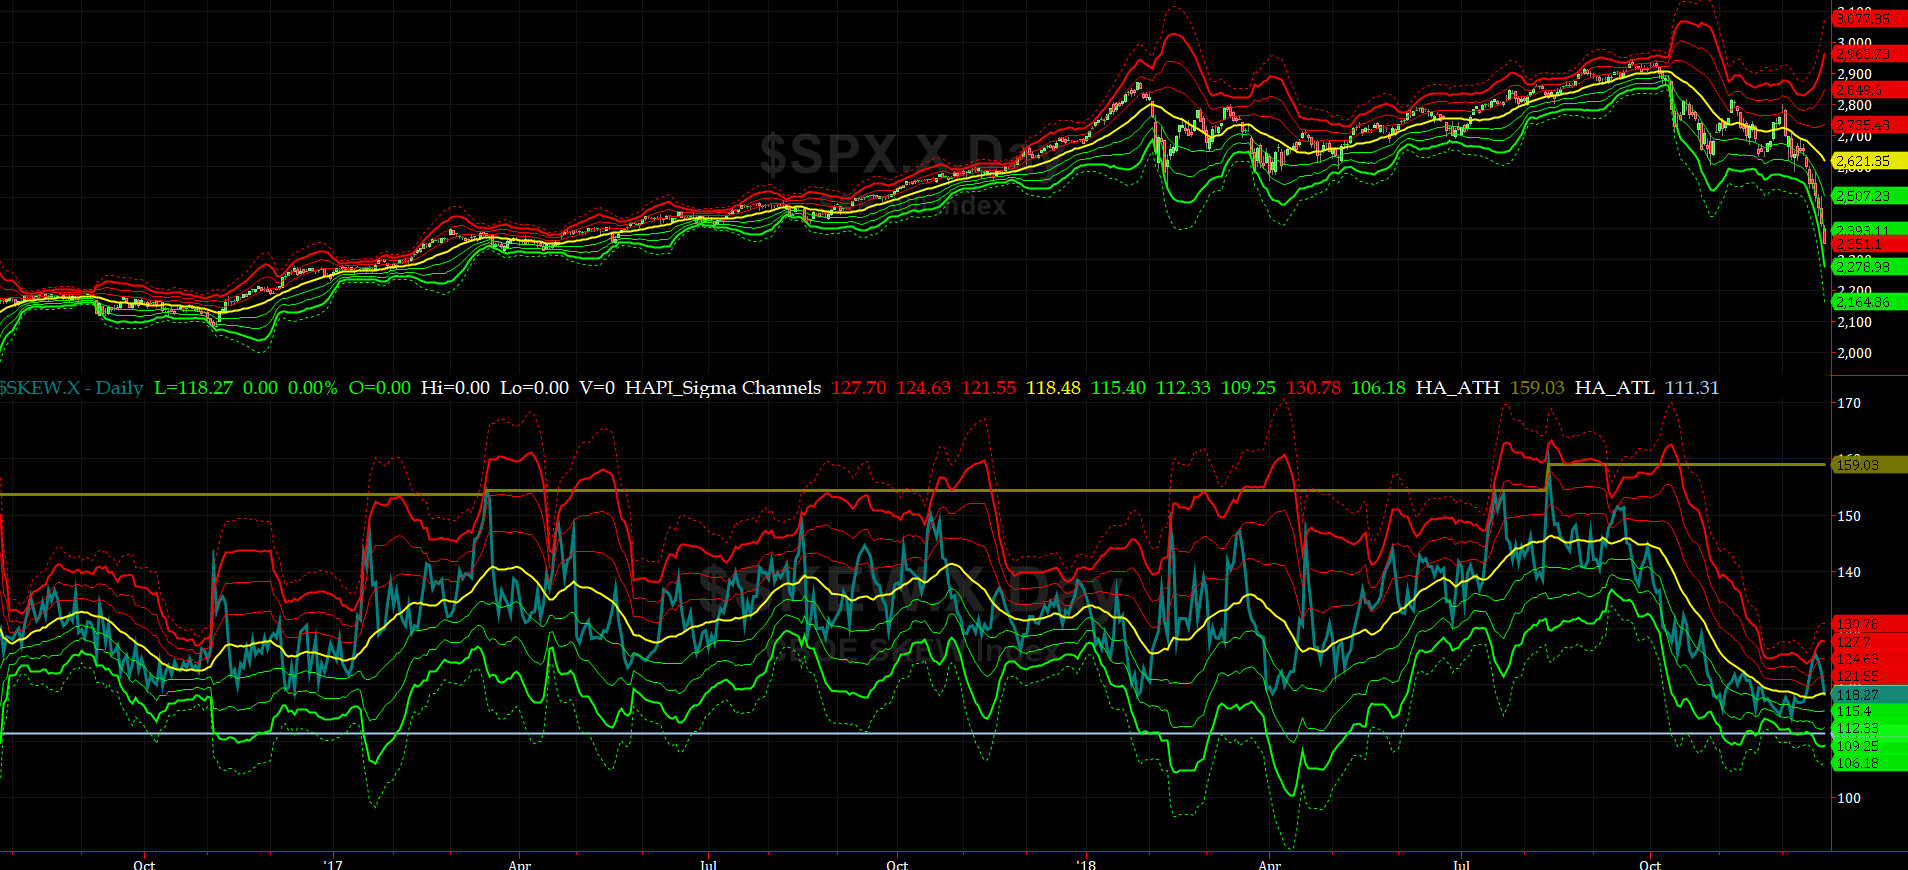
SPX SKEW (Tail Risk) Chart
On Friday, SPX SKEW (Tail Risk) closed near 118.3, still about its zero sigma (normal = 120-125, range 100-150).
Nothing is quiet on the Eastern & Mid-Western Fronts....
How to interpret the value of SPX SKEW? (from CBOE white paper on SKEW)


3-month VIX Futures Spread(VX) Chart
This popular timing indicator, (long JAN19, & short APR19 VIX Futures) closed at +4.9 which says SPX is UBER OVERSOLD.

HA_SP2 Chart
HA_SP2 = 3.7 (Buy signal <= 25, Sell Signal >= 75)
Our coveted SP2 prop indicator is in uber oversold zone. We continue to think that we should expect a bounce here. But then again, what do we know that you/others don't.
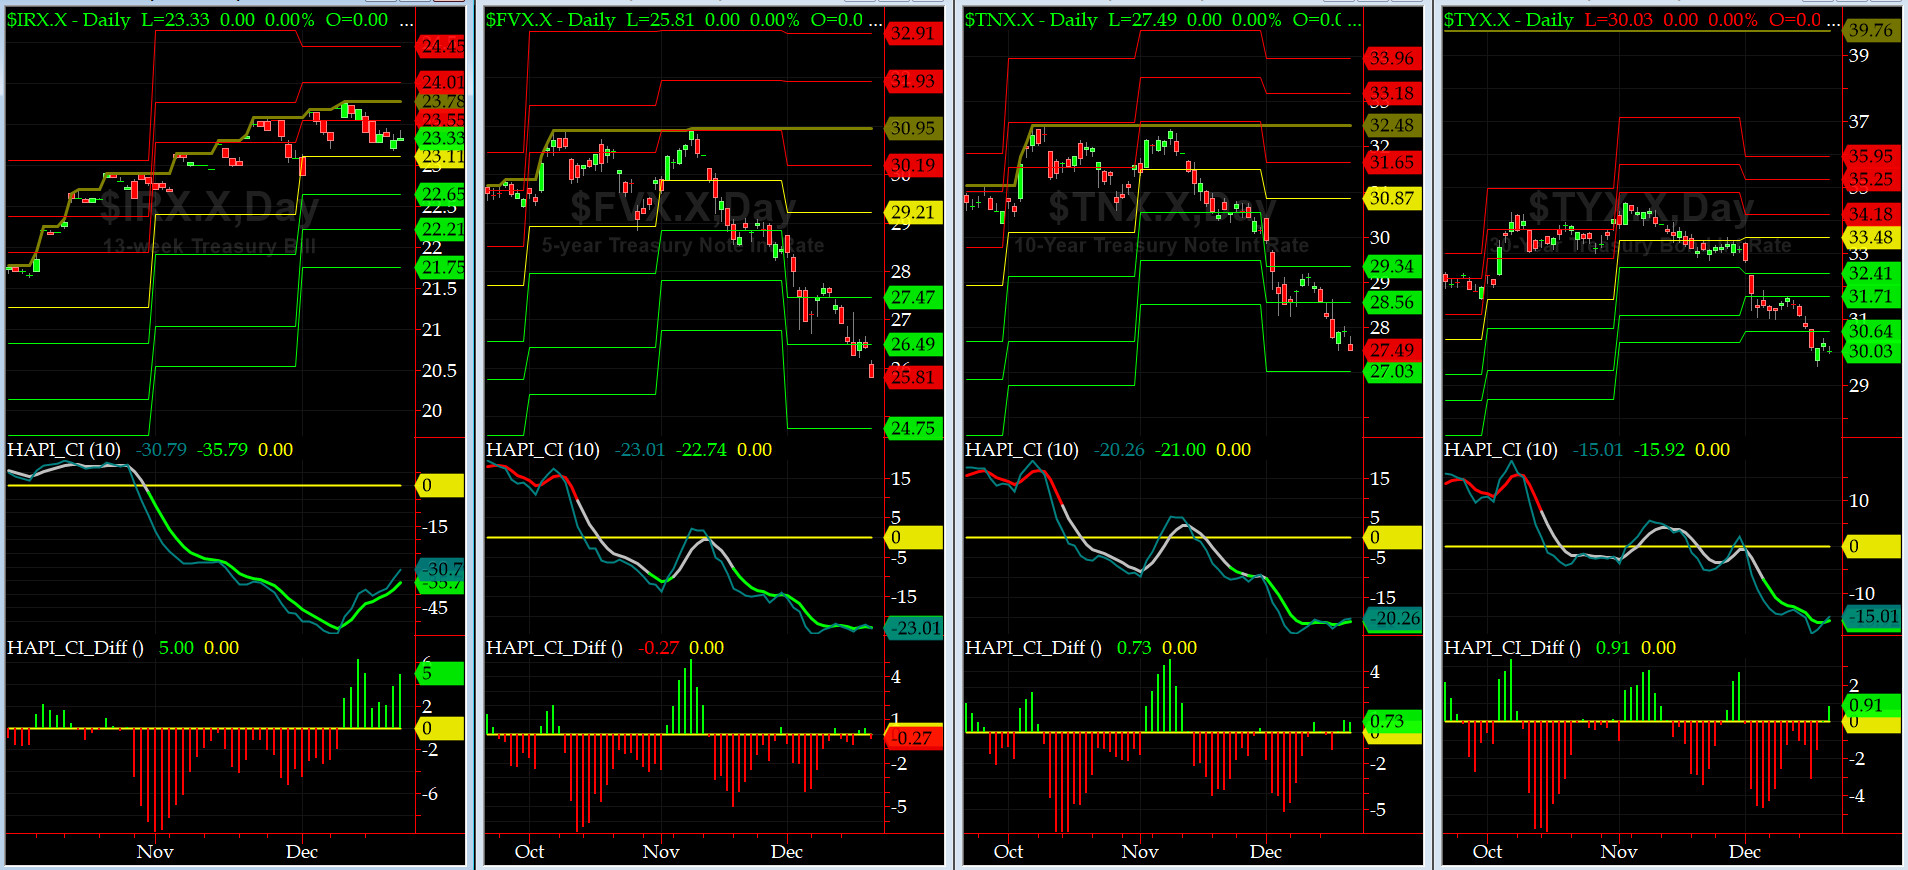
US Treasury T-Notes & T-Bonds Yields Chart
The YTMs continued to sink despite a rate hike by the Fed.
Fari Hamzei
|


 Proactive Market Timing


