|
Wednesday, January 2, 2019, 1900ET
Market Timing Charts, Analysis & Commentary for Issue #273
Timer Charts of S&P-500 Cash Index (SPX) + NASDAQ-100 Cash Index (NDX)
Most recent S&P-500 Cash Index (SPX): 2510 up +159 (up +6.8%) for the five trading days ending on Wednesday, January 2, 2019, which closed about its -0.5 sigma.
DJIA ALL TIME INTRADAY HIGH = 26951 (reached on Wednesday, October 3, 2018)
DJ TRAN ALL TIME INTRADAY HIGH = 11623 (reached on Friday, September 14, 2018)
SPX ALL TIME INTRADAY HIGH = 2941 (reached on Friday, September 21, 2018)
NDX ALL TIME INTRADAY HIGH = 7700 (reached on Thursday, October 1, 2018)
RUT ALL TIME INTRADAY HIGH = 1742 (reached on Friday, August 31, 2018)
Current DAILY +2 Sigma SPX = 2777 with WEEKLY +2 Sigma = 3038
Current DAILY 0 Sigma SPX = 2564 with WEEKLY 0 Sigma = 2738
Current DAILY -2 Sigma SPX = 2352 with WEEKLY -2 Sigma = 2437
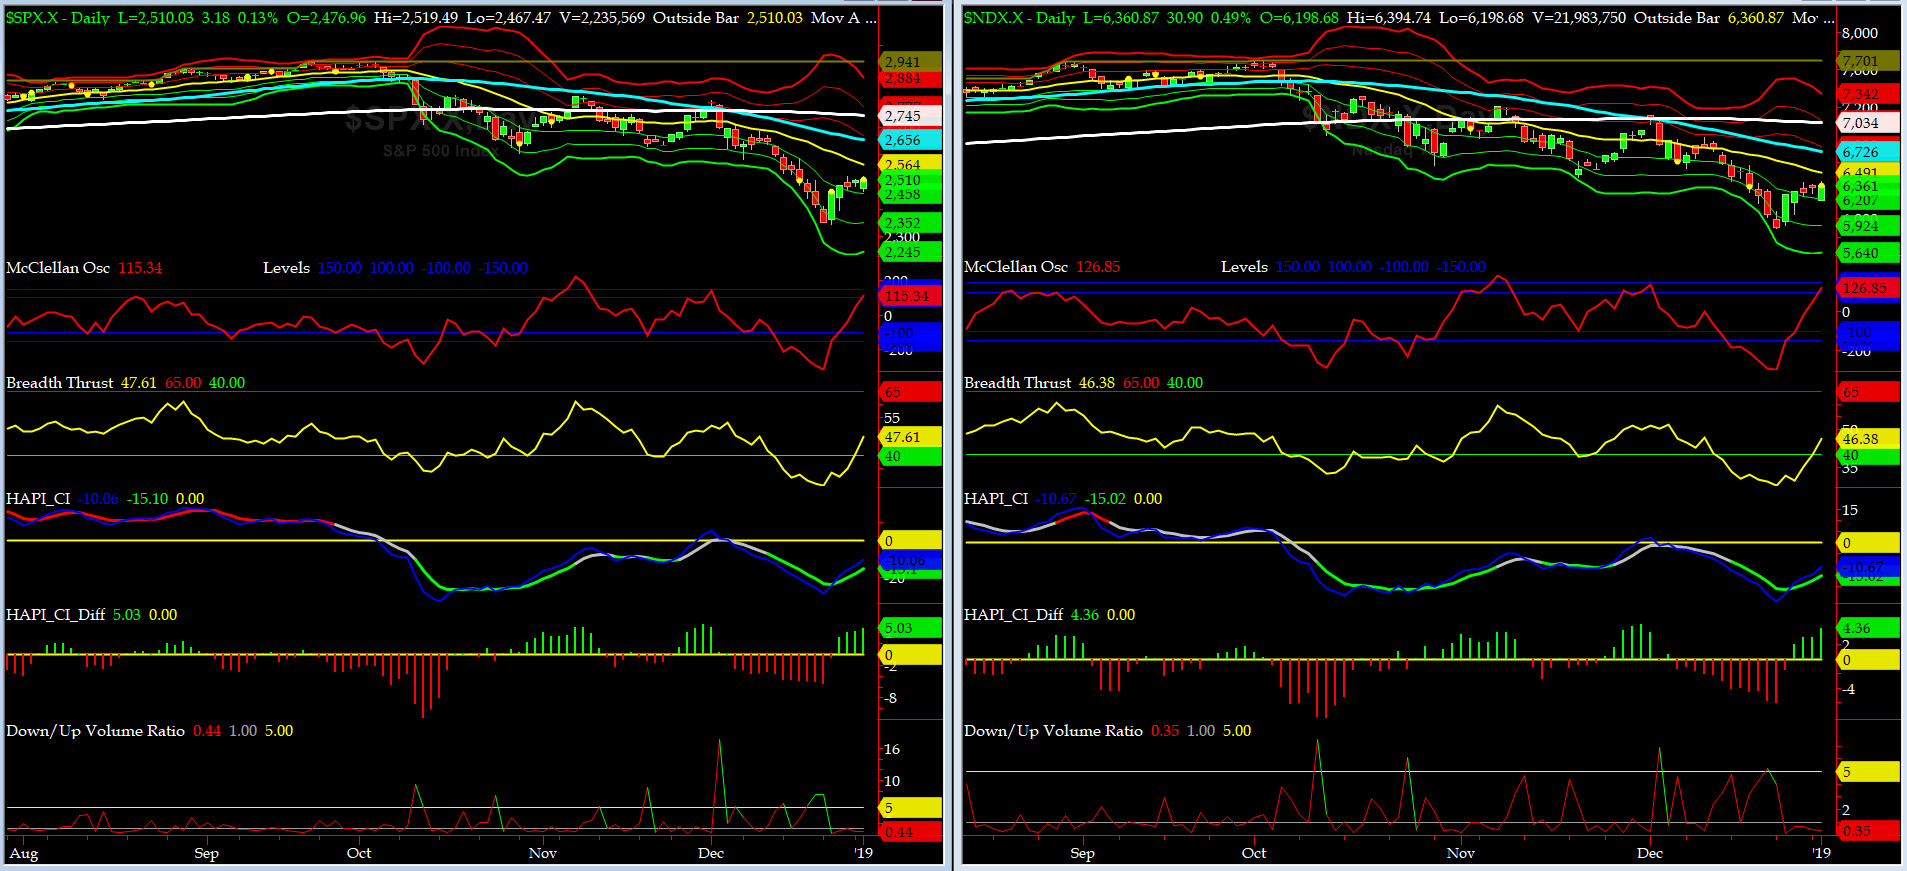
NYSE McClellan Oscillator = +115 (-150 is start of the O/S area; around -275 to -300 area or lower, we go into the �launch-pad� mode; over +150, we are in O/B area)
NYSE Breadth Thrust = 47.6 (40 is considered as oversold and 65 as overbought)
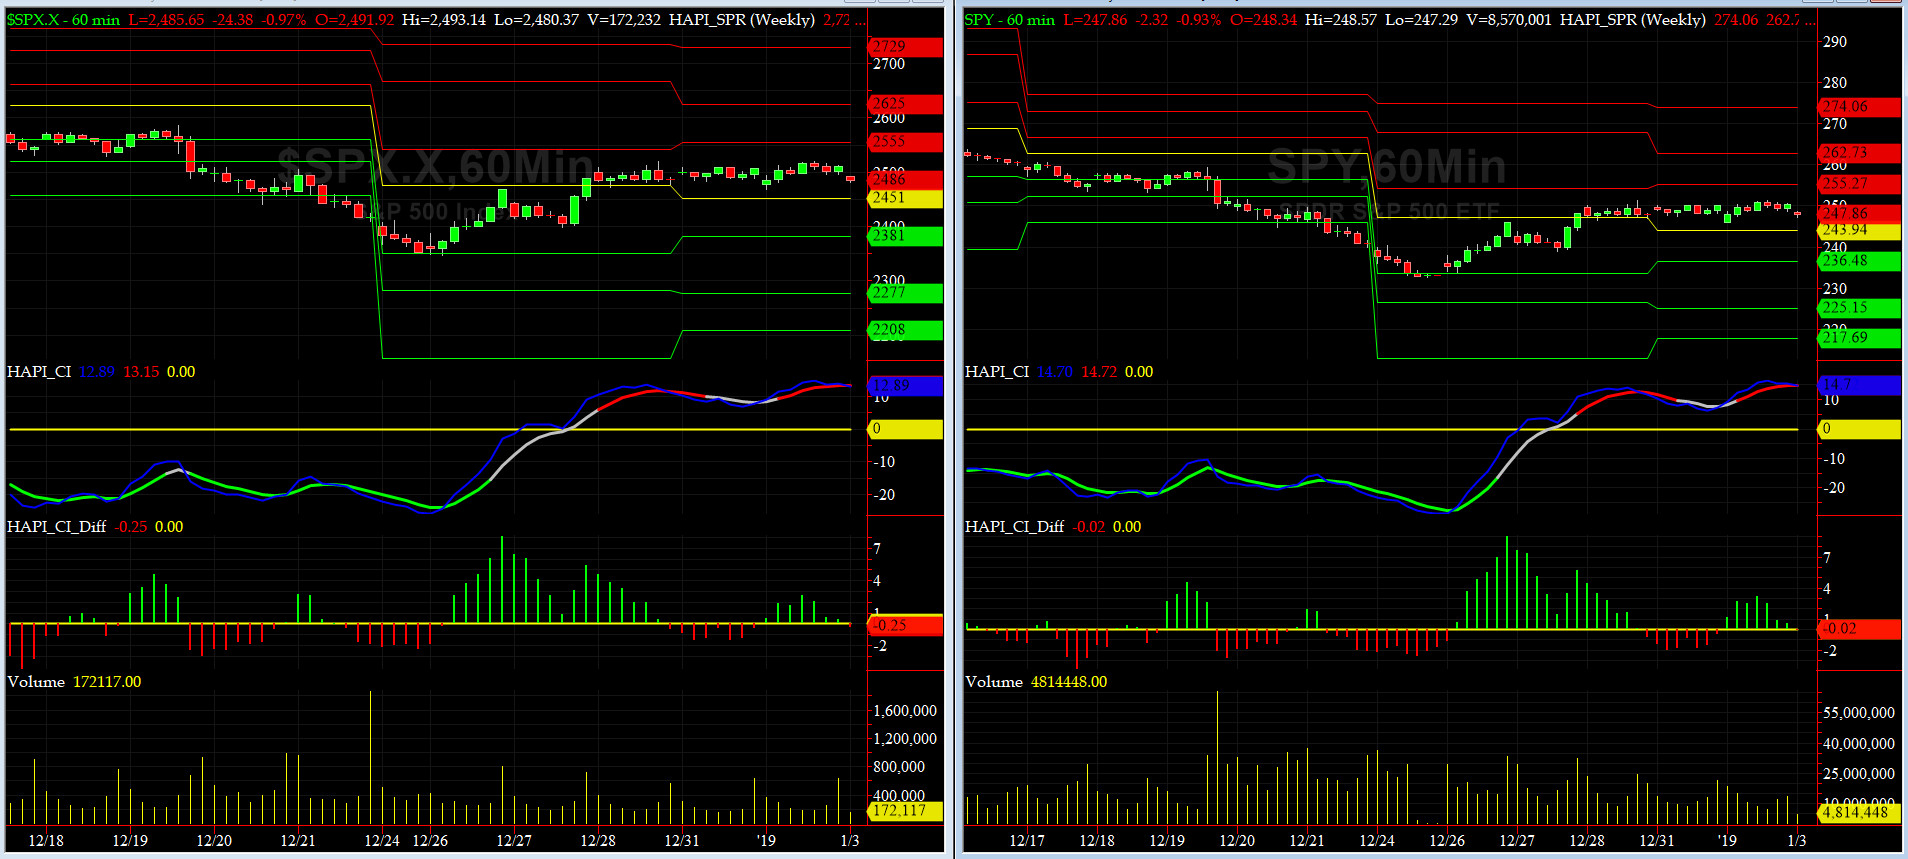
The recent sessions since Christmas Eve have been marred with high intraday volatilty & violent reversals, mainly due to folks being on vacation, and, thus volume being very thin in both cash and derivative (options & futures) markets.

Canaries [in the Coal Mine] Chart for DJ TRAN & RUT Indices
200-Day MA DJ TRAN = 10,638 or 13.5% ABOVE DJ TRAN (max observed in last 7 yrs = 20.2%, min = -20.3%)
200-Day MA RUT = 1598 or 15.2% ABOVE RUT (max observed in last 7 yrs = 21.3%, min = -22.6%)
DJ Transportation Index (proxy for economic conditions 6 to 9 months hence) has managed to recover somewhat but we need to monitor this index carefully.
Russell 2000 Small Caps Index (proxy for Risk ON/OFF) is still in a dismal recovery mode and RISK ON is history.
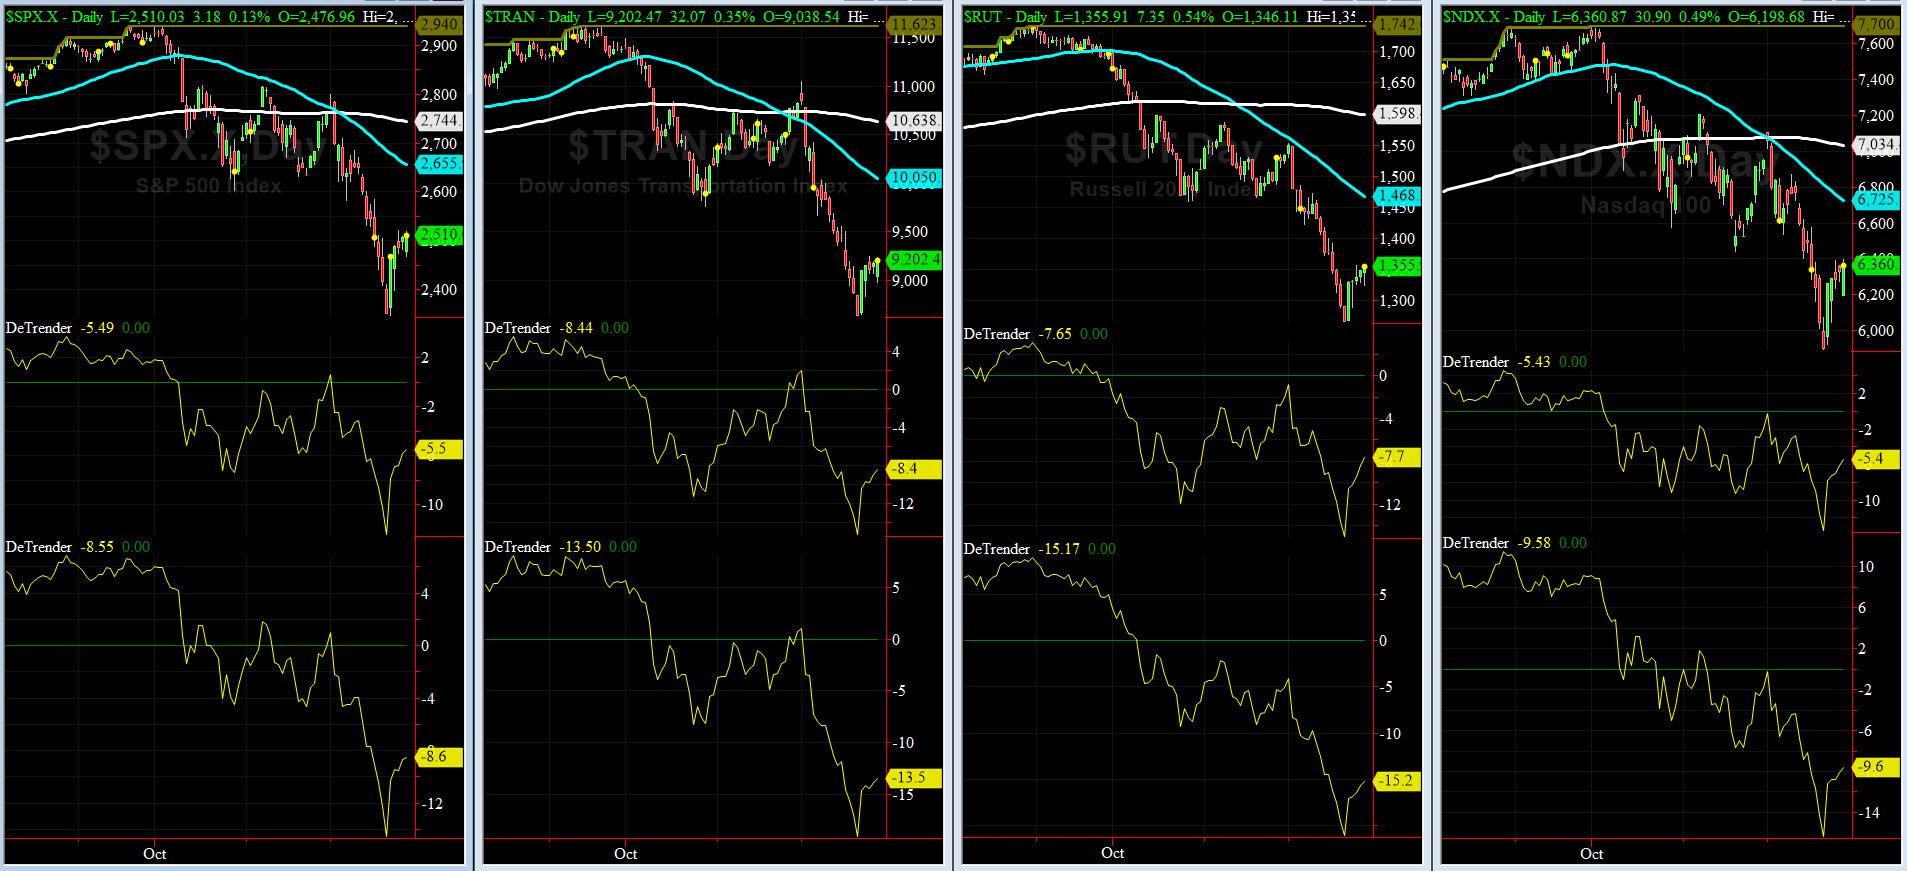
DeTrenders Charts for SPX, NDX, TRAN & RUT Indices
50-Day MA SPX = 2655 or 5.5% ABOVE SPX (max observed in last 7 yrs = +8.6%, min = -9.3%)
200-Day MA SPX = 2744 or 8.6% ABOVE SPX (max observed in last 7 yrs = 15.2%, min = -14%)
All EIGHT out of EIGHT of our DeTrenders are in the VERY NEGATIVE territory. The DeTrenders for DJ Tran & RUT will continue to be harbingers of future price behavior in broad indices.
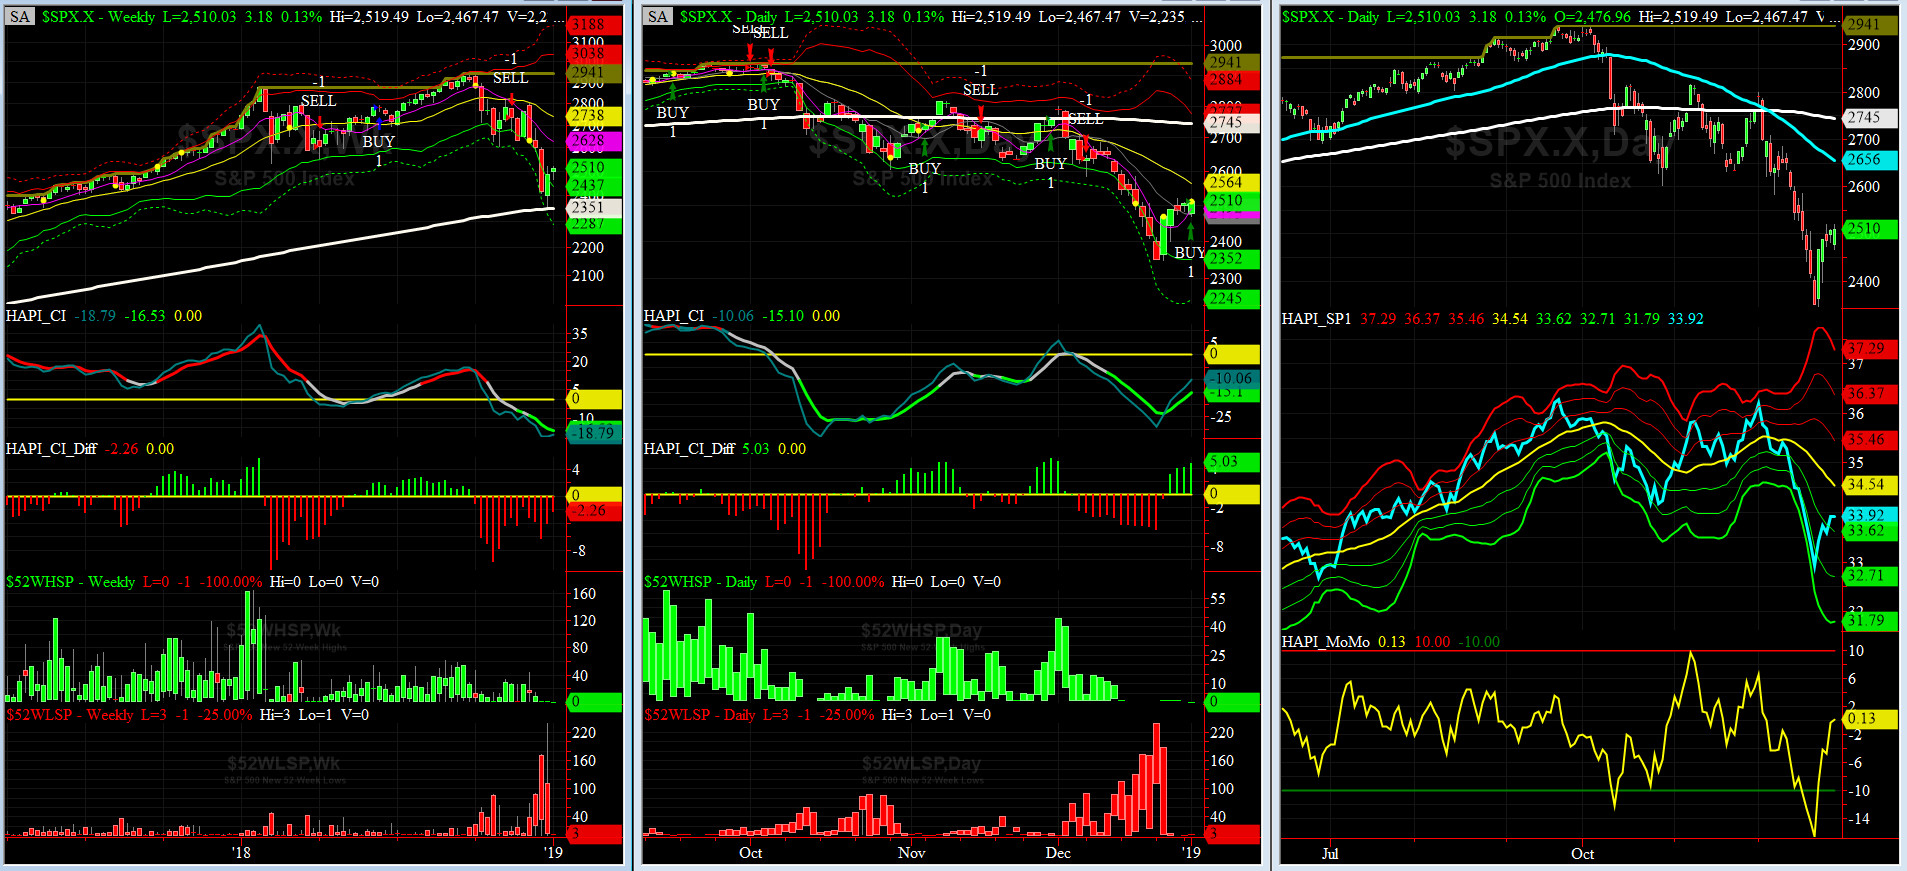
HA_SP1_Momo Chart
WEEKLY Timing Model = on a SELL Signal since Friday, November 16, 2018 CLOSE at 2736
DAILY Timing Model = on a BUY Signal since Wednesday, January 2, 2019 CLOSE at 2510
Max SPX 52wk-highs reading last week = N/A (over 120-140, the local maxima is in)
Max SPX 52wk-Lows reading last week = N/A (over 40-60, the local minima is in)
HA_SP1 closed near its -0.5 sigma channels
HA_Momo = 0.13 (reversals most likely occur above +10 or below -10)
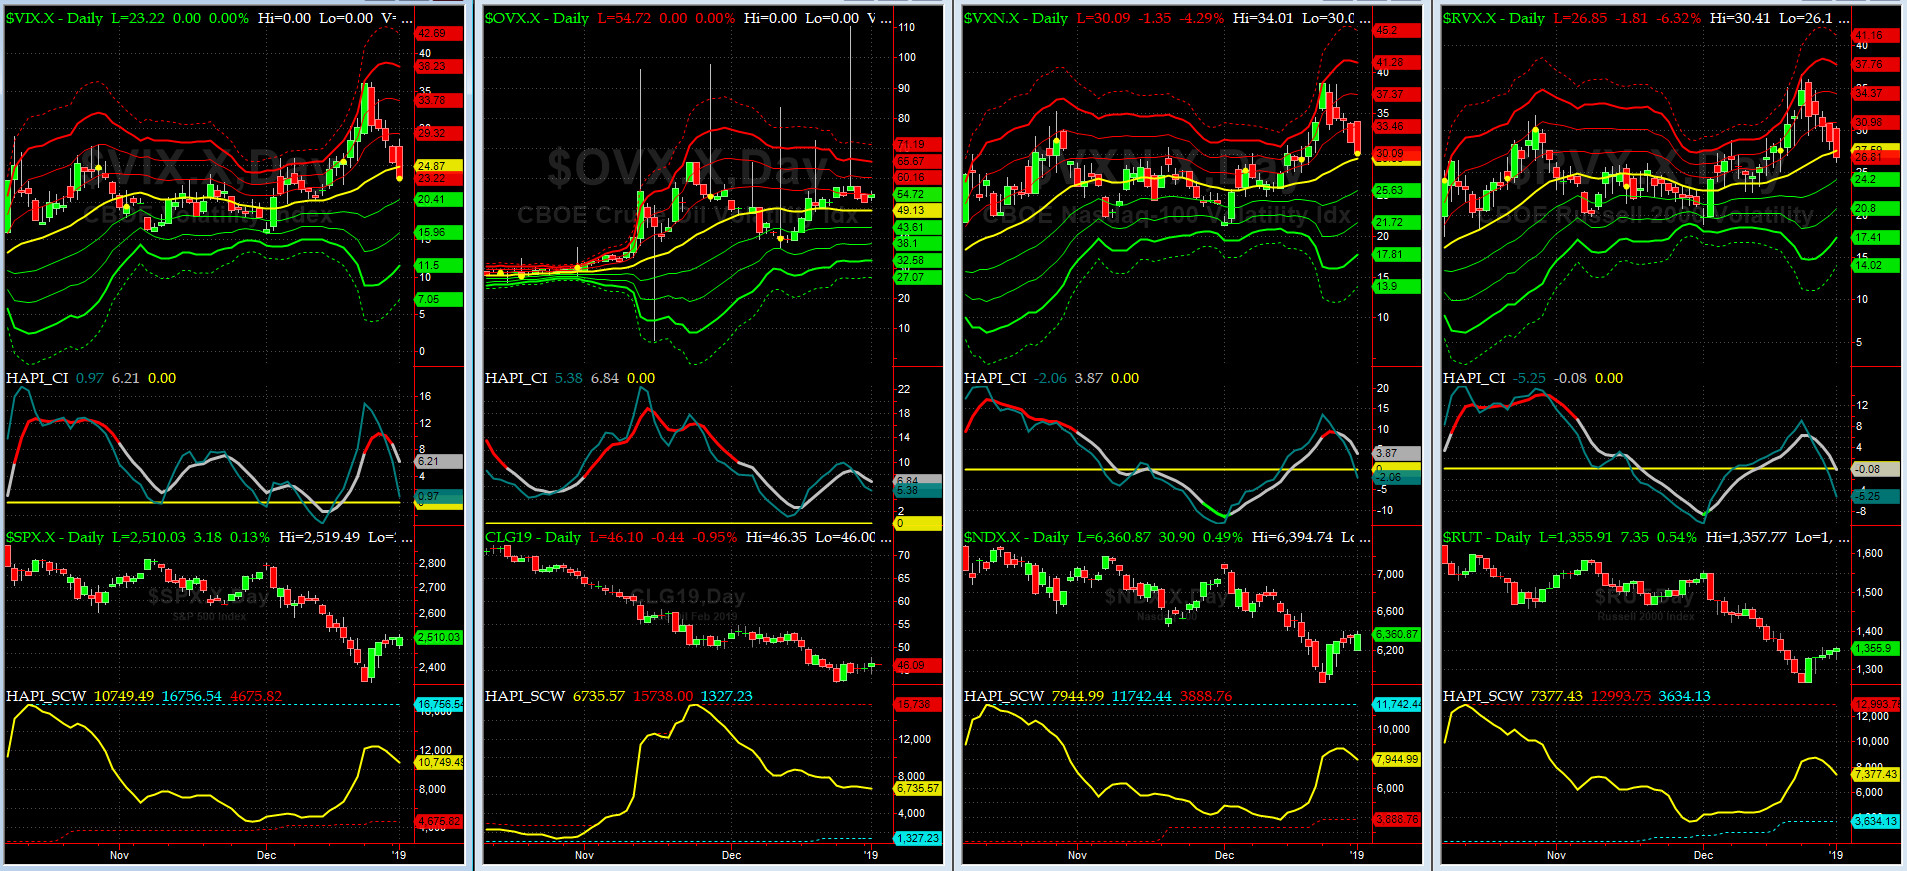
Vol of the Vols Chart
Spot VIX currently stands at 23.2, at about its zero sigma (remember it's the VIX volatility pattern aka "its sigma channels" that matters, and not the level of VIX itself (this is per Dr. Robert Whaley, a great mentor and inventor of original VIX, now called VXO). VIX usually peaks around a test of its +4 sigma).
Last price shockwave of 2018 left us this past week but the stage is now set for 2019 shockwaves (which we think we may witness more this year than last, specially during the first half of the year).
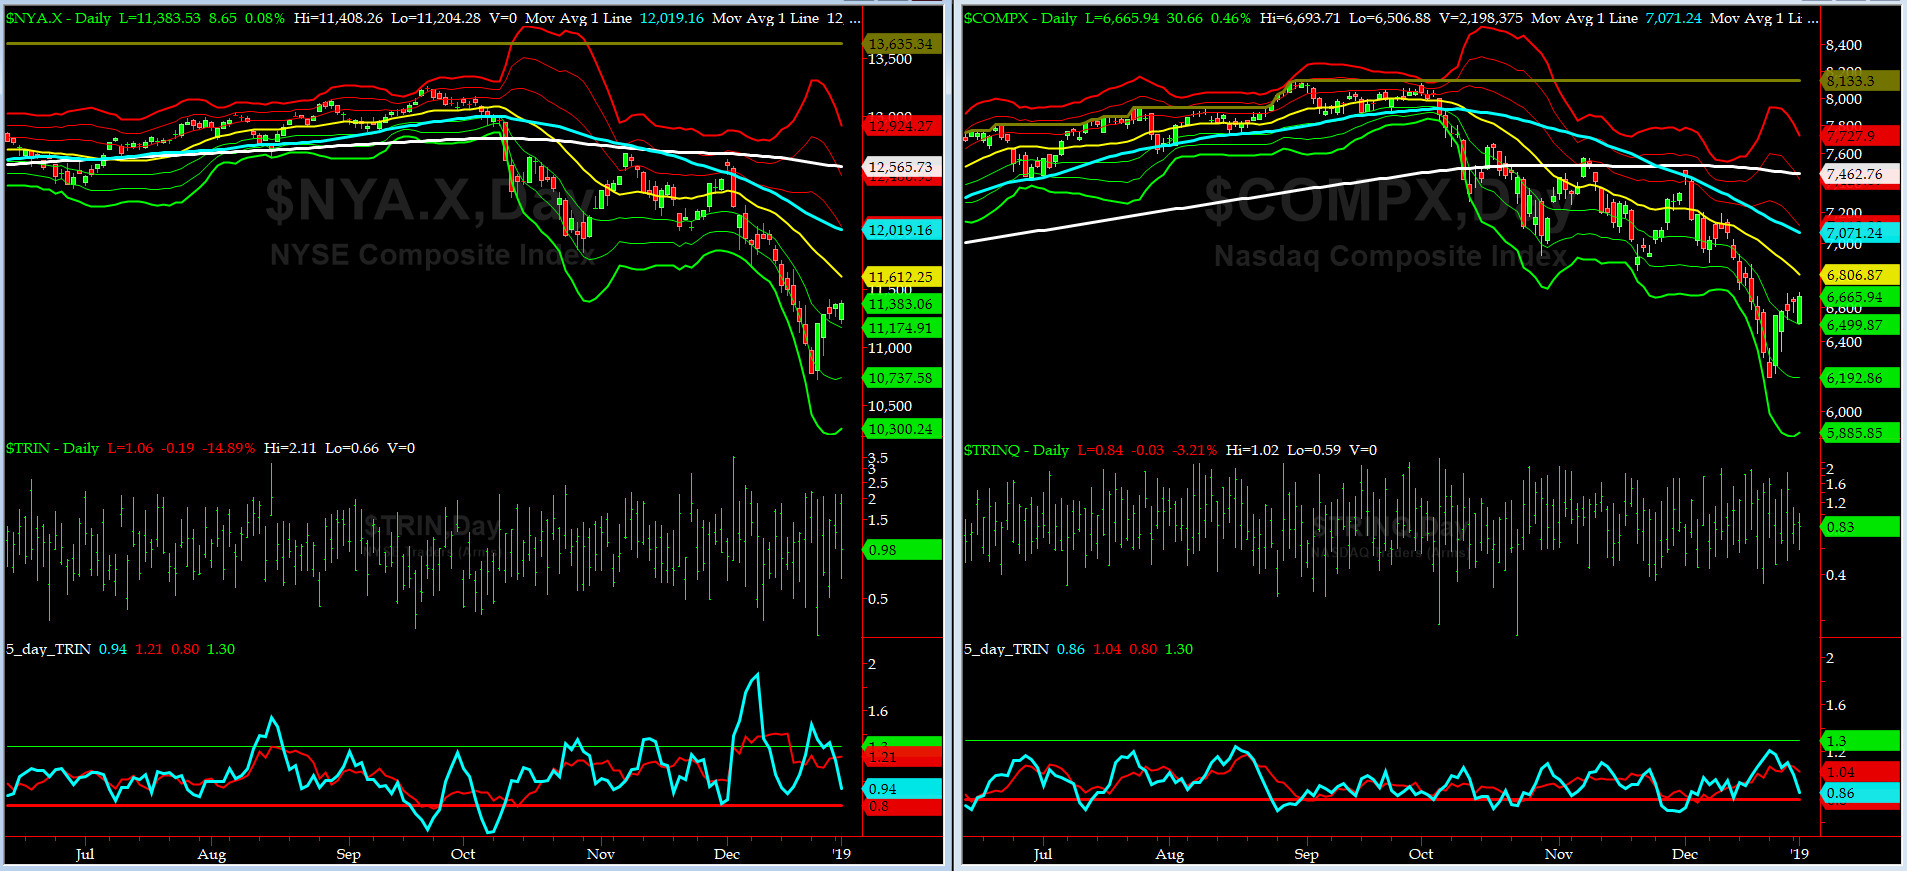
5-day TRIN & TRINQ Charts
Both NYSE & NASDAQ 5-day TRINs are in or near the SELL zones.
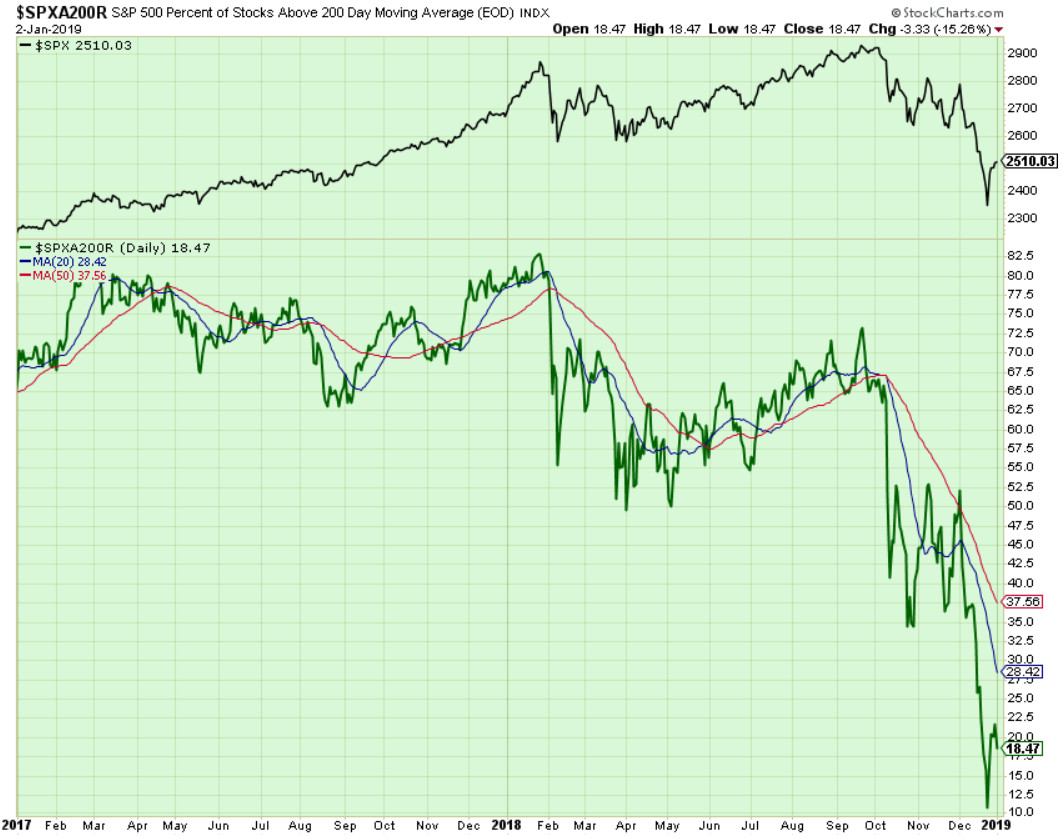
Components of SPX above their respective 200day MA Chart
This scoring indicator rallied to 18.5% area. This index is still in the OVERSOLD territory now.

SPX SKEW (Tail Risk) Chart
On Friday, SPX SKEW (Tail Risk) closed near 116, still about its zero sigma (normal = 120-125, range 100-150).
All quiet on the Eastern & Mid-Western Fronts, again? who knows, depends who you talk to.
How to interpret the value of SPX SKEW? (from CBOE white paper on SKEW)

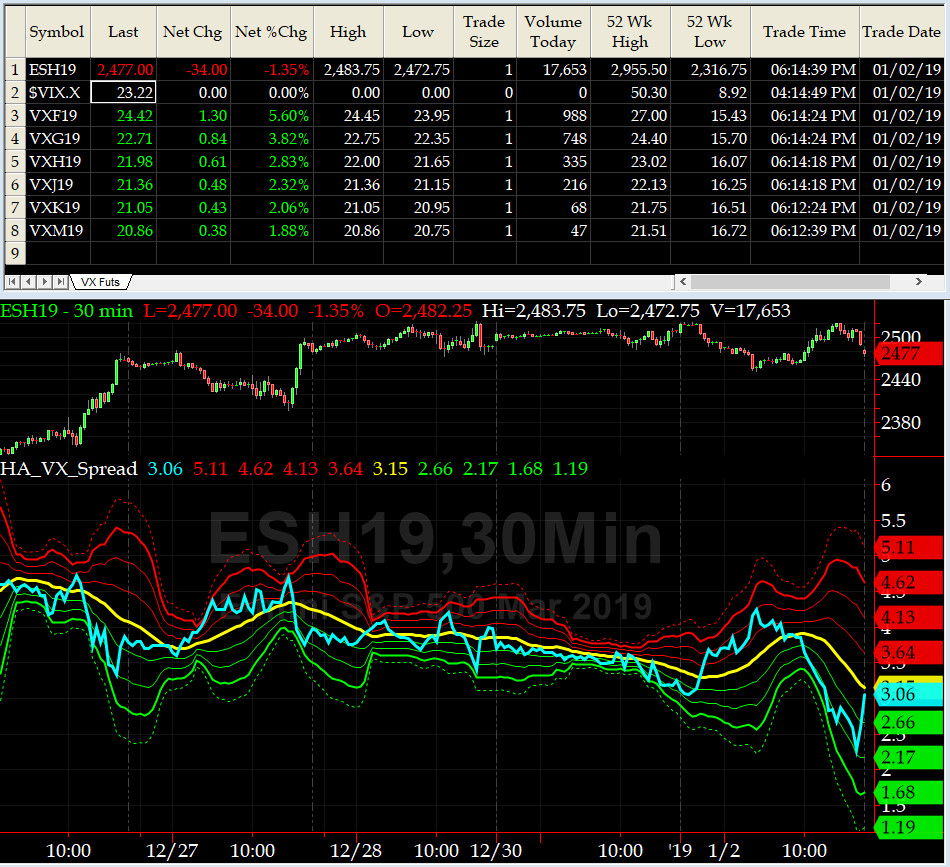
3-month VIX Futures Spread(VX) Chart
This popular timing indicator, (long JAN19, & short APR19 VIX Futures) closed at +3.06 which says SPX is OVERSOLD.
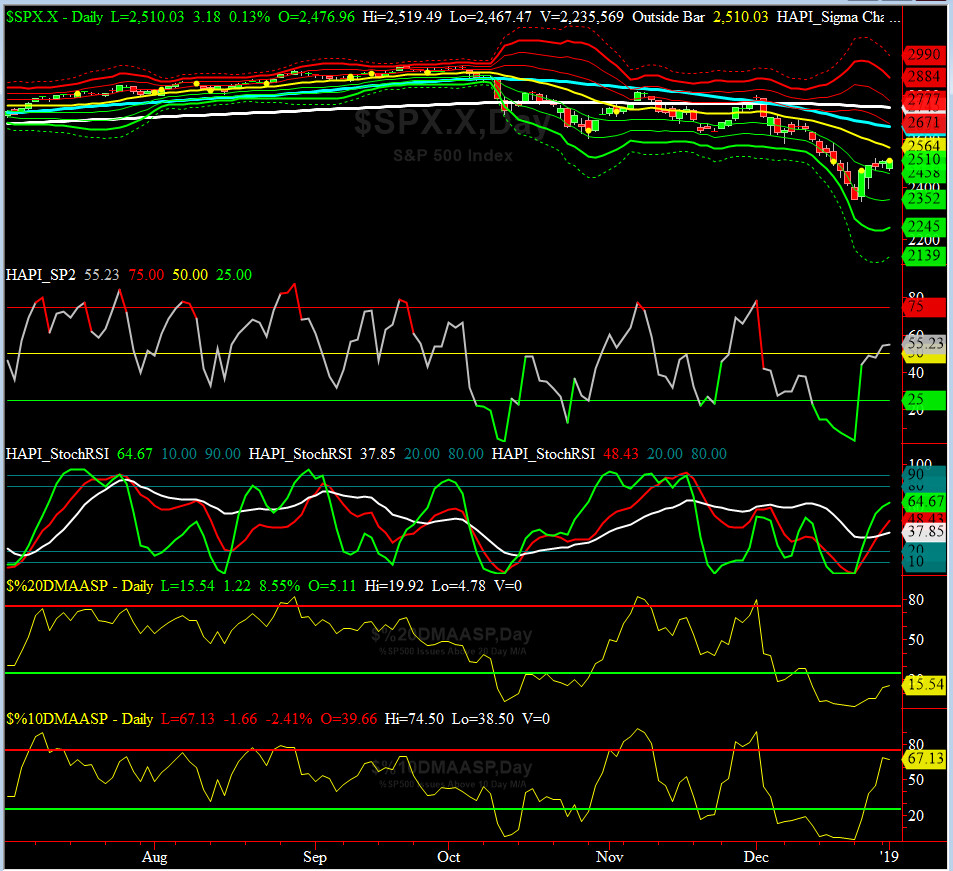
HA_SP2 Chart
HA_SP2 = 55.2 (Buy signal <= 25, Sell Signal >= 75)
Our coveted SP2 prop indicator is in neutral zone.
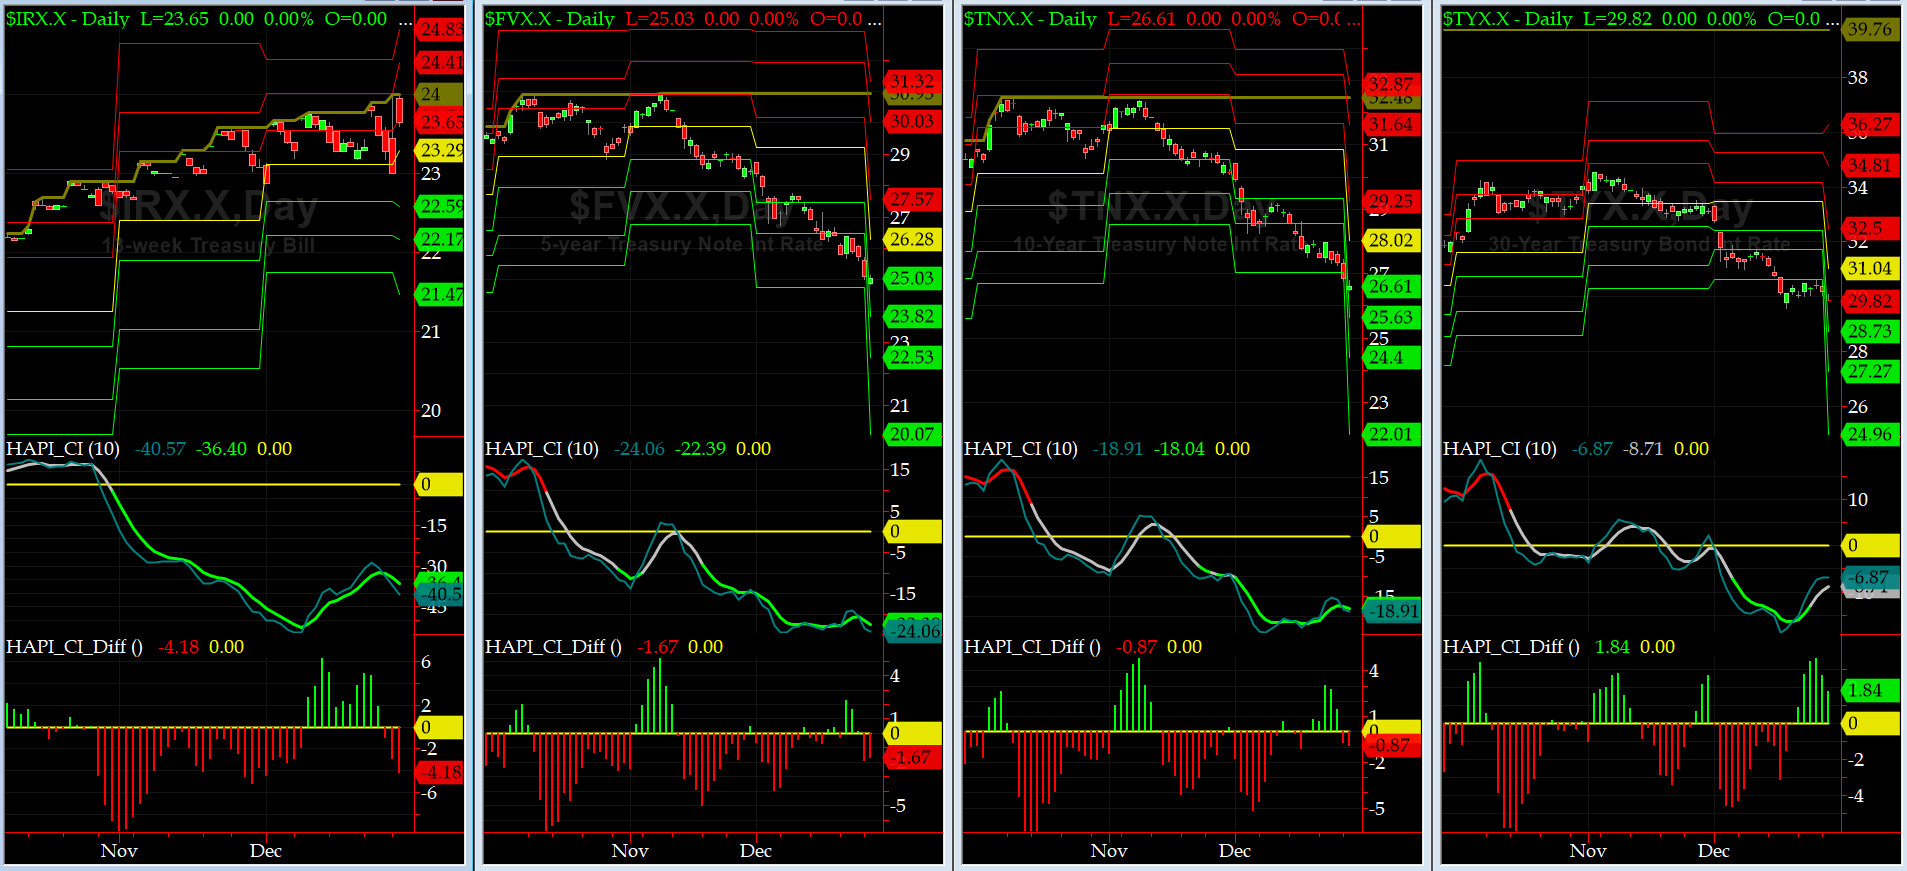
US Treasury T-Notes & T-Bonds Yields Chart
The YTMs continued to sink. Maury is very upset as he had to adjust his vig downward!!
Fari Hamzei
|


 Proactive Market Timing