|
Monday, January 21, 2019, 1900ET
Market Timing Charts, Analysis & Commentary for Issue #276
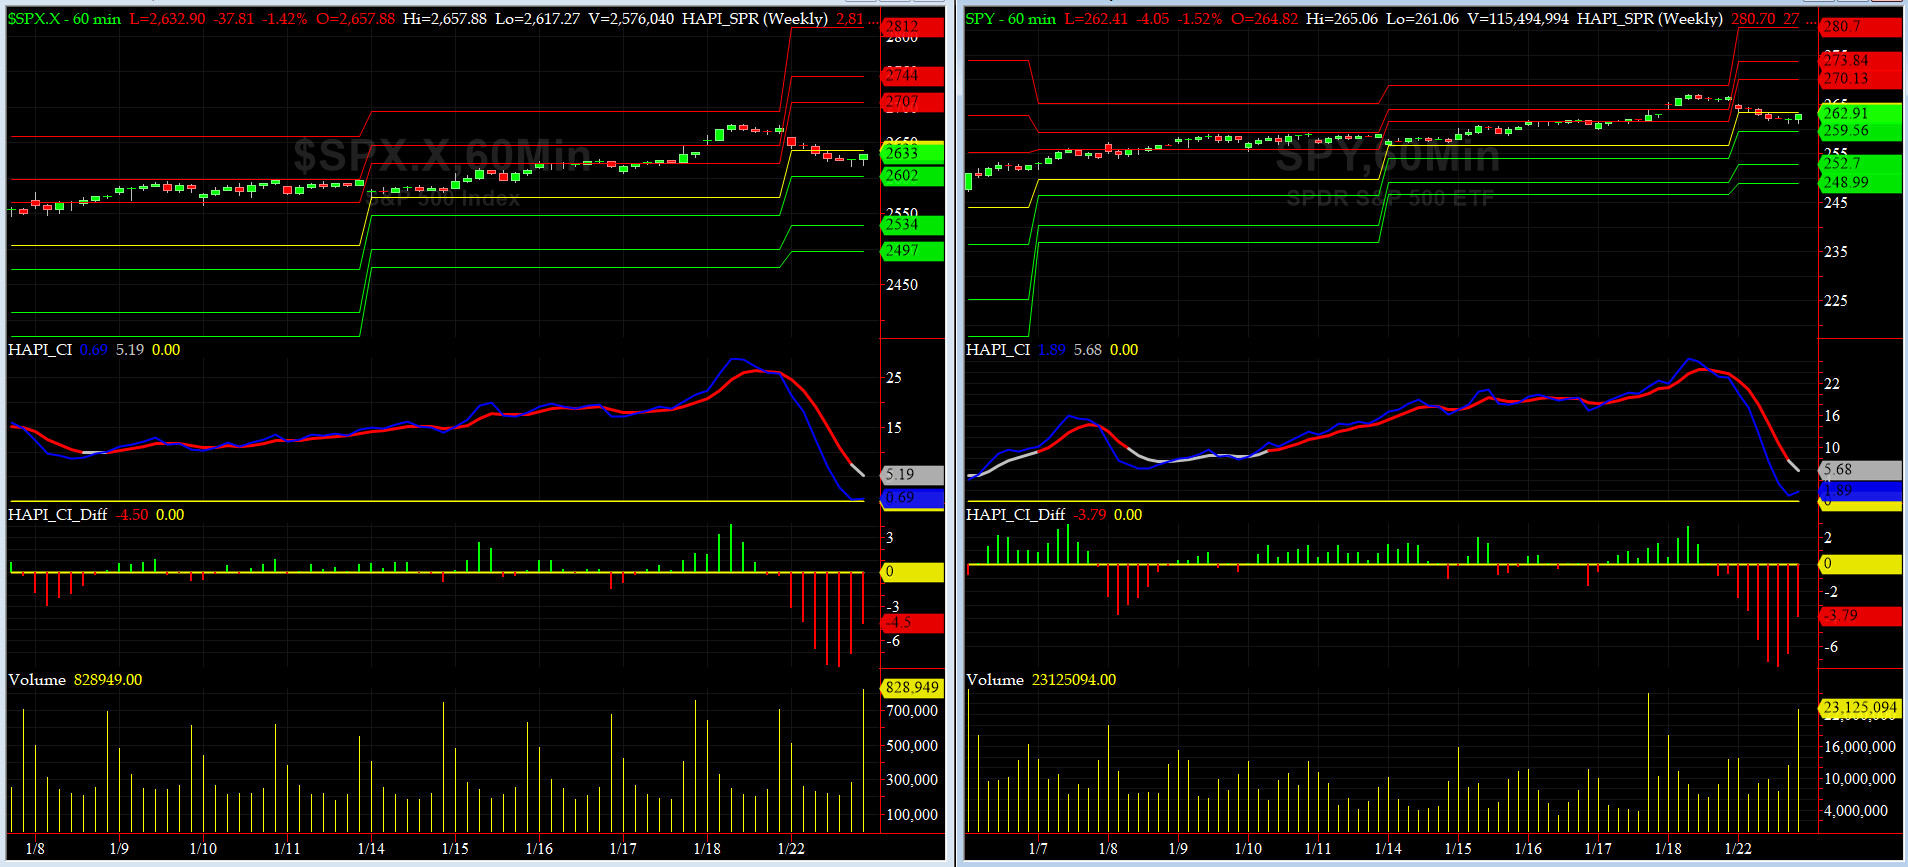
Timer Charts of S&P-500 Cash Index (SPX) + NASDAQ-100 Cash Index (NDX)
Most recent S&P-500 Cash Index (SPX): 2670 up +75 (up +2.9%) for the week ending on Friday, January 18, 2019, which closed about its +1.5 sigma.
DJIA ALL TIME INTRADAY HIGH = 26951 (reached on Wednesday, October 3, 2018)
DJ TRAN ALL TIME INTRADAY HIGH = 11623 (reached on Friday, September 14, 2018)
SPX ALL TIME INTRADAY HIGH = 2941 (reached on Friday, September 21, 2018)
NDX ALL TIME INTRADAY HIGH = 7700 (reached on Thursday, October 1, 2018)
RUT ALL TIME INTRADAY HIGH = 1742 (reached on Friday, August 31, 2018)
Current DAILY +2 Sigma SPX = 2693 with WEEKLY +2 Sigma = 2999
Current DAILY 0 Sigma SPX = 2535 with WEEKLY 0 Sigma = 2713
Current DAILY -2 Sigma SPX = 2376 with WEEKLY -2 Sigma = 2427
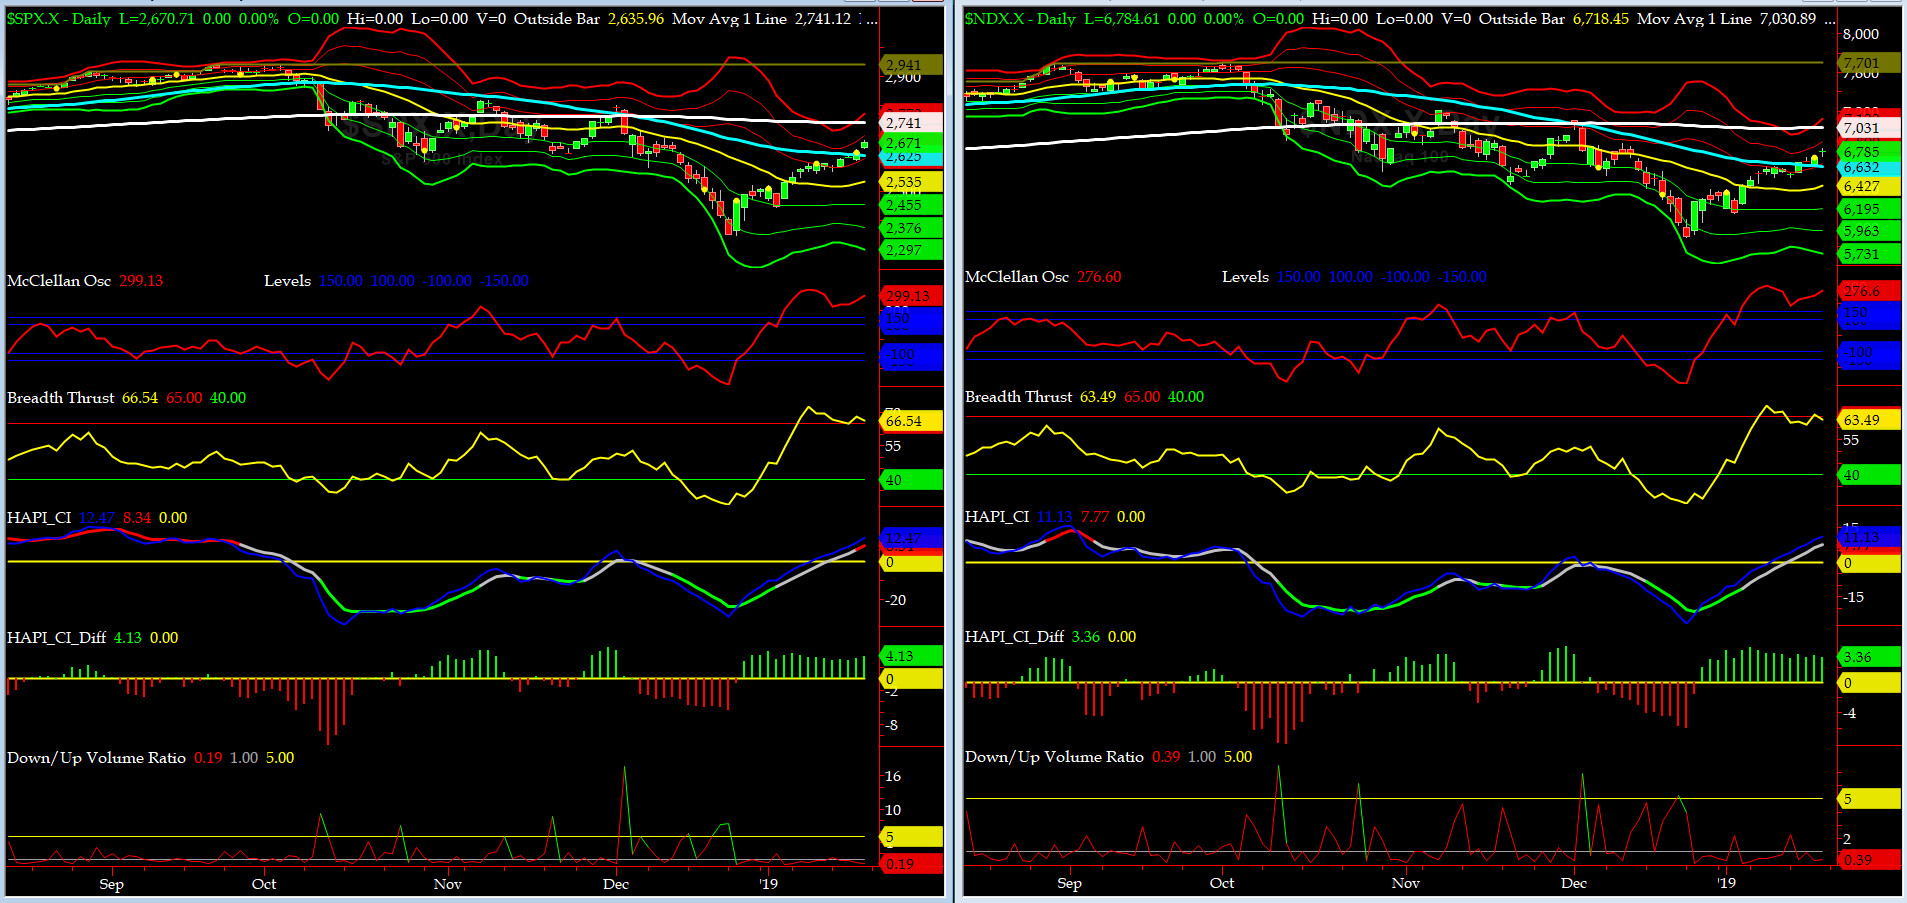
NYSE McClellan Oscillator = +299 (-150 is start of the O/S area; around -275 to -300 area or lower, we go into the �launch-pad� mode; over +150, we are in O/B area)
NYSE Breadth Thrust = 66.6 (40 is considered as oversold and 65 as overbought)
All short-term indicators continue to warn about a pull back but we keep on rallying. How long a market can defy the norms? who knows... it shall defy, till it does not.

Canaries [in the Coal Mine] Chart for DJ TRAN & RUT Indices
200-Day MA DJ TRAN = 10,586 or 5.4 ABOVE DJ TRAN (max observed in last 7 yrs = 20.2%, min = -20.3%)
200-Day MA RUT = 1592 or 6.9% ABOVE RUT (max observed in last 7 yrs = 21.3%, min = -22.6%)
DJ Transportation Index (proxy for economic conditions 6 to 9 months hence) had two great days last week and punched thru its 50Day MA.
Russell 2000 Small Caps Index (proxy for Risk ON/OFF) rose four days in a row and closed above its 50Day MA. RISK is creeping back in.

DeTrenders Charts for SPX, NDX, TRAN & RUT Indices
50-Day MA SPX = 2625 or 1.7% BELOW SPX (max observed in last 7 yrs = +8.6%, min = -9.3%)
200-Day MA SPX = 2741 or 2.6% ABOVE SPX (max observed in last 7 yrs = 15.2%, min = -14%)
Four out of EIGHT of our DeTrenders (all 50DTs) are now in the NEGATIVE territory. The DeTrenders for DJ Tran & RUT will continue to be harbingers of future price behavior in broad indices.
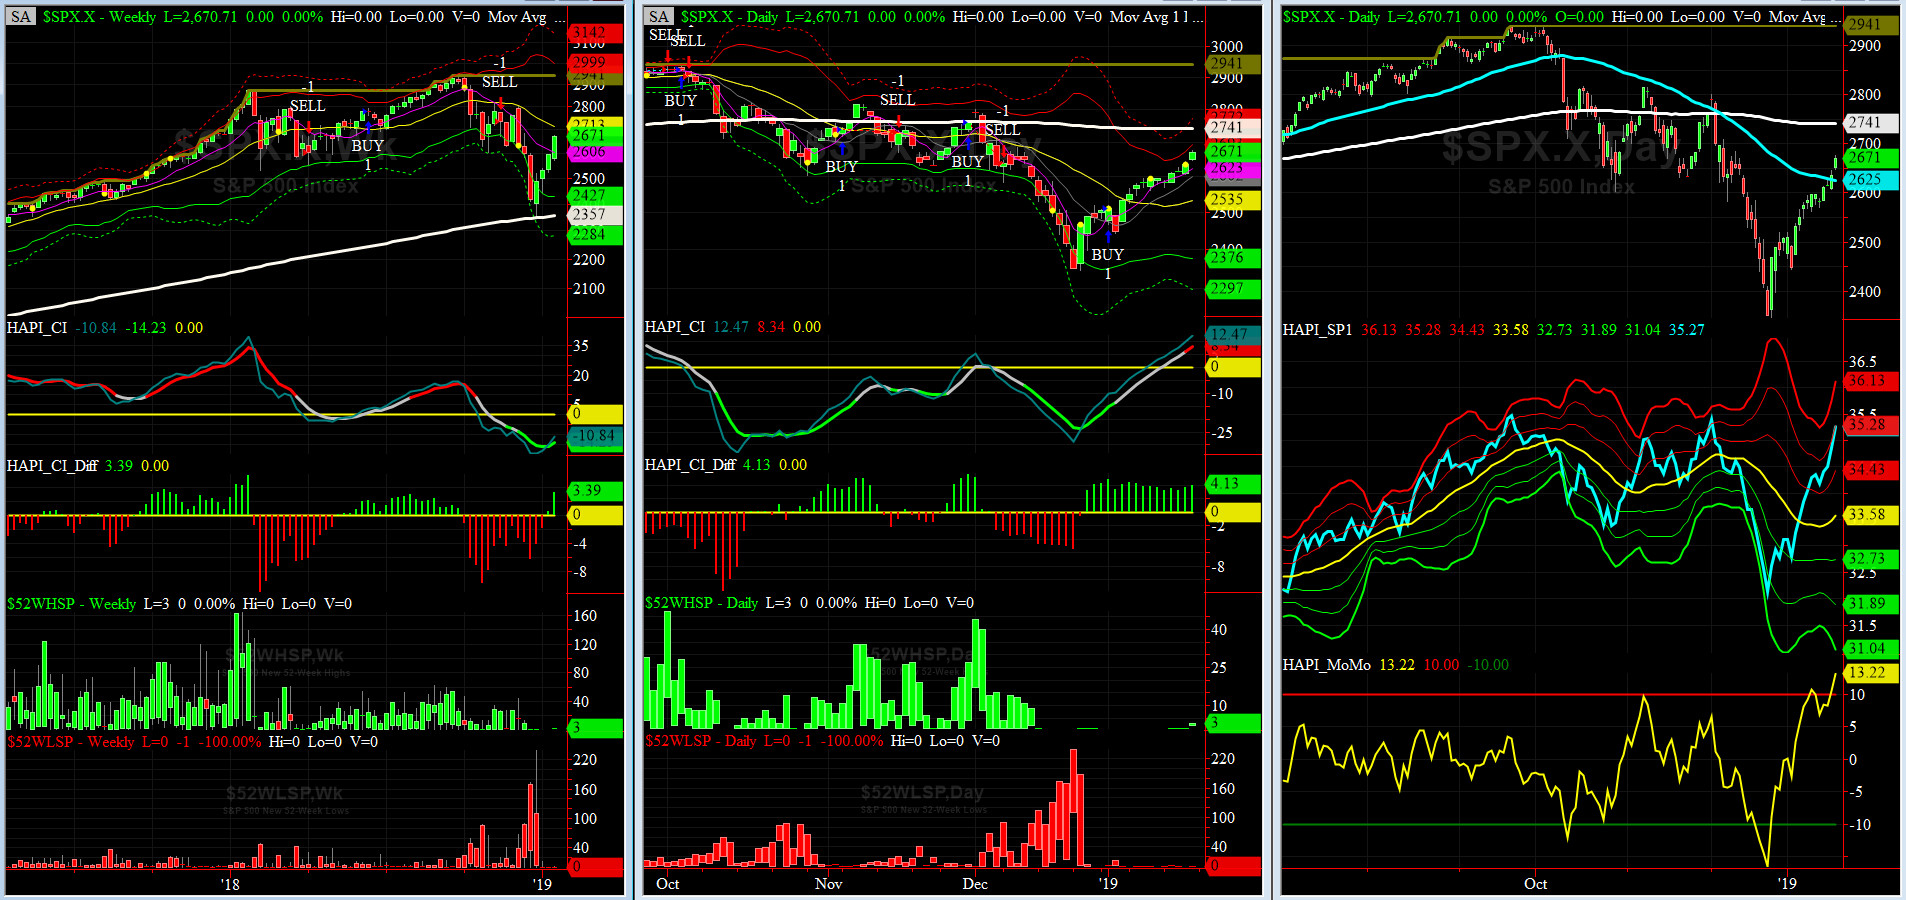
HA_SP1_Momo Chart
WEEKLY Timing Model = on a SELL Signal since Friday, November 16, 2018 CLOSE at 2736
DAILY Timing Model = on a BUY Signal since Wednesday, January 2, 2019 CLOSE at 2510
Max SPX 52wk-highs reading last week = N/A (over 120-140, the local maxima is in)
Max SPX 52wk-Lows reading last week = N/A (over 40-60, the local minima is in)
HA_SP1 closed near its +2 sigma channels
HA_Momo = +13.22 (reversals most likely occur above +10 or below -10)
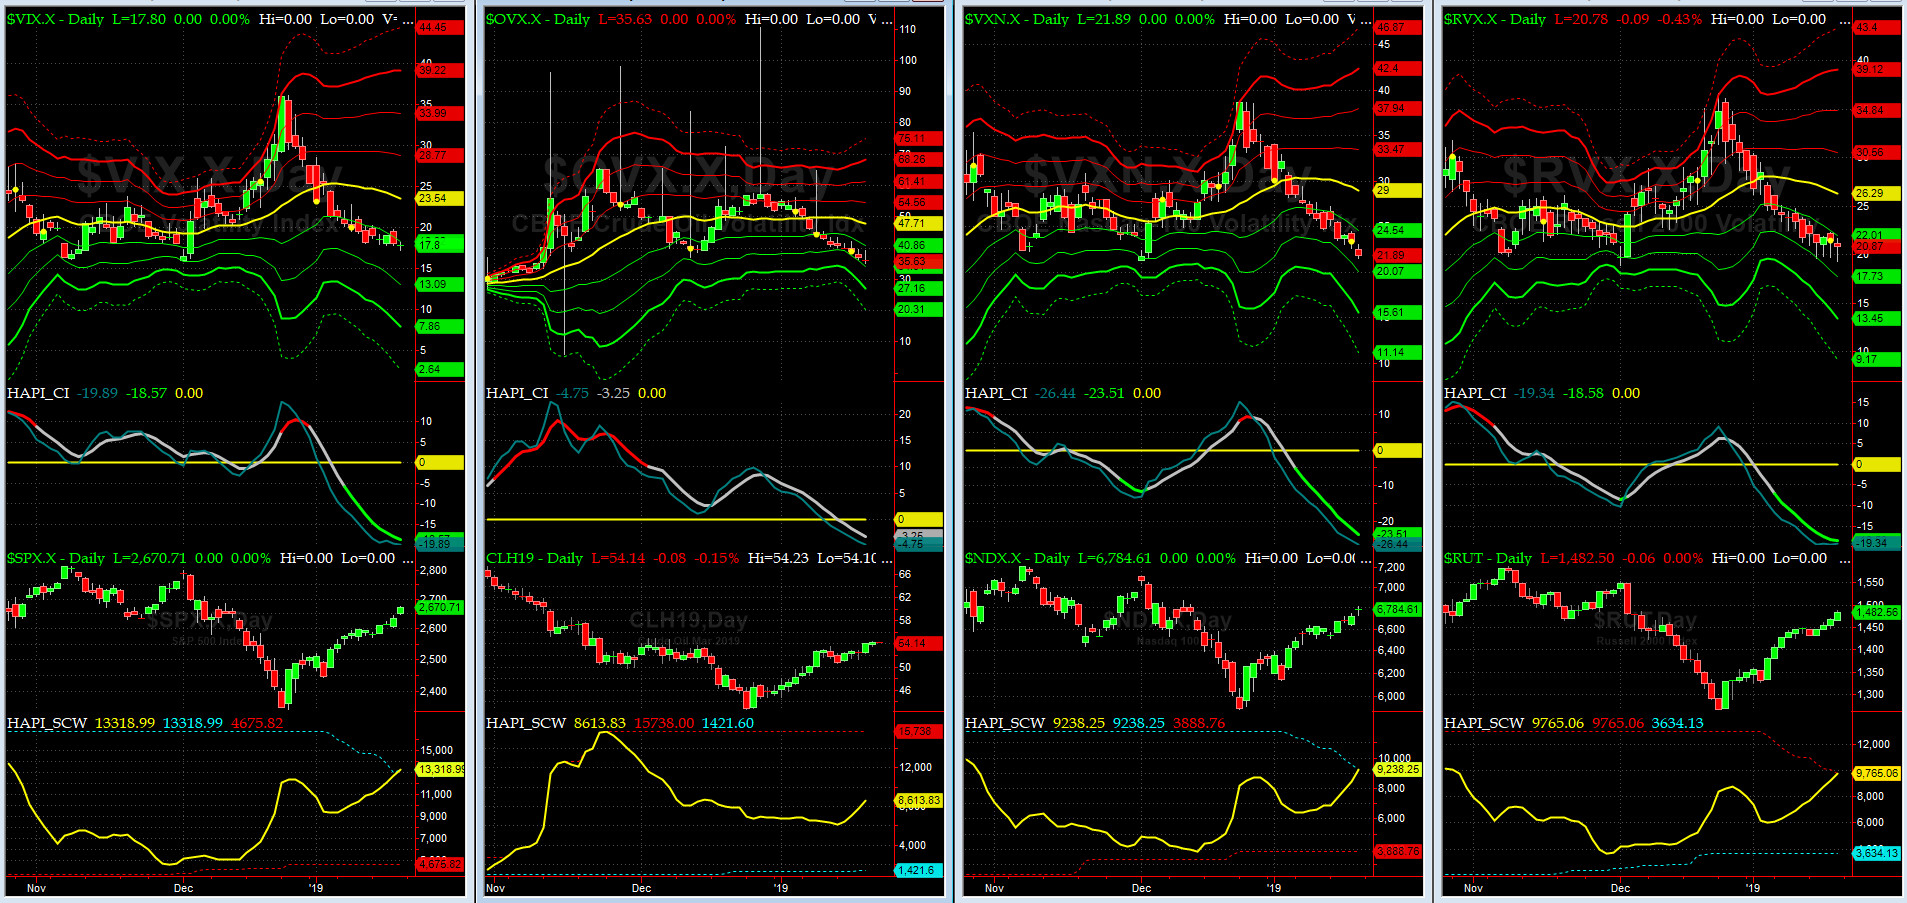
Vol of the Vols Chart
Spot VIX currently stands at 17.8, at about its -1 sigma (remember it's the VIX volatility pattern aka "its sigma channels" that matters, and not the level of VIX itself (this is per Dr. Robert Whaley, a great mentor and inventor of original VIX, now called VXO). VIX usually peaks around a test of its +4 sigma).
VIX continued to retreat very slowly this past week.
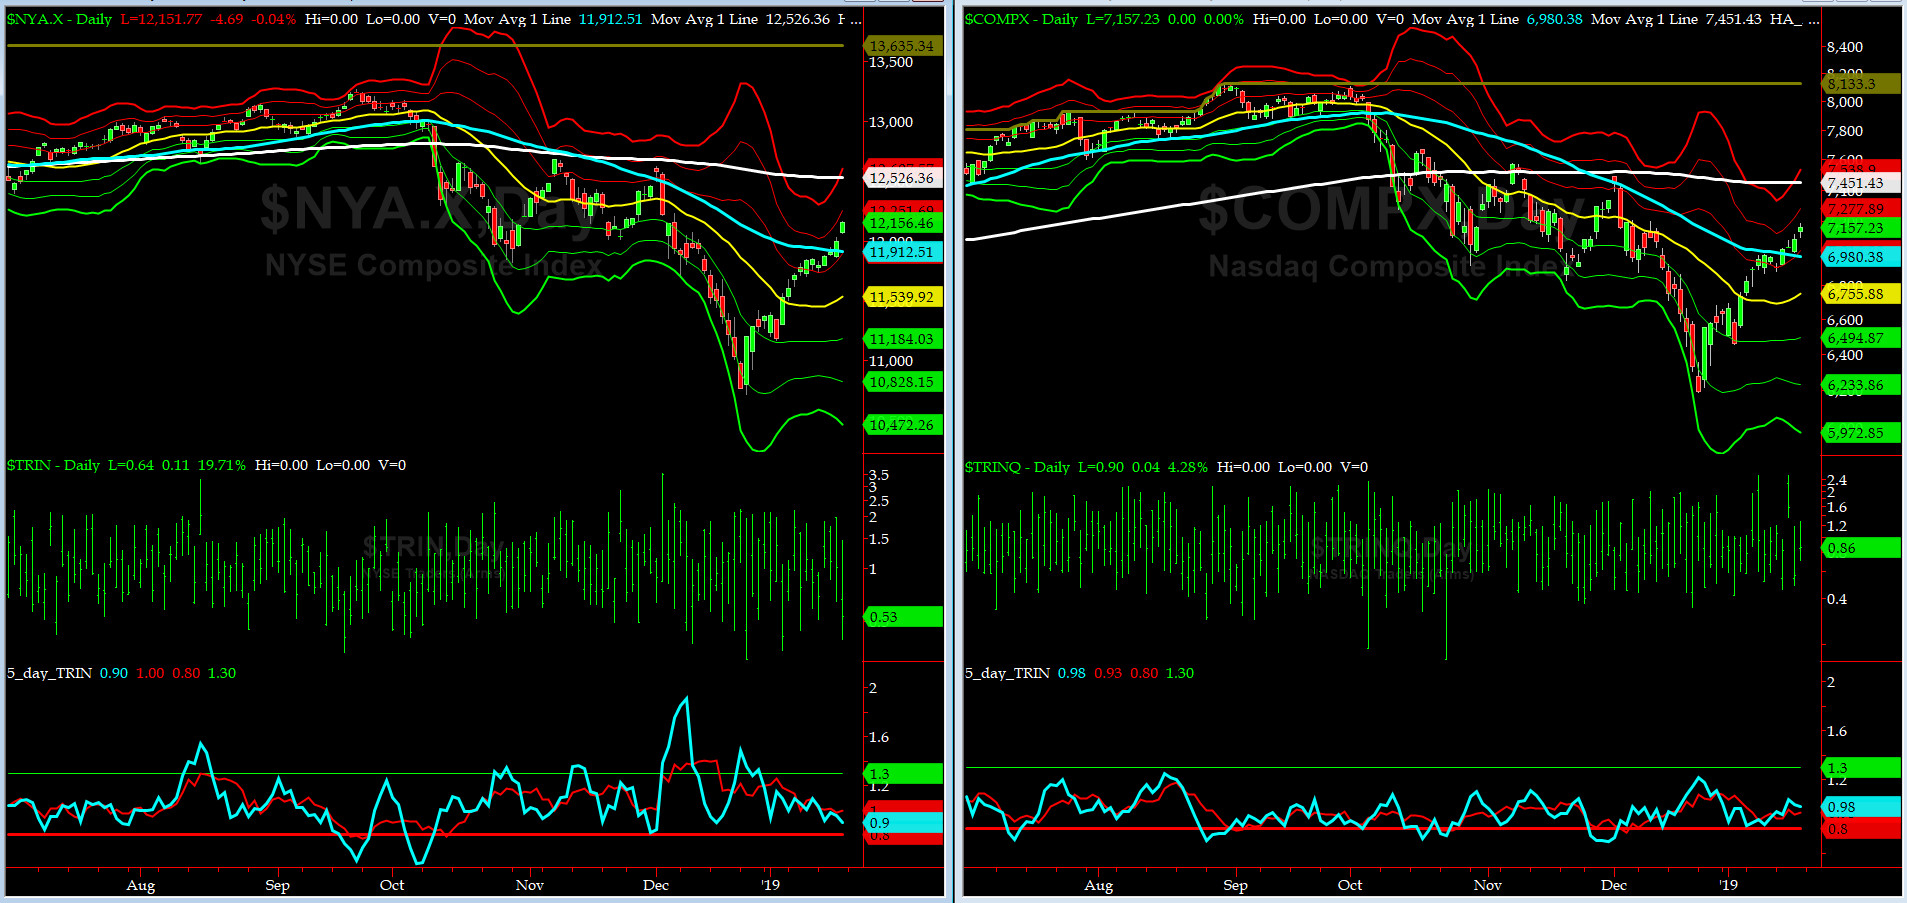
5-day TRIN & TRINQ Charts
Both NYSE & NASDAQ 5-day TRINs continue to be in NEUTRAL zones. No signal here.
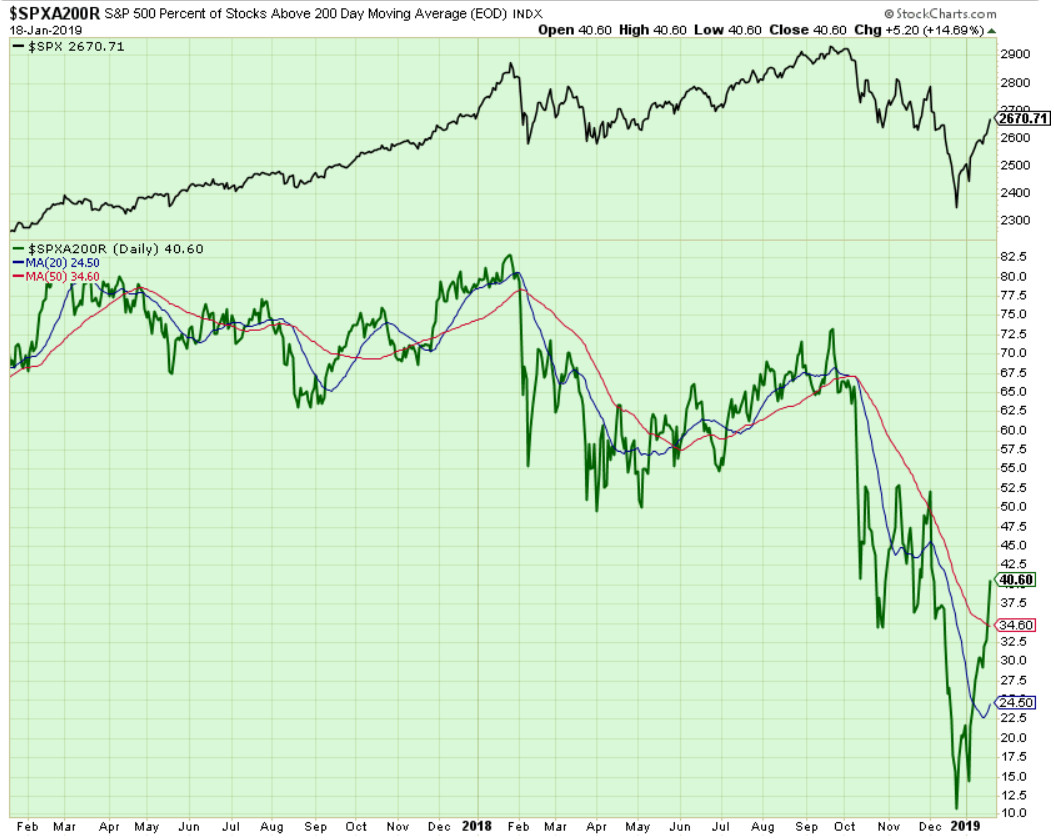
Components of SPX above their respective 200day MA Chart
This scoring indicator rallied to 40.6% area. This was a strong move passing thru 35% (its 50day MA).
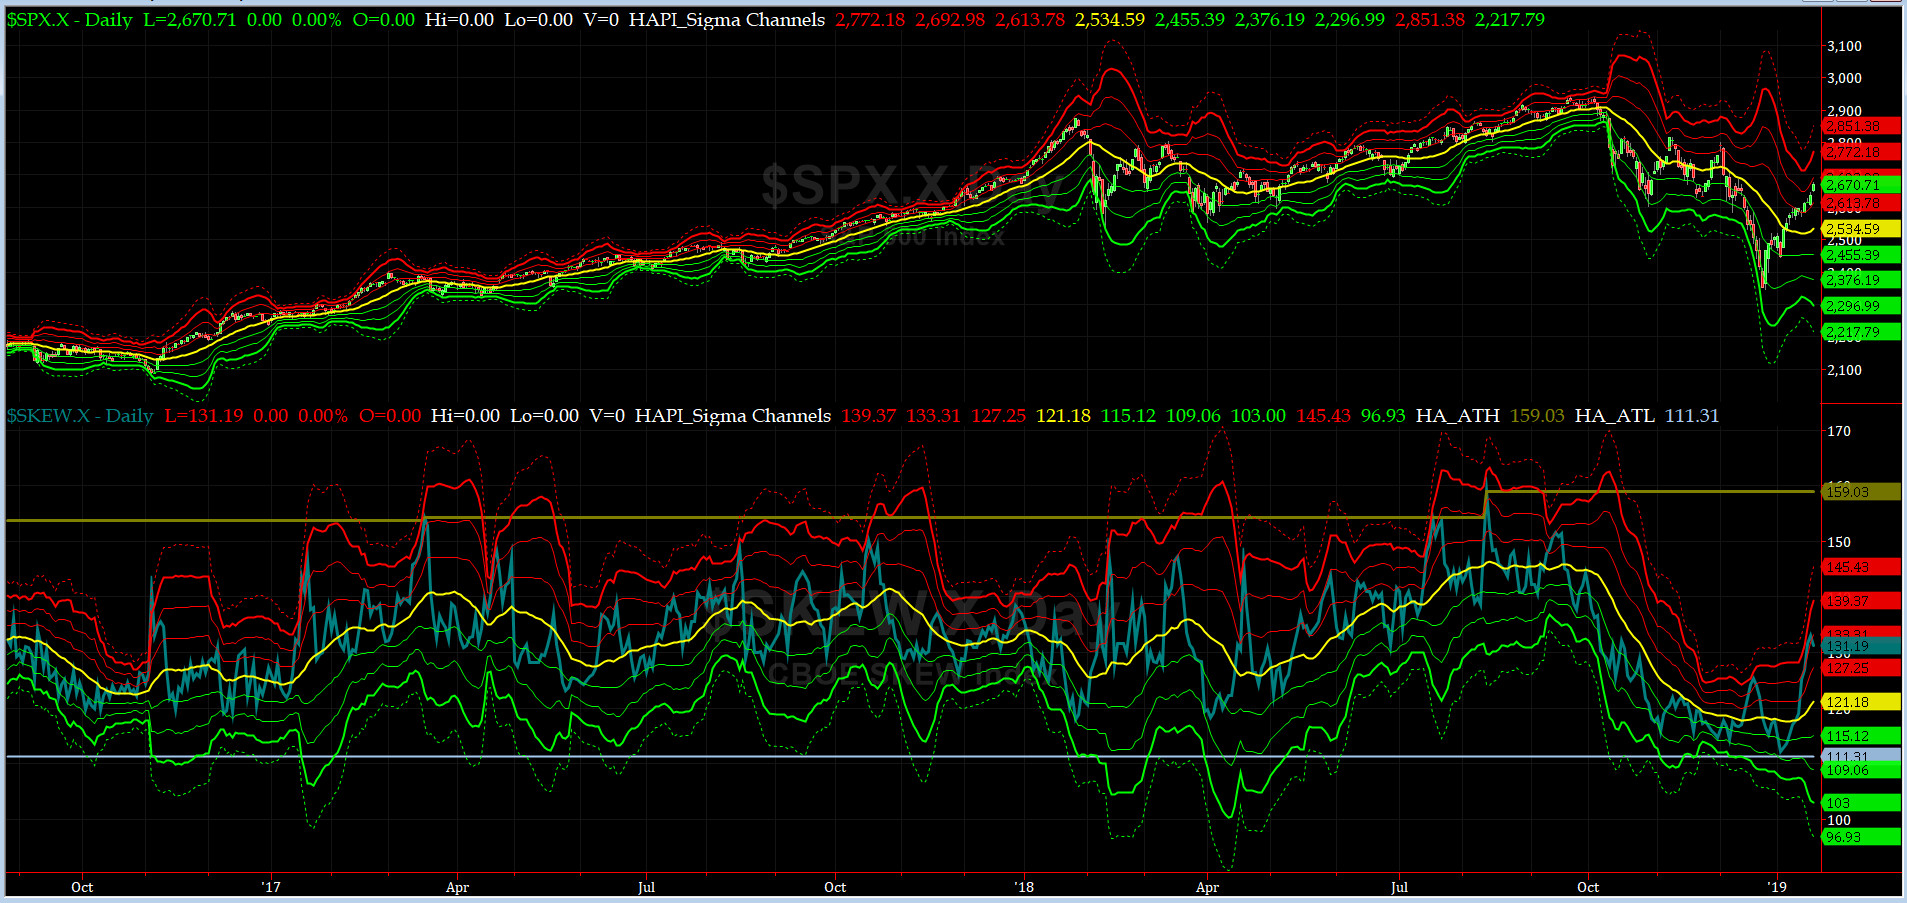
SPX SKEW (Tail Risk) Chart
On Friday, SPX SKEW (Tail Risk) closed near 131.2, still about its +2 sigma (normal = 120-125, range 100-150).
All quiet on the Eastern & Mid-Western Fronts, again? YES, (for now)....
How to interpret the value of SPX SKEW? (from CBOE white paper on SKEW)

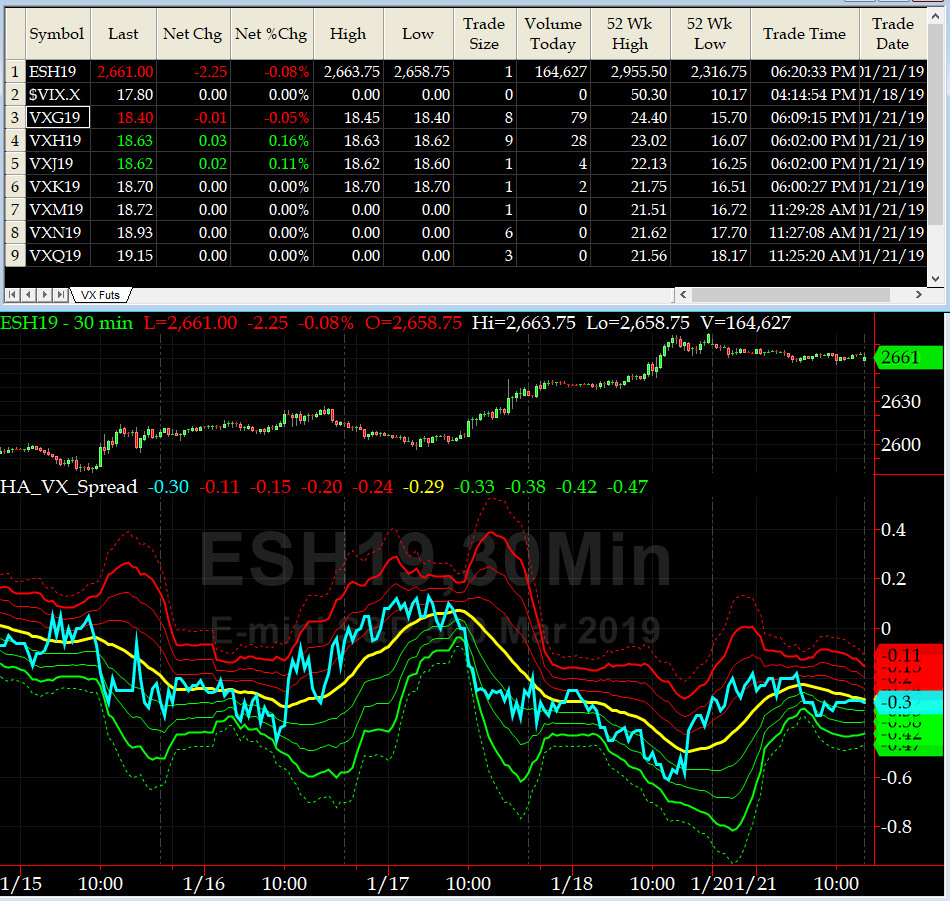
3-month VIX Futures Spread(VX) Chart
This popular timing indicator, (now long FEB19, & short MAY19 VIX Futures) closed at -0.3 which says SPX is in NEUTRAL.
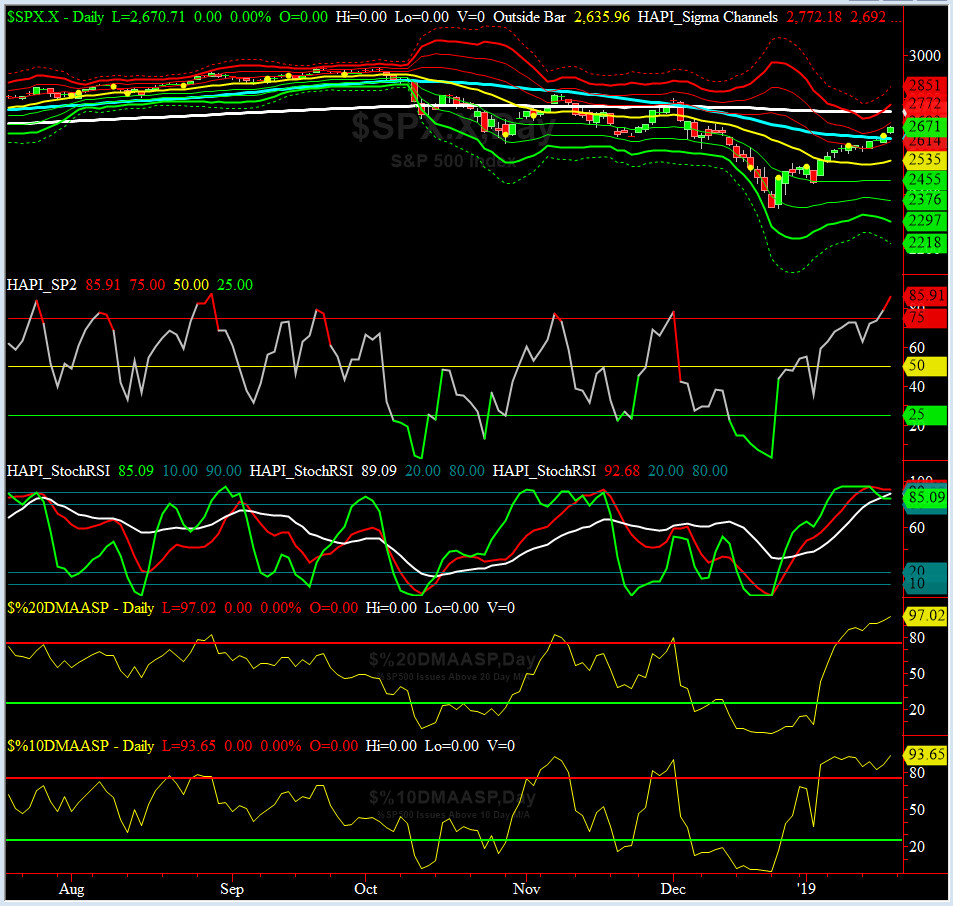
HA_SP2 Chart
HA_SP2 = 85.9 (Buy signal <= 25, Sell Signal >= 75)
Our coveted SP2 prop indicator is now in the uber OVERBOUGHT zone. We expect a [mild] pullback any day now.
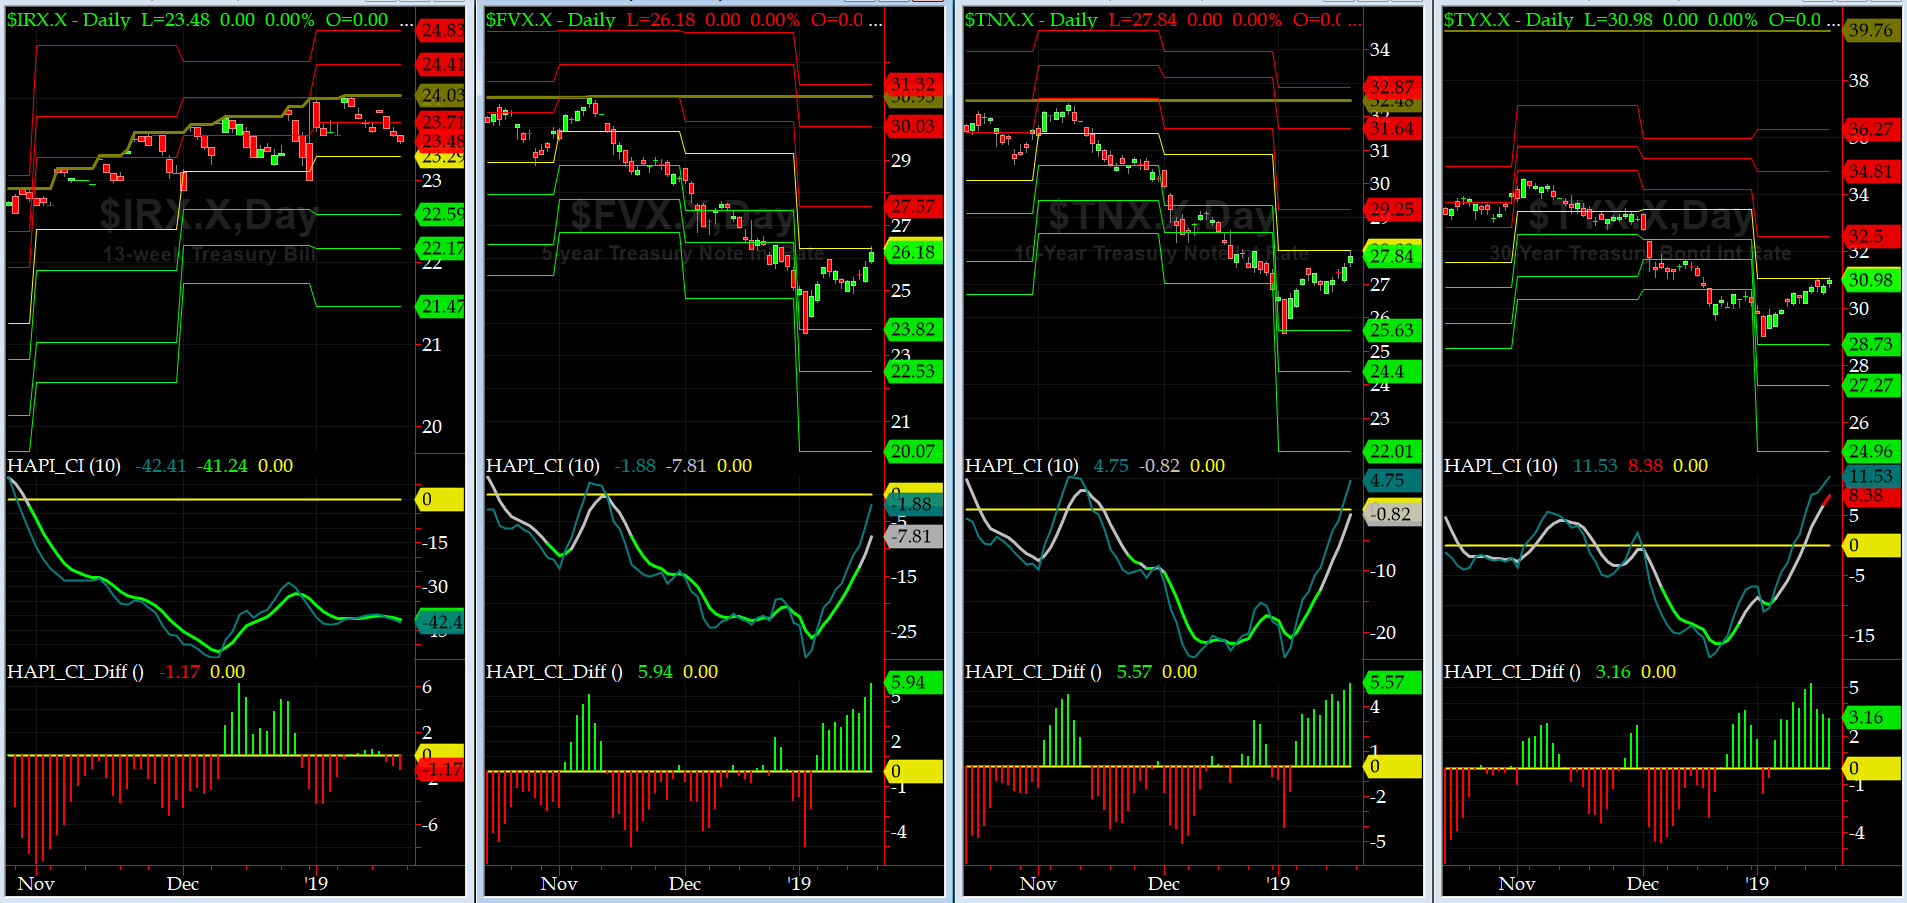
US Treasury T-Notes & T-Bonds Yields Chart
This week the YTMs rallied a tad last week. Maury is LESS upset now.
Fari Hamzei
|


 Proactive Market Timing