|
Monday, February 25, 2019, 0945ET
Market Timing Charts, Analysis & Commentary for Issue #281
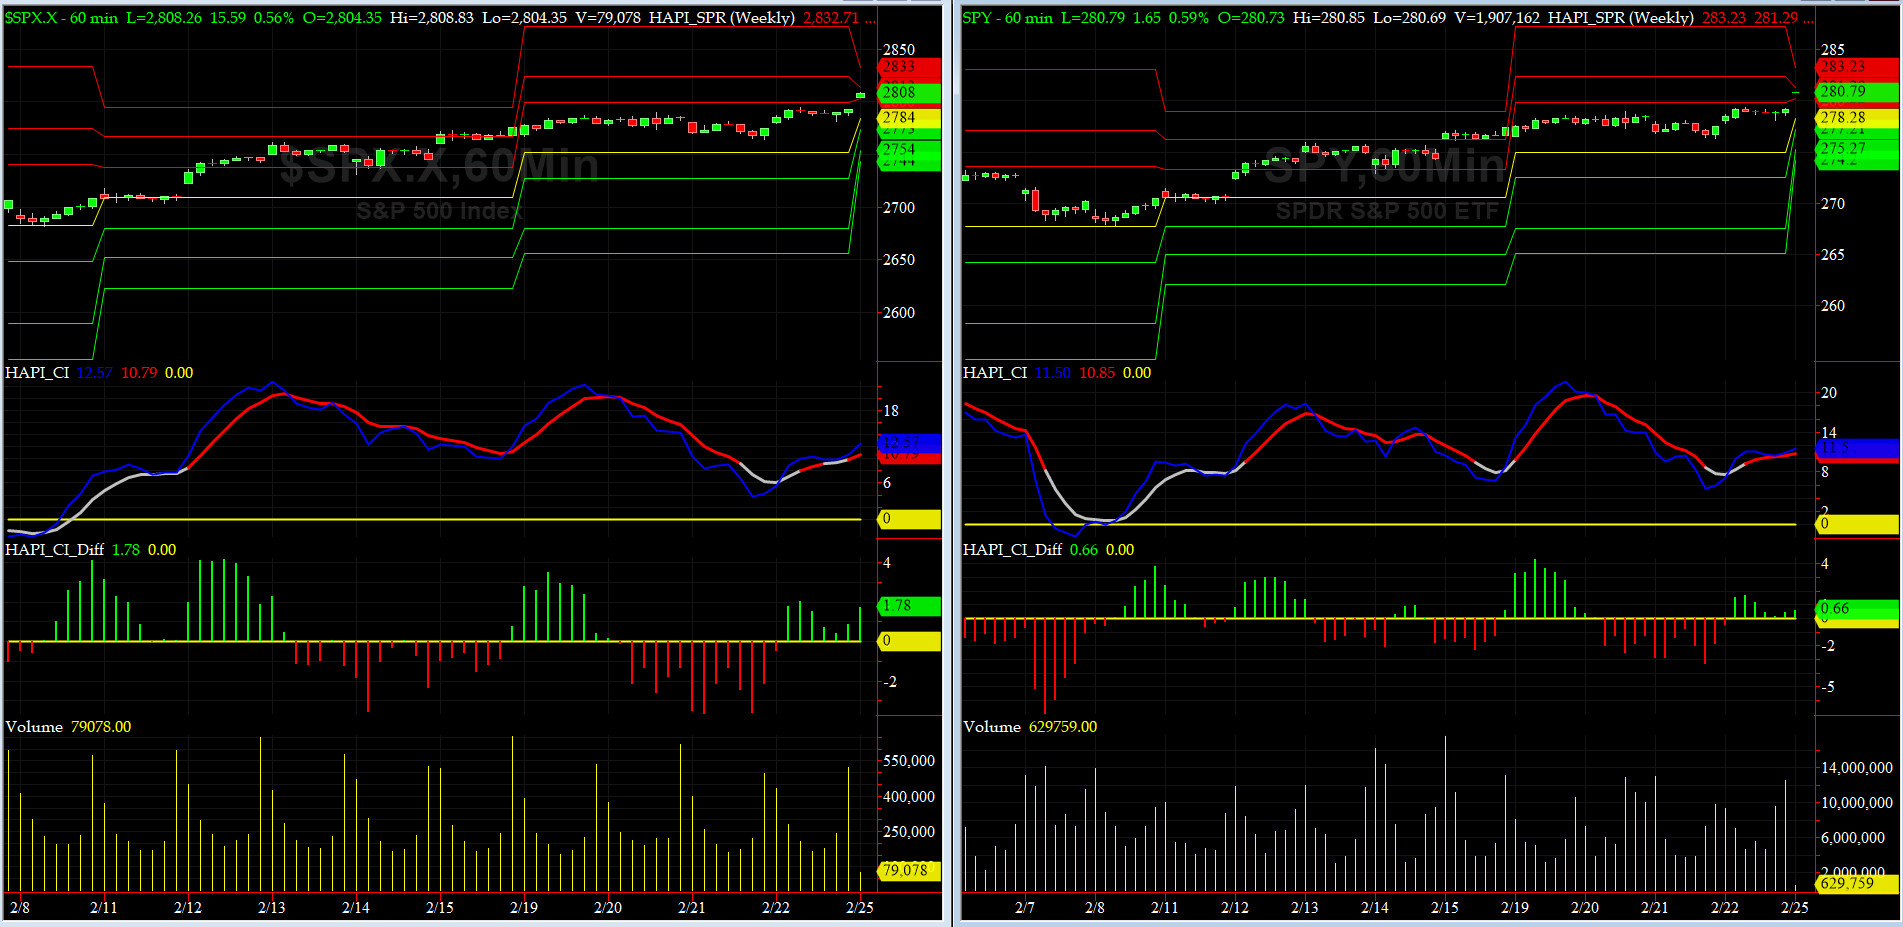
Timer Charts of S&P-500 Cash Index (SPX) + NASDAQ-100 Cash Index (NDX)
Most recent S&P-500 Cash Index (SPX): 2275 up +67 (up +2.47%) for the week ending on Friday, February 15, 2019, which closed above its +2 sigma.
DJIA ALL TIME INTRADAY HIGH = 26951 (reached on Wednesday, October 3, 2018)
DJ TRAN ALL TIME INTRADAY HIGH = 11623 (reached on Friday, September 14, 2018)
SPX ALL TIME INTRADAY HIGH = 2941 (reached on Friday, September 21, 2018)
NDX ALL TIME INTRADAY HIGH = 7700 (reached on Thursday, October 1, 2018)
RUT ALL TIME INTRADAY HIGH = 1742 (reached on Friday, August 31, 2018)
Current DAILY +2 Sigma SPX = 2784 with WEEKLY +2 Sigma = 2893
Current DAILY 0 Sigma SPX = 2698 with WEEKLY 0 Sigma = 2675
Current DAILY -2 Sigma SPX = 2613 with WEEKLY -2 Sigma = 2457
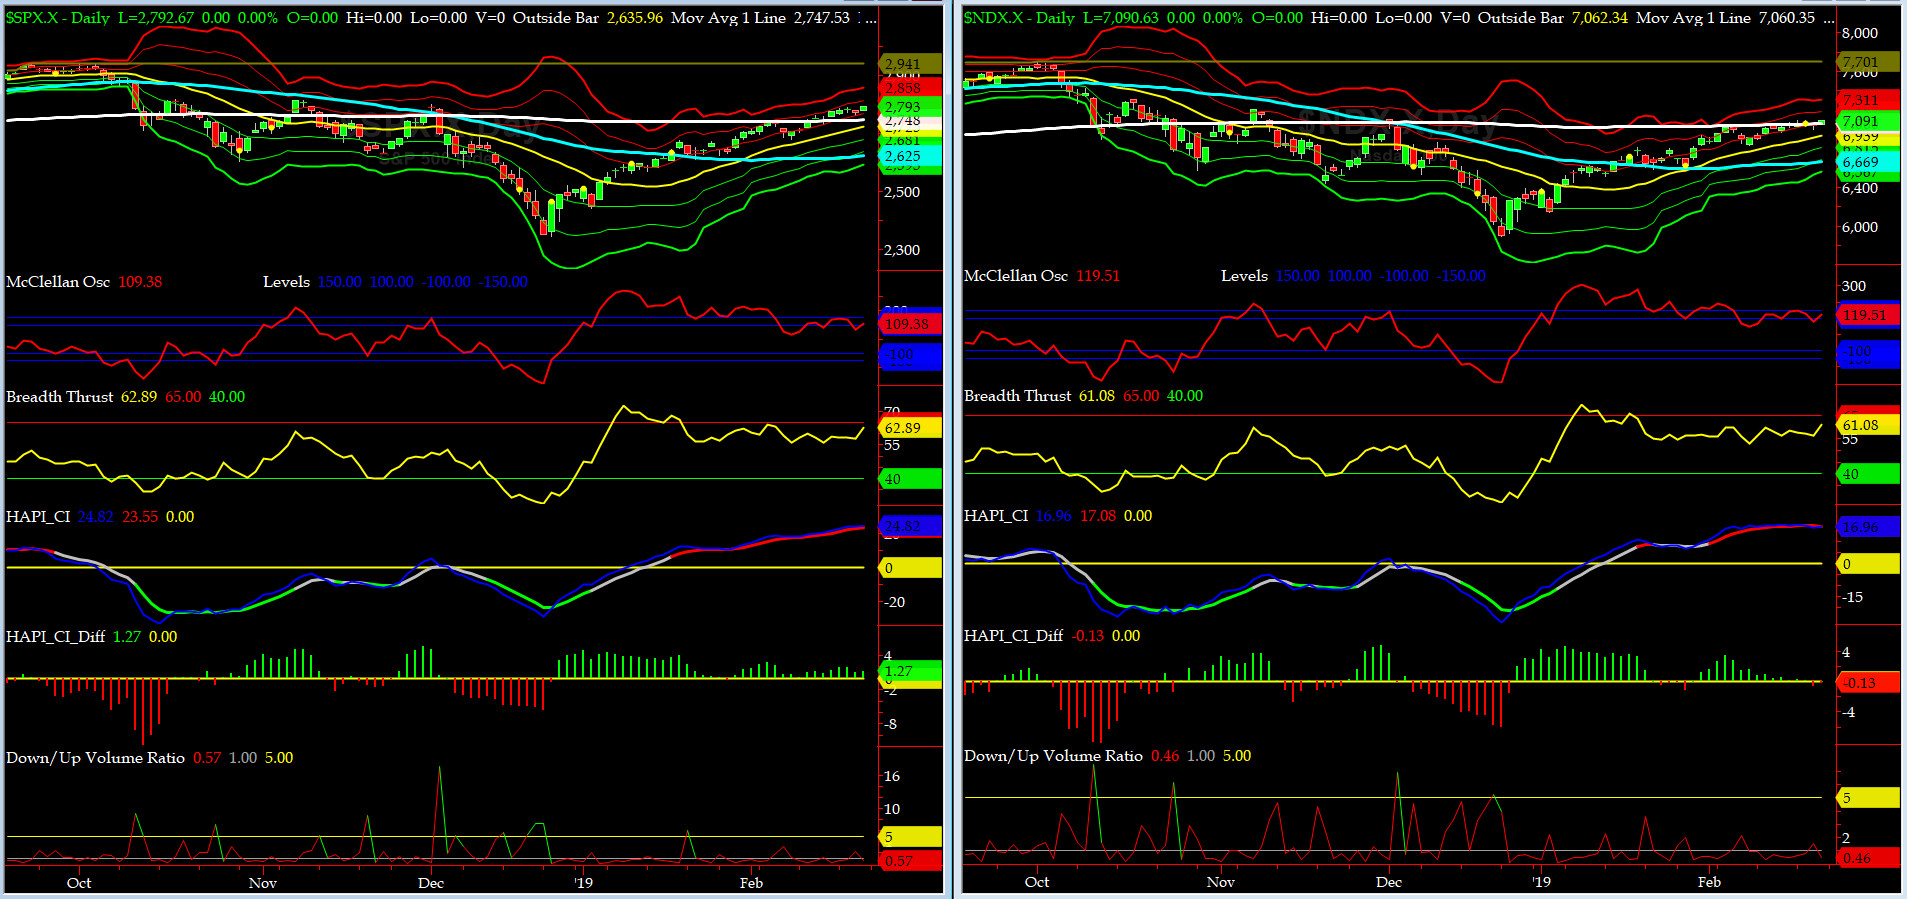
NYSE McClellan Oscillator = +139 (-150 is start of the O/S area; around -275 to -300 area or lower, we go into the �launch-pad� mode; over +150, we are in O/B area)
NYSE Breadth Thrust = 58.9 (40 is considered as oversold and 65 as overbought)
This past week, we saw more bearish divergences and yet we rallied further. How long this will go on? Who knows -- always trade what you see, not what you think.

Canaries [in the Coal Mine] Chart for DJ TRAN & RUT Indices
200-Day MA DJ TRAN = 10,559 or 0.1% ABOVE DJ TRAN (max observed in last 7 yrs = 20.2%, min = -20.3%)
200-Day MA RUT = 1587 or 1.1% ABOVE RUT (max observed in last 7 yrs = 21.3%, min = -22.6%)
DJ Transportation Index (proxy for economic conditions 6 to 9 months hence) rallied hard and closed above its 200-day MA.
Russell 2000 Small Caps Index (proxy for Risk ON/OFF) had a slower ascent and got very close to its 200-day MA but no cigar, yet. RISK is back ON.
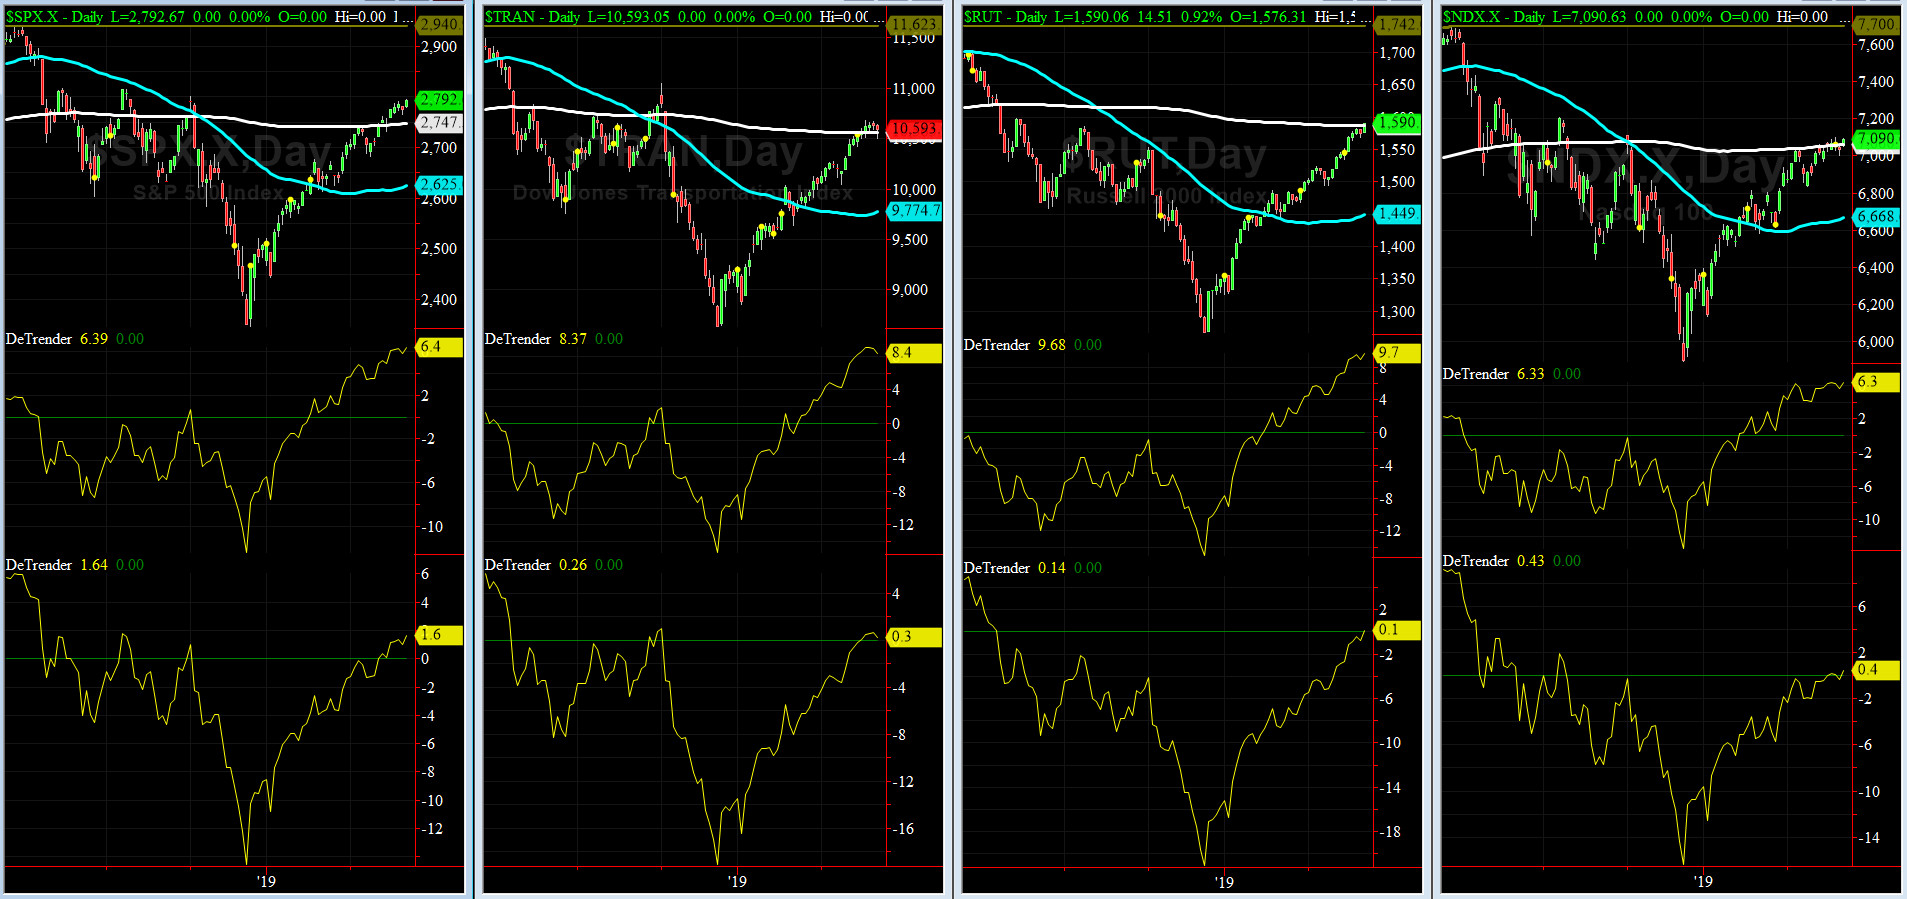
DeTrenders Charts for SPX, NDX, TRAN & RUT Indices
50-Day MA SPX = 2615 or 6.1% BELOW SPX (max observed in last 7 yrs = +8.6%, min = -9.3%)
200-Day MA SPX = 2744 or 1.1% BELOW SPX (max observed in last 7 yrs = 15.2%, min = -14%)
SEVEN out of EIGHT of our DeTrenders are now in the POSITIVE territory. The DeTrenders for DJ Tran & RUT will continue to be harbingers of future price behavior in broad indices.
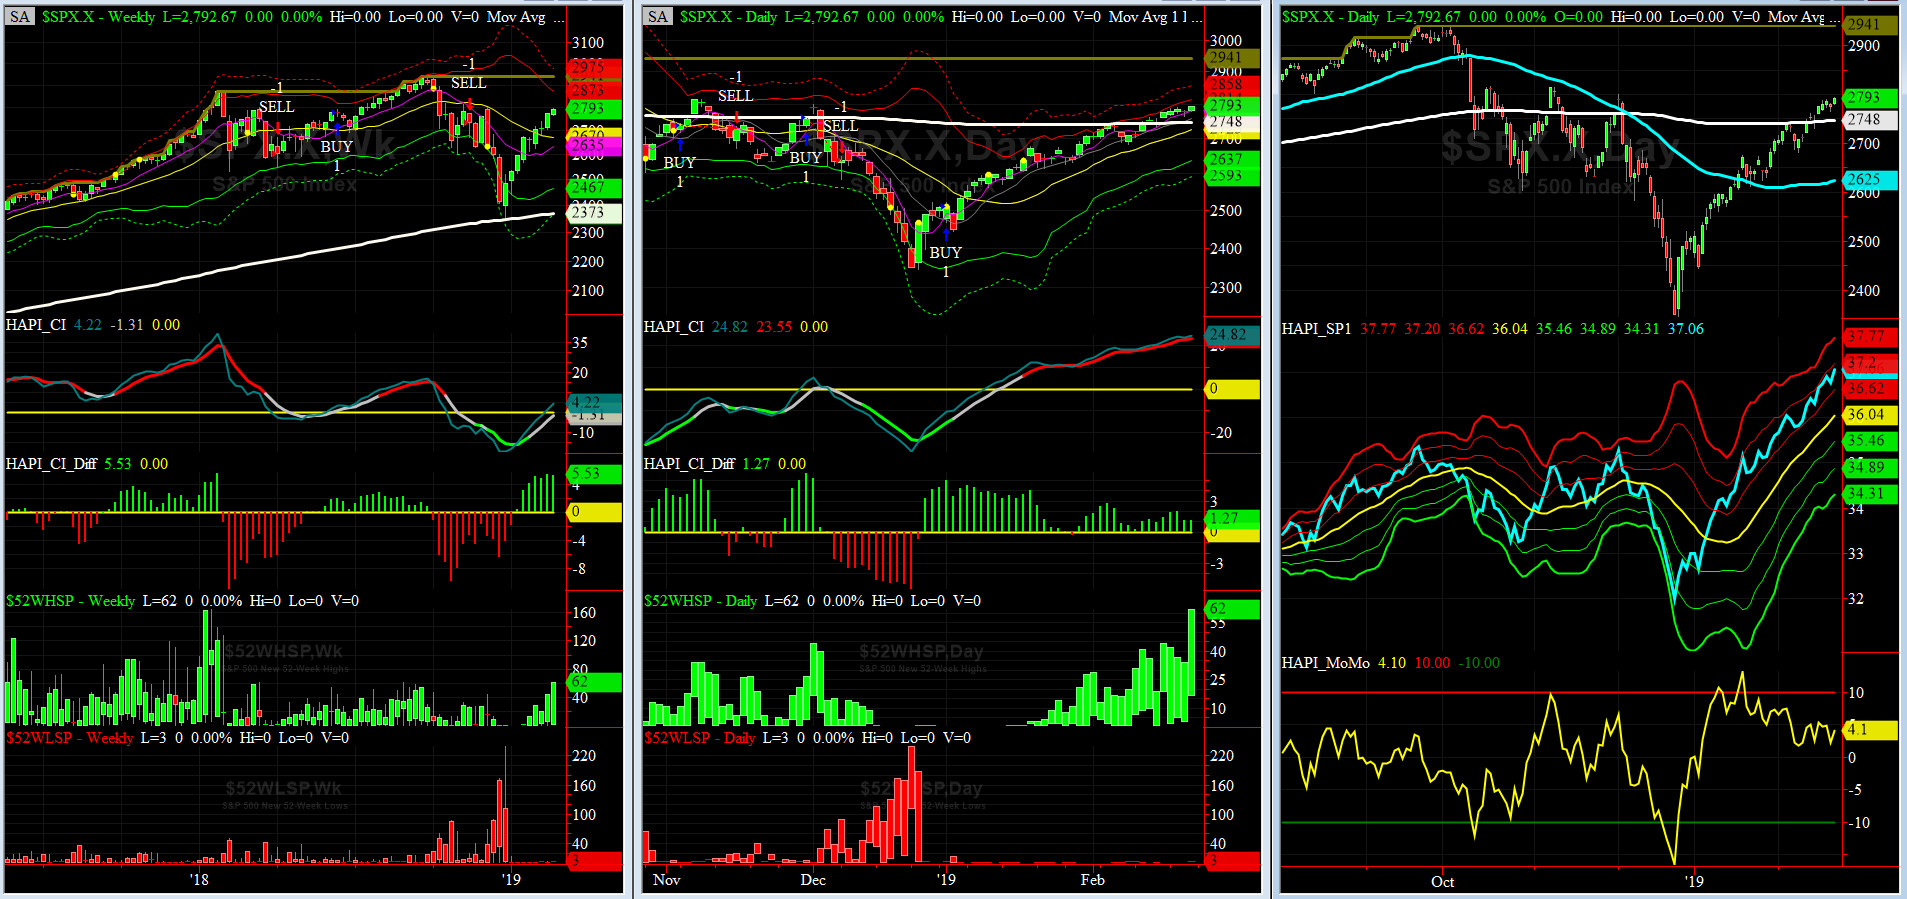
HA_SP1_Momo Chart
WEEKLY Timing Model = on a SELL Signal since Friday, November 16, 2018 CLOSE at 2736
DAILY Timing Model = on a BUY Signal since Wednesday, January 2, 2019 CLOSE at 2510
Max SPX 52wk-highs reading last week = 44 (over 120-140, the local maxima is in)
Max SPX 52wk-Lows reading last week = 1 (over 40-60, the local minima is in)
HA_SP1 closed near its +2 sigma channels
HA_Momo = +5.3 (reversals most likely occur above +10 or below -10)
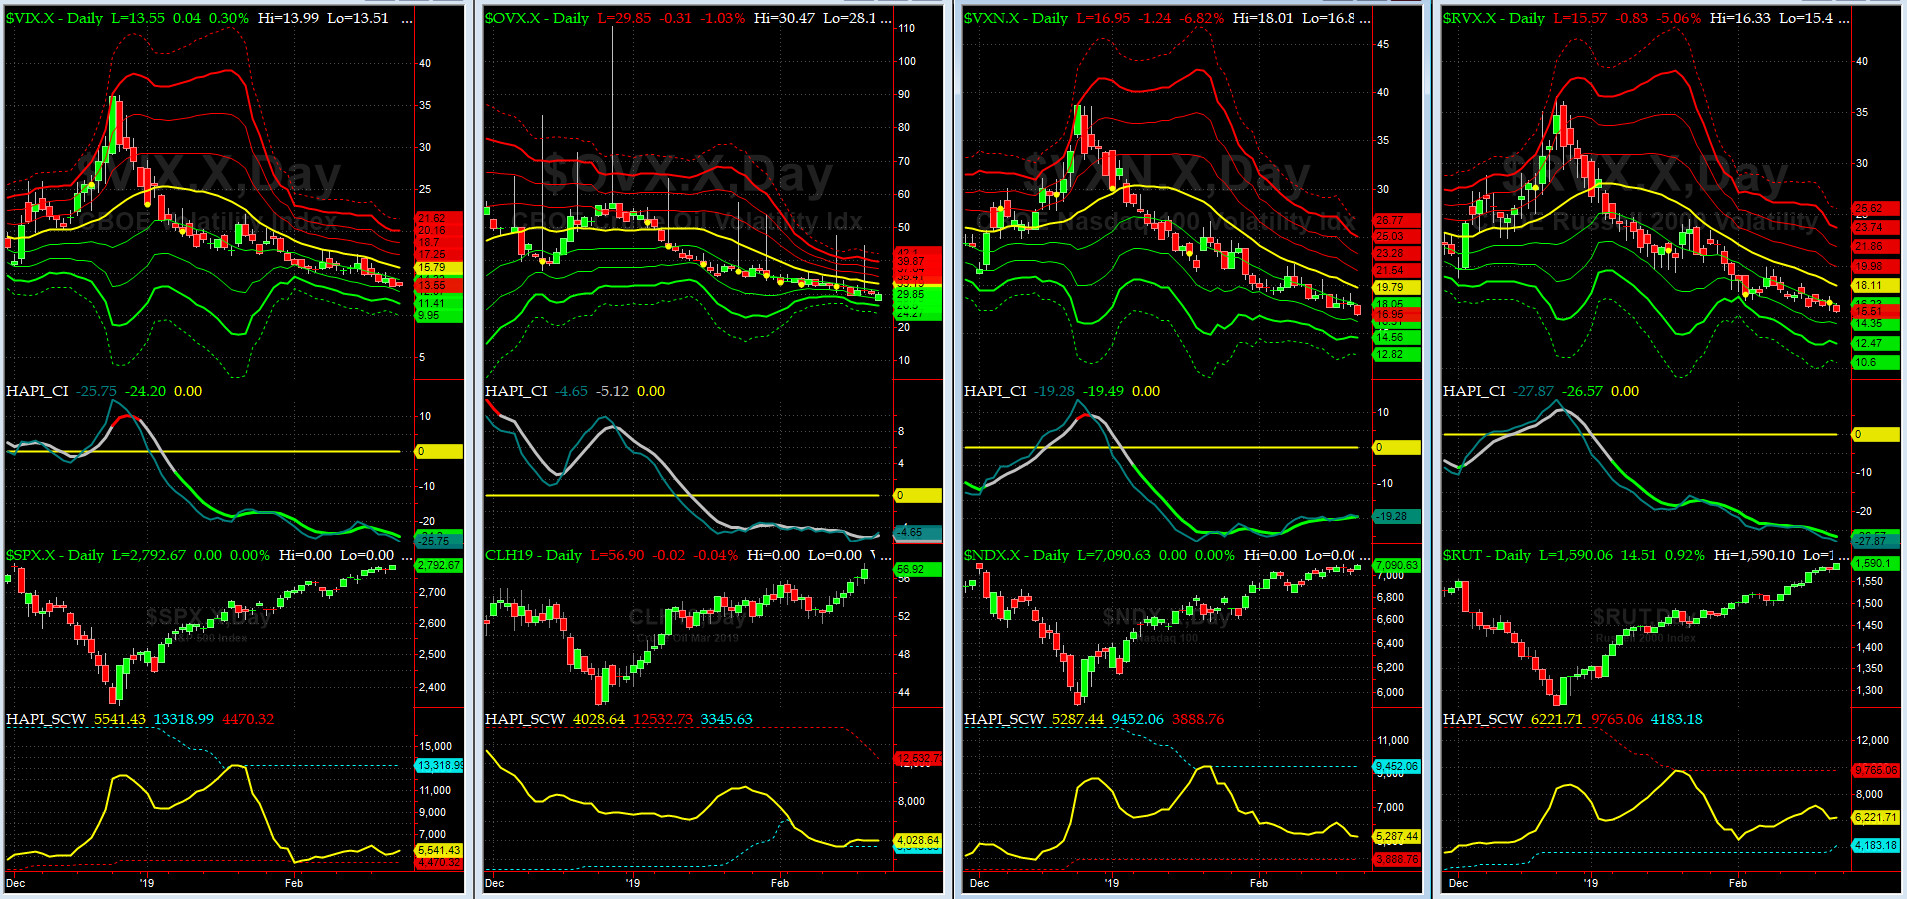
Vol of the Vols Chart
Spot VIX currently stands at 14.9, at about its -1 sigma (remember it's the VIX volatility pattern aka "its sigma channels" that matters, and not the level of VIX itself (this is per Dr. Robert Whaley, a great mentor and inventor of original VIX, now called VXO). VIX usually peaks around a test of its +4 sigma).
VIX sold off a tad last week, and, VXN (VIX for NASDAQ) remained mixed.
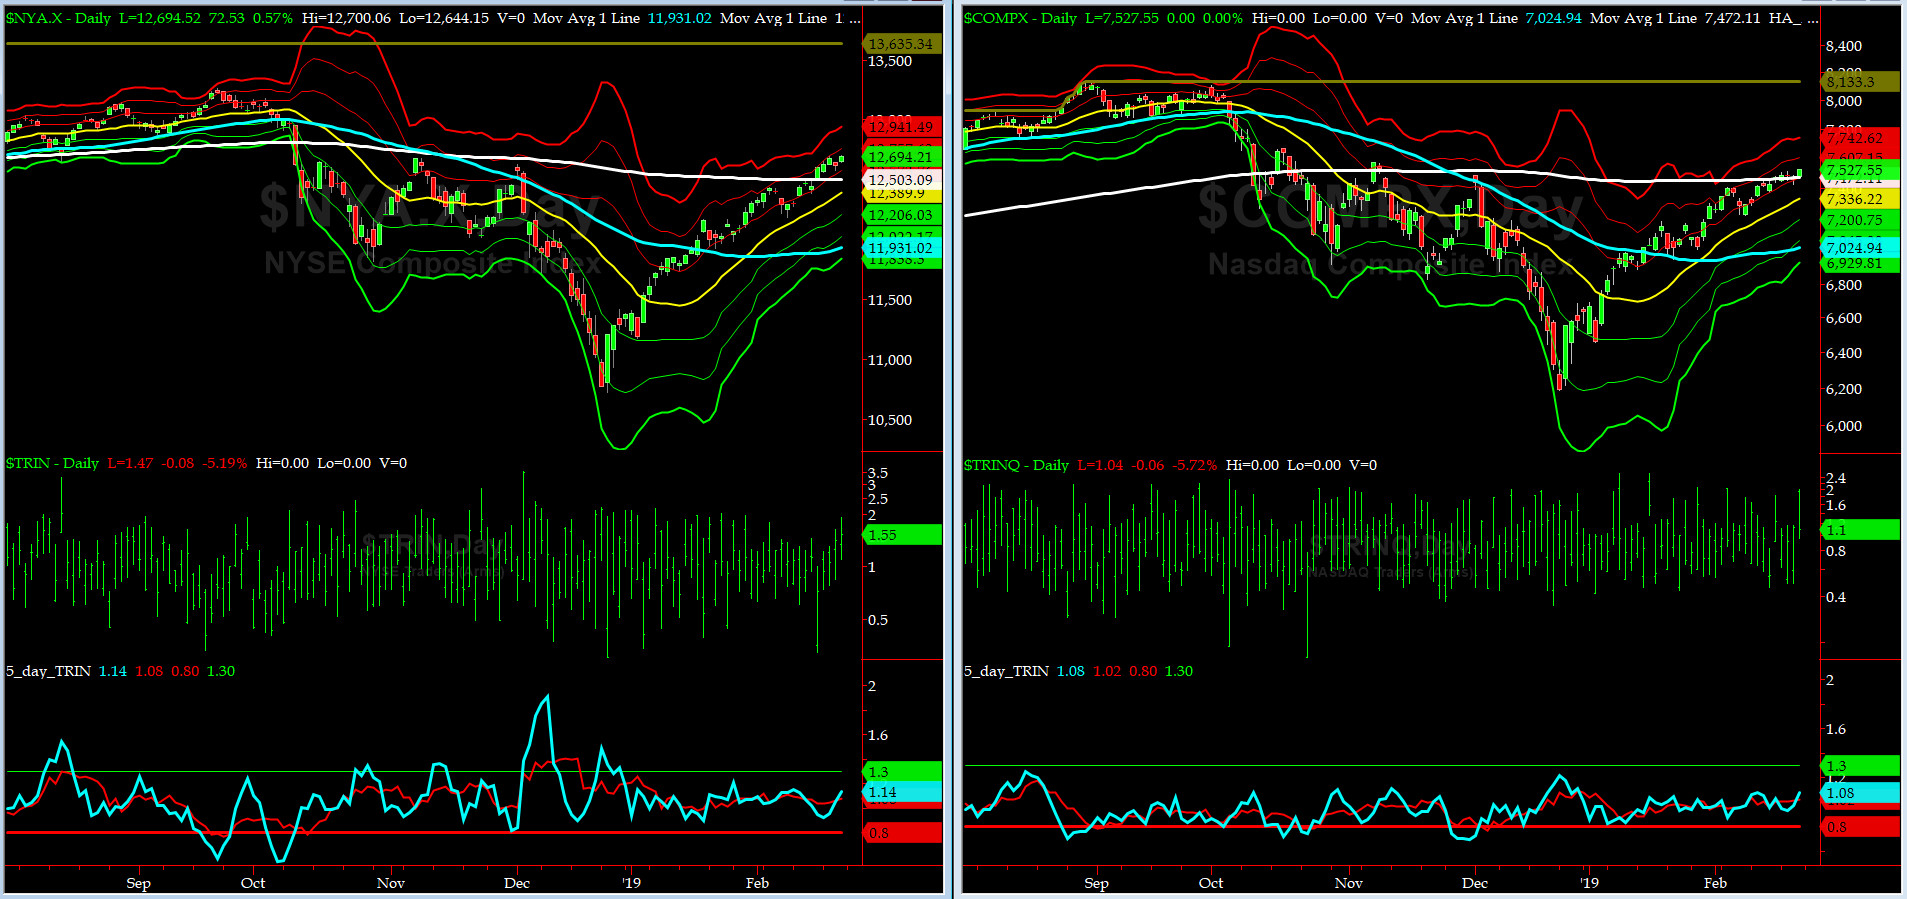
5-day TRIN & TRINQ Charts
NYSE 5-day TRIN is heading to a SELL zone while 5-day TRIN for NASDAQ is in the NEUTRAL zone.
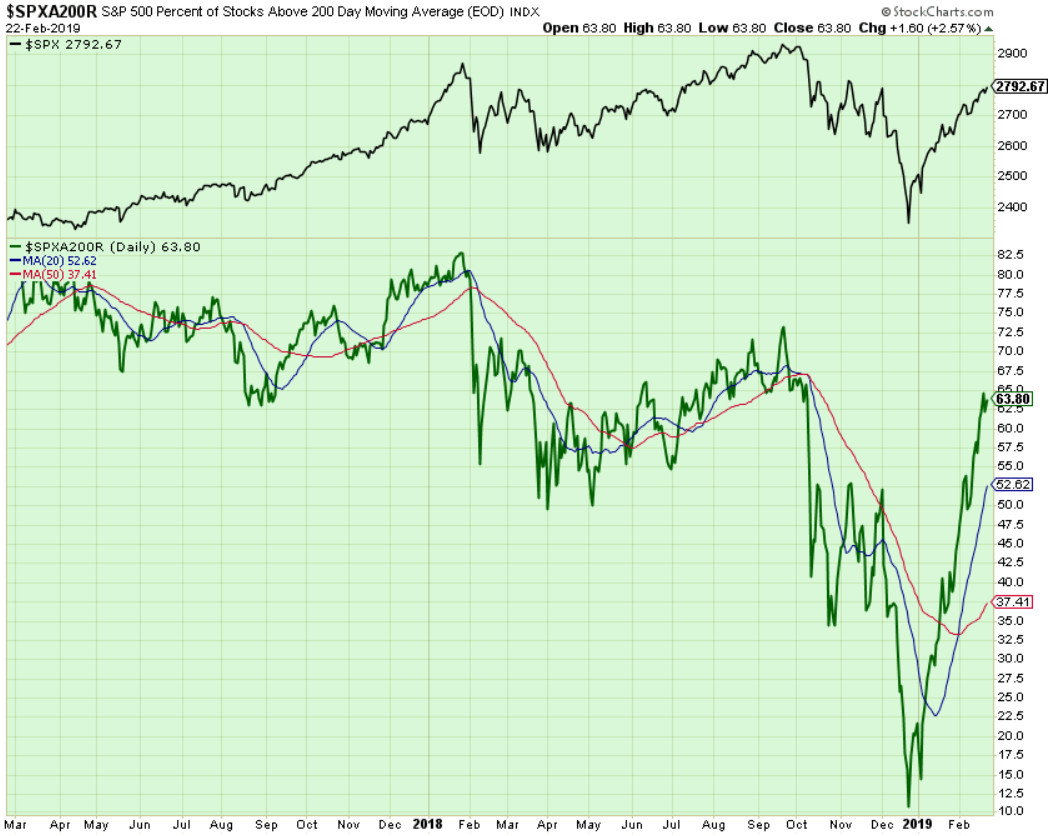
Components of SPX above their respective 200day MA Chart
This scoring indicator rallied hard to 61% and looking at its 20- and 50-day MAs, it is a pretty STRONG showing. Expect higher percentage readings? YES..... looking for 67% to 73% next.
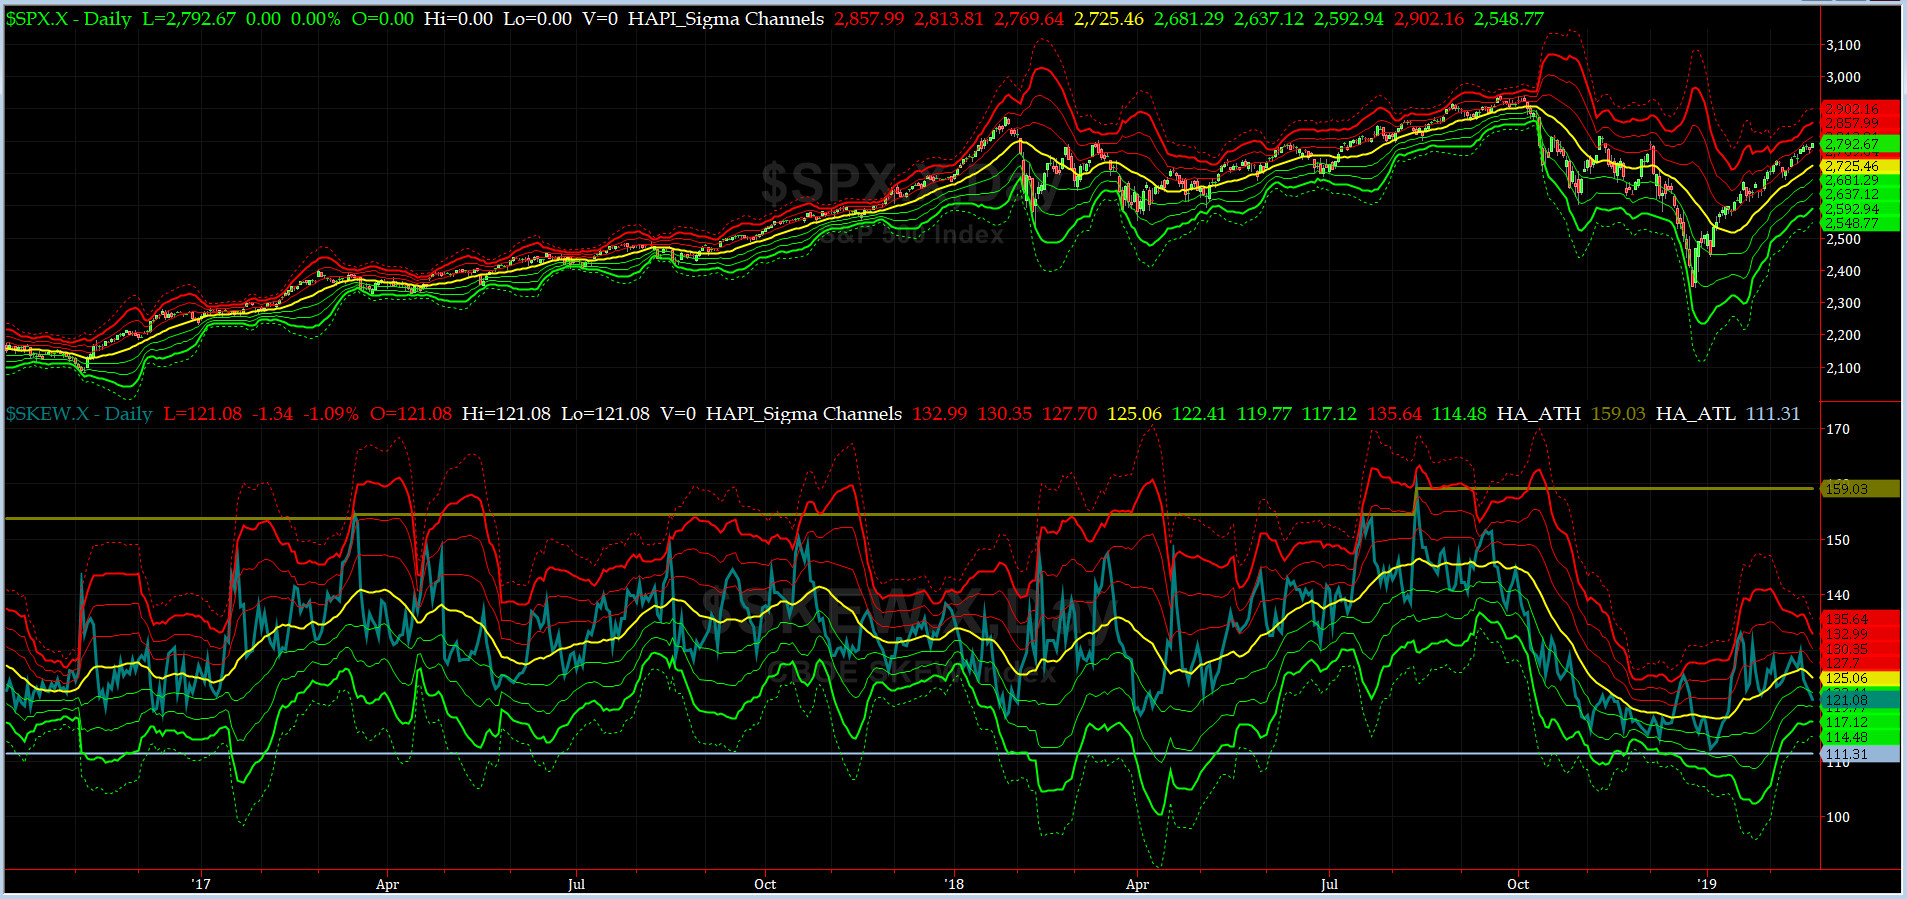
SPX SKEW (Tail Risk) Chart
On Friday, SPX SKEW (Tail Risk) closed near 129.6, now about its +1 sigma (normal = 120-125, range 100-150).
All quiet on the Eastern & Mid-Western Fronts, again? YES according to HRH Capt Tiko, KCPE....
How to interpret the value of SPX SKEW? (from CBOE white paper on SKEW)

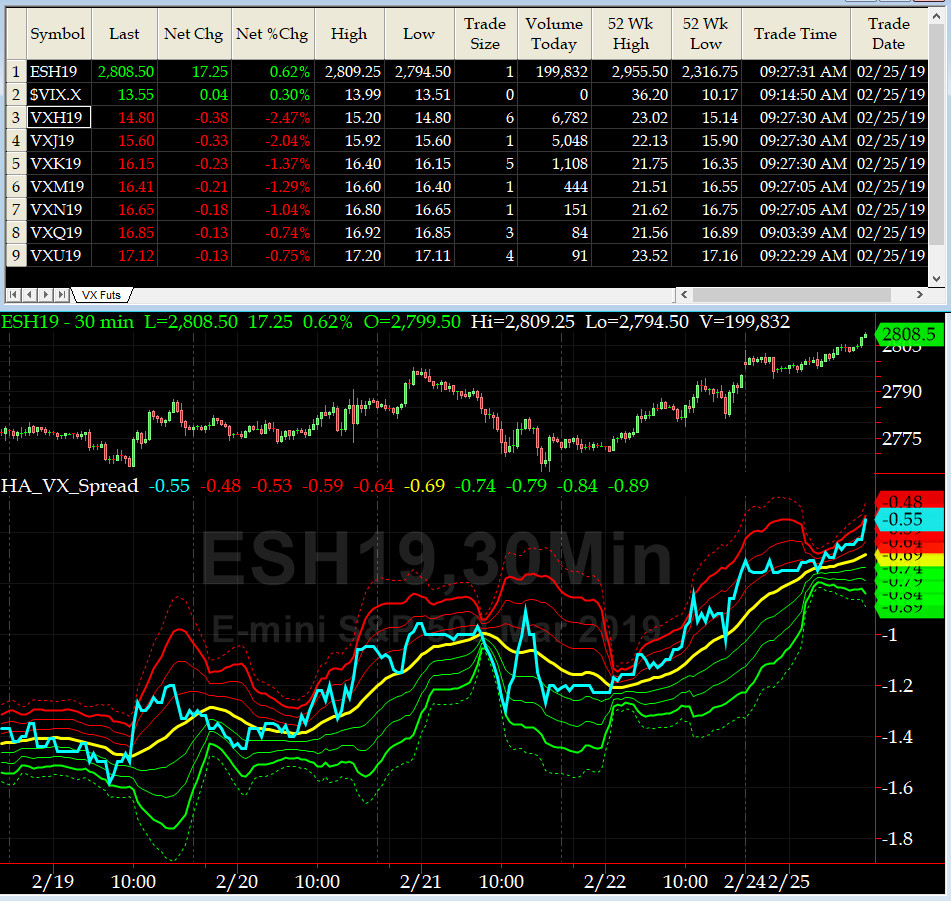
3-month VIX Futures Spread(VX) Chart
This popular timing indicator, (now long MAR19, & short JUN19 VIX Futures) again closed at -1.5 which says SPX is in NEUTRAL.
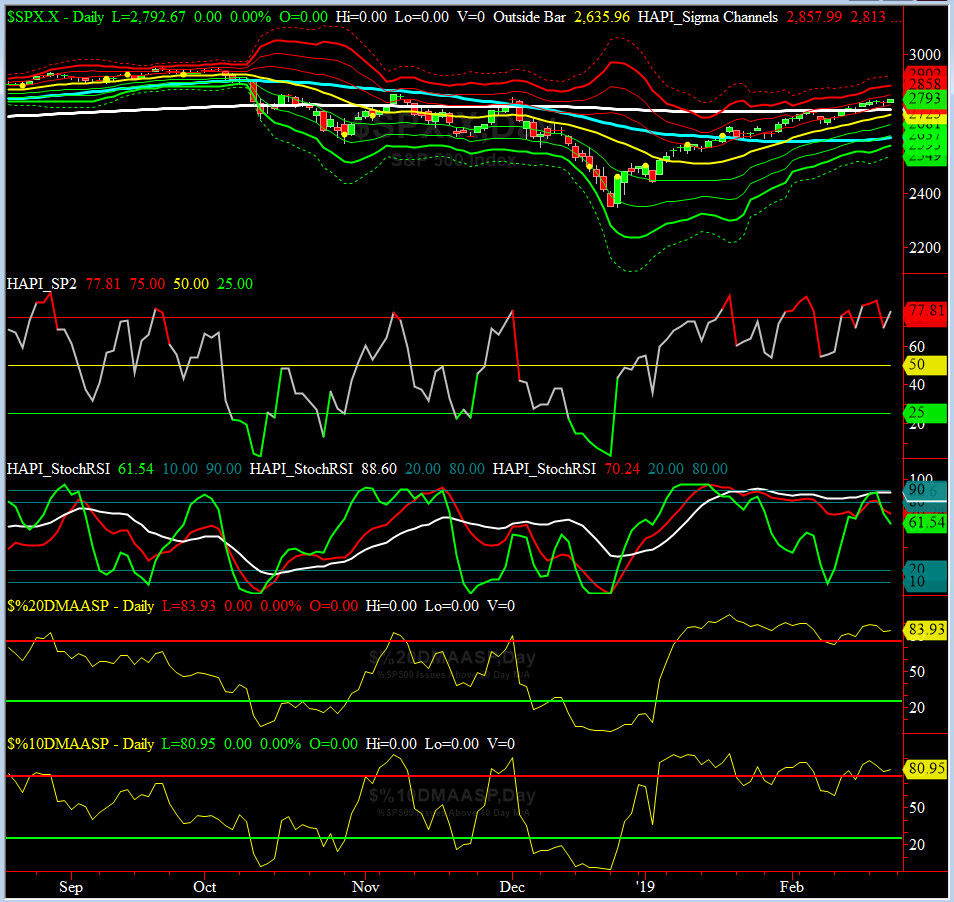
HA_SP2 Chart
HA_SP2 = 80.75 (Buy signal <= 25, Sell Signal >= 75)
Our coveted SP2 prop indicator continues to revisit the OVRBOUGHT zone for the THIRD time since mid-January. Be careful in your bet size.
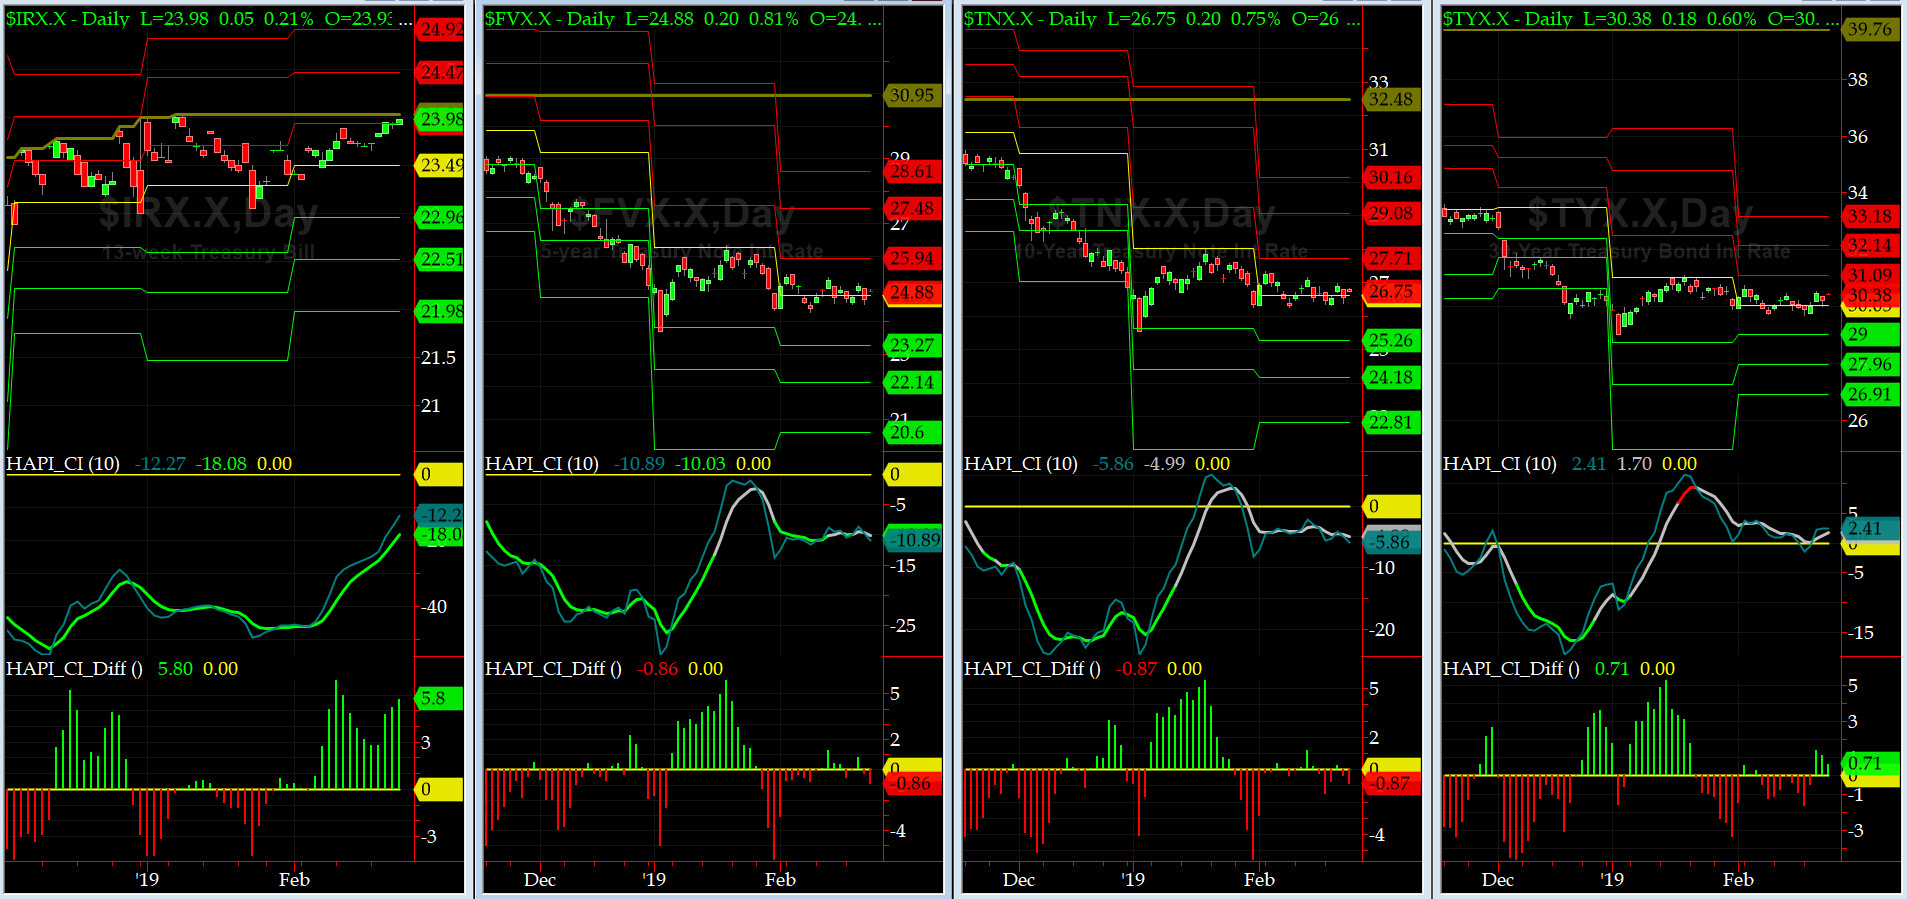
US Treasury T-Notes & T-Bonds Yields Chart
The YTMs again went sideways last week. Maury is not happy, again.
Fari Hamzei
|


 Proactive Market Timing