|
Monday, March 11, 2019, 0730ET
Market Timing Charts, Analysis & Commentary for Issue #283
Timer Charts of S&P-500 Cash Index (SPX) + NASDAQ-100 Cash Index (NDX)
Most recent S&P-500 Cash Index (SPX): 2743 down -61 (down -2.2%) for the week ending on Friday, March 8, 2019, which closed below its -1 sigma.
DJIA ALL TIME INTRADAY HIGH = 26951 (reached on Wednesday, October 3, 2018)
DJ TRAN ALL TIME INTRADAY HIGH = 11623 (reached on Friday, September 14, 2018)
SPX ALL TIME INTRADAY HIGH = 2941 (reached on Friday, September 21, 2018)
NDX ALL TIME INTRADAY HIGH = 7700 (reached on Thursday, October 1, 2018)
RUT ALL TIME INTRADAY HIGH = 1742 (reached on Friday, August 31, 2018)
Current DAILY +2 Sigma SPX = 2824 with WEEKLY +2 Sigma = 2876
Current DAILY 0 Sigma SPX = 2769 with WEEKLY 0 Sigma = 2671
Current DAILY -2 Sigma SPX = 2714 with WEEKLY -2 Sigma = 2466
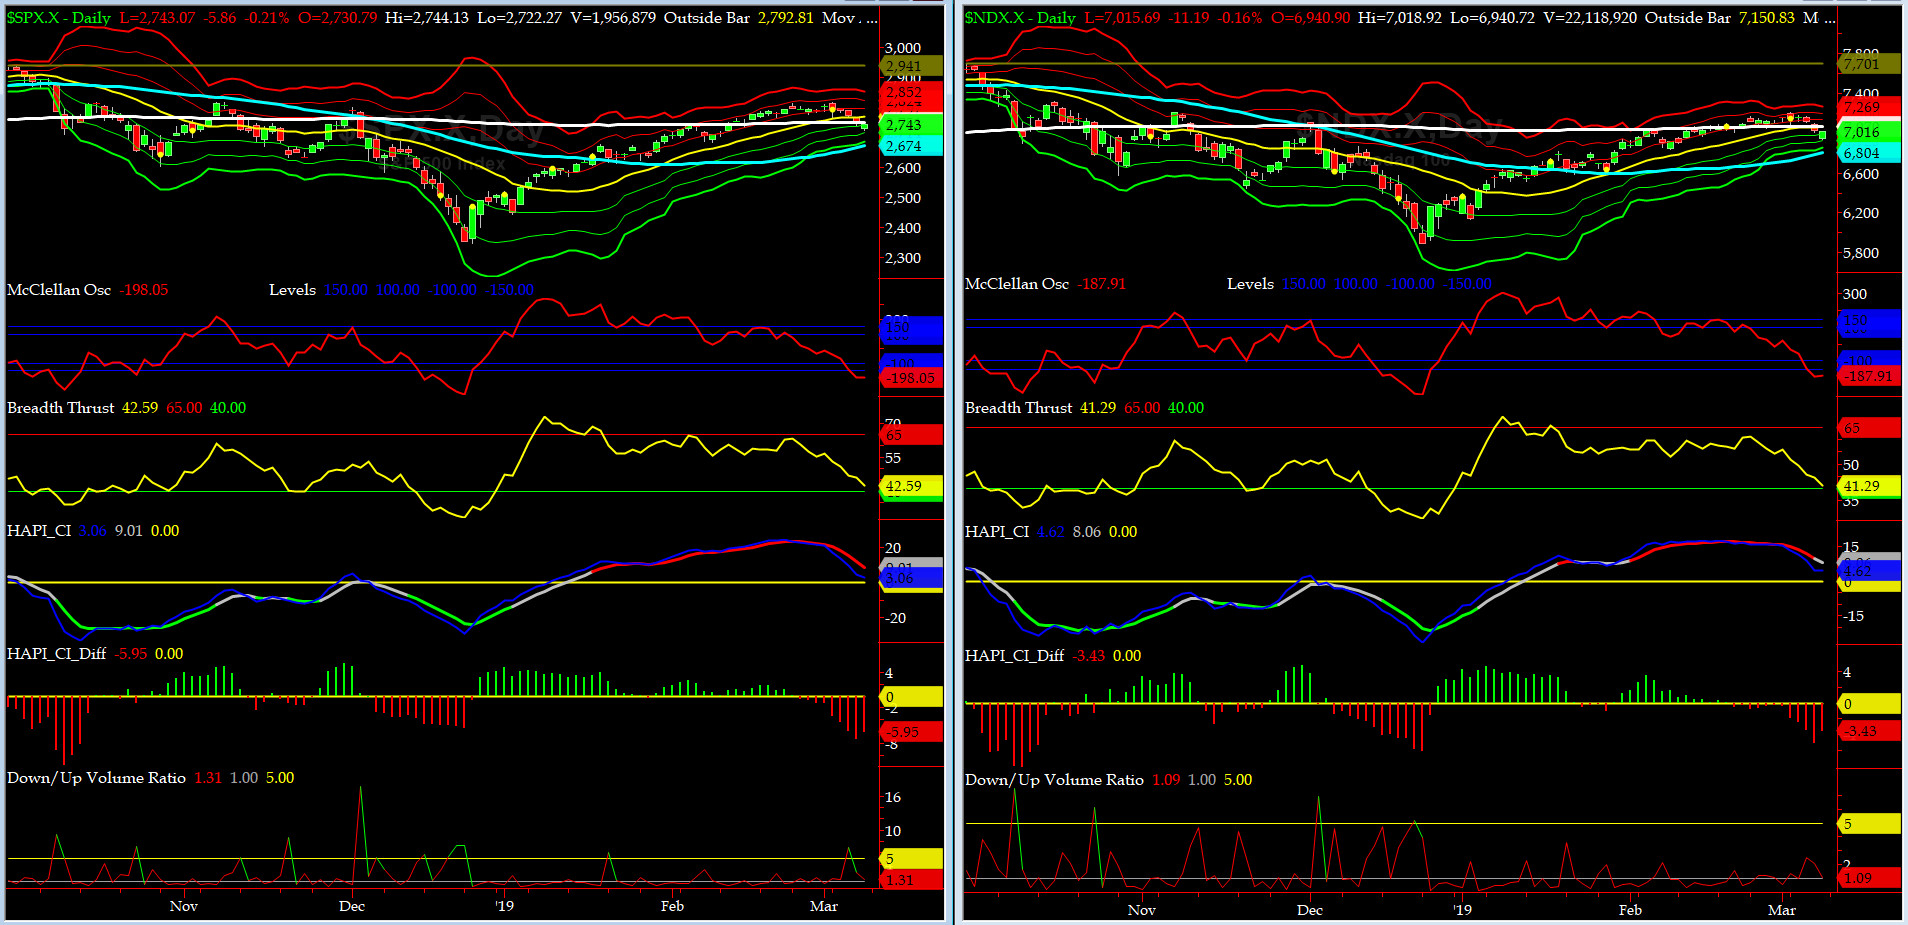
NYSE McClellan Oscillator = -198 (-150 is start of the O/S area; around -275 to -300 area or lower, we go into the �launch-pad� mode; over +150, we are in O/B area)
NYSE Breadth Thrust = 42.6 (40 is considered as oversold and 65 as overbought)
By Monday of last week, SPX put in an outside bar reversal on the WEEKLY chart. ioho, this is huge.
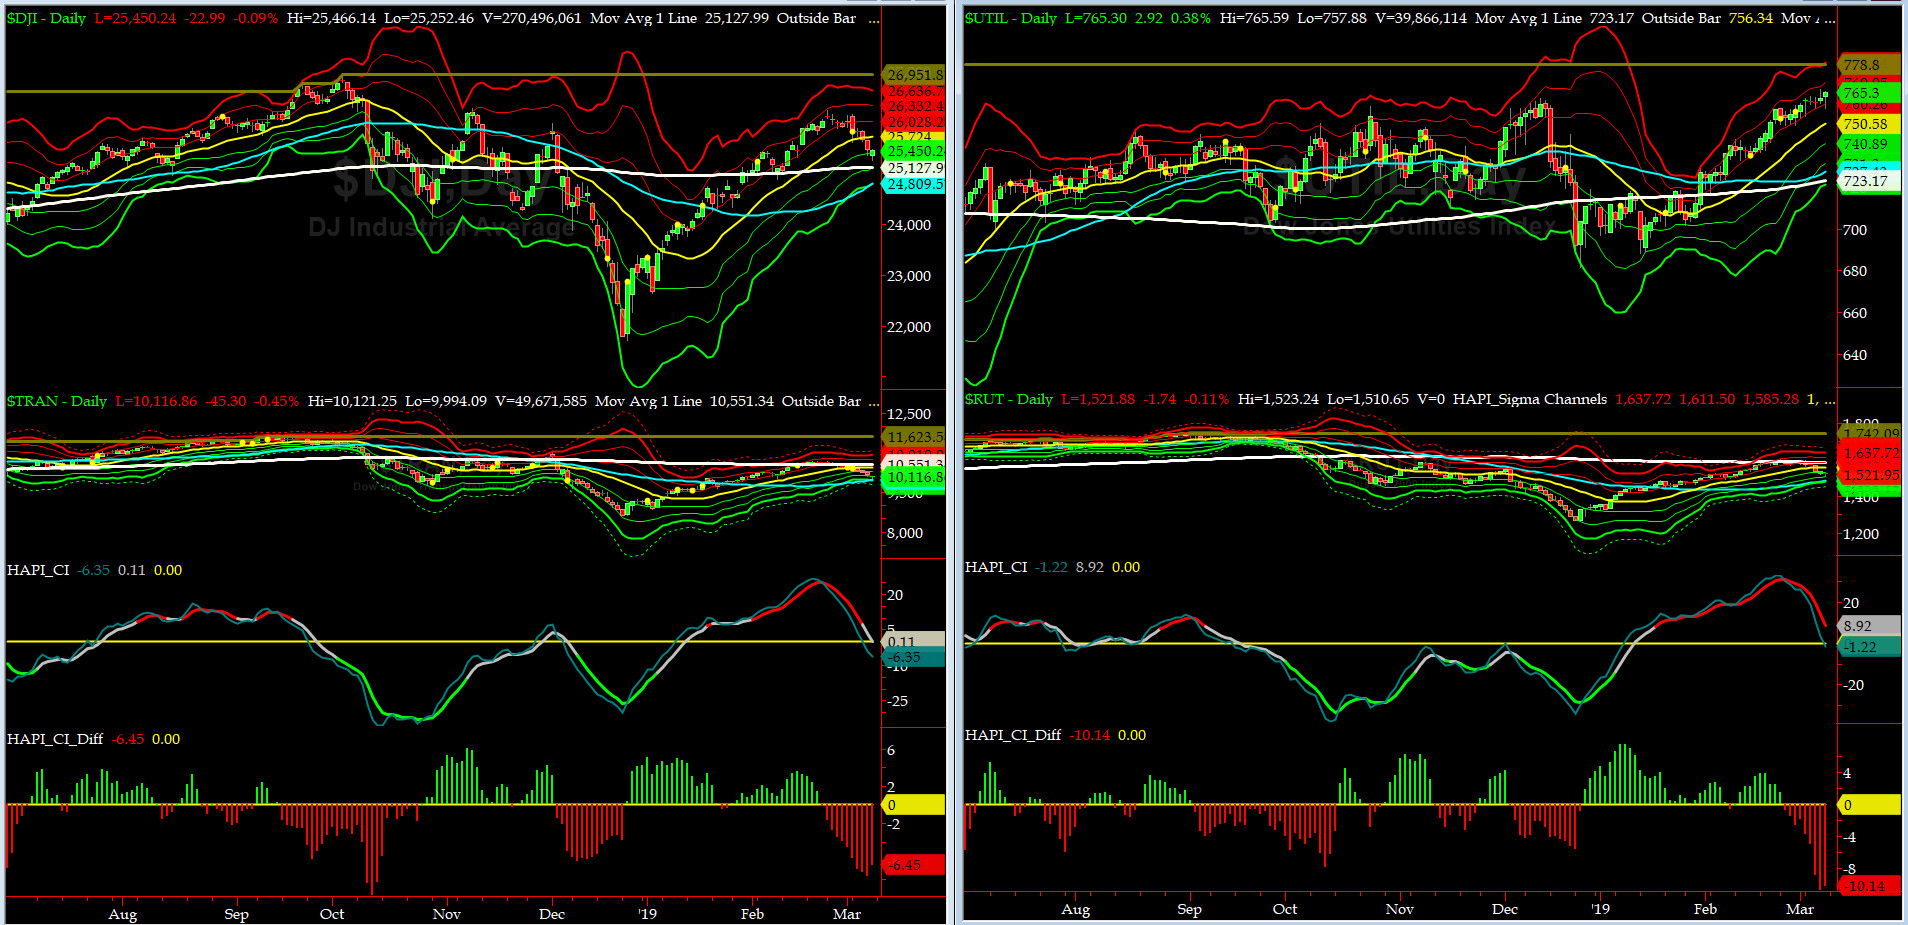
Canaries [in the Coal Mine] Chart for DJ TRAN & RUT Indices
200-Day MA DJ TRAN = 10,551 or 4.1% ABOVE DJ TRAN (max observed in last 7 yrs = 20.2%, min = -20.3%)
200-Day MA RUT = 1585 or 4% ABOVE RUT (max observed in last 7 yrs = 21.3%, min = -22.6%)
DJ Transportation Index (proxy for economic conditions 6 to 9 months hence) sold off pretty hard till mid-day Friday.
Russell 2000 Small Caps Index (proxy for Risk ON/OFF) puked on Wednesday and continued to sell into mid-day Friday. RISK is still ON.
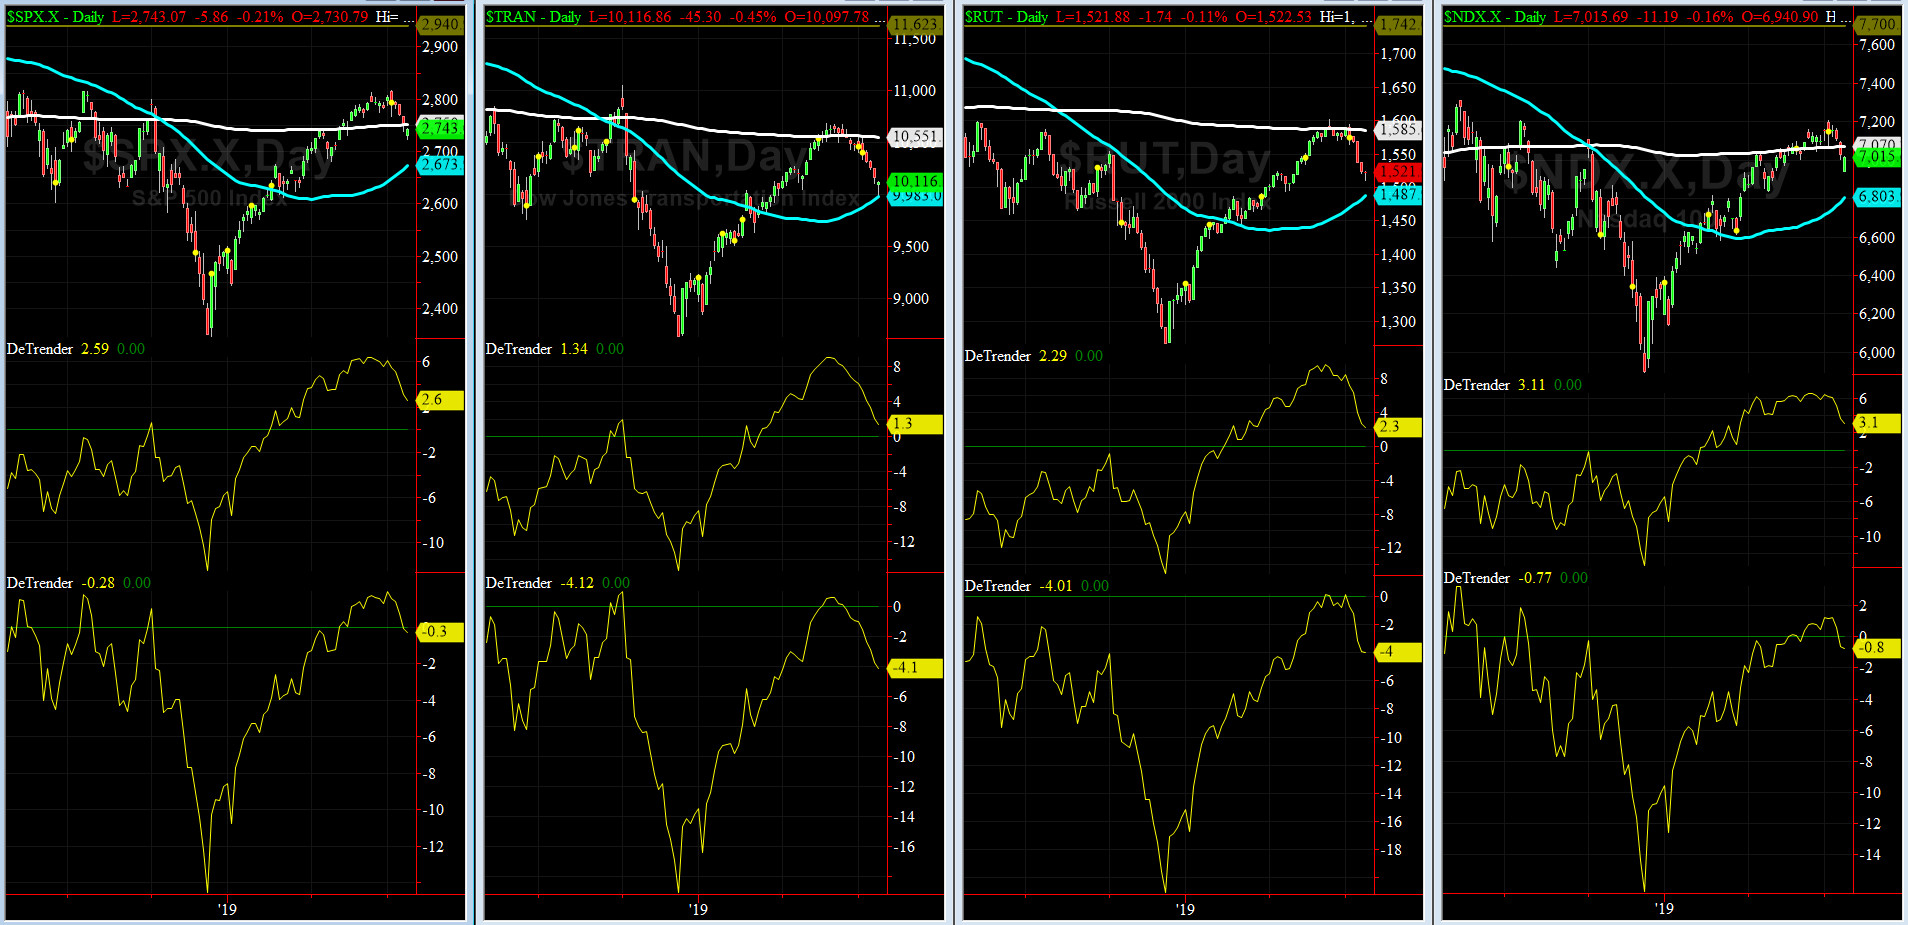
DeTrenders Charts for SPX, NDX, TRAN & RUT Indices
50-Day MA SPX = 2673 or 2.6% BELOW SPX (max observed in last 7 yrs = +8.6%, min = -9.3%)
200-Day MA SPX = 2750 or 0.3% ABOVE SPX (max observed in last 7 yrs = 15.2%, min = -14%)
FOUR out of EIGHT of our DeTrenders are now in the POSITIVE territory. The DeTrenders for DJ Tran & RUT will continue to be harbingers of future price behavior in broad indices.
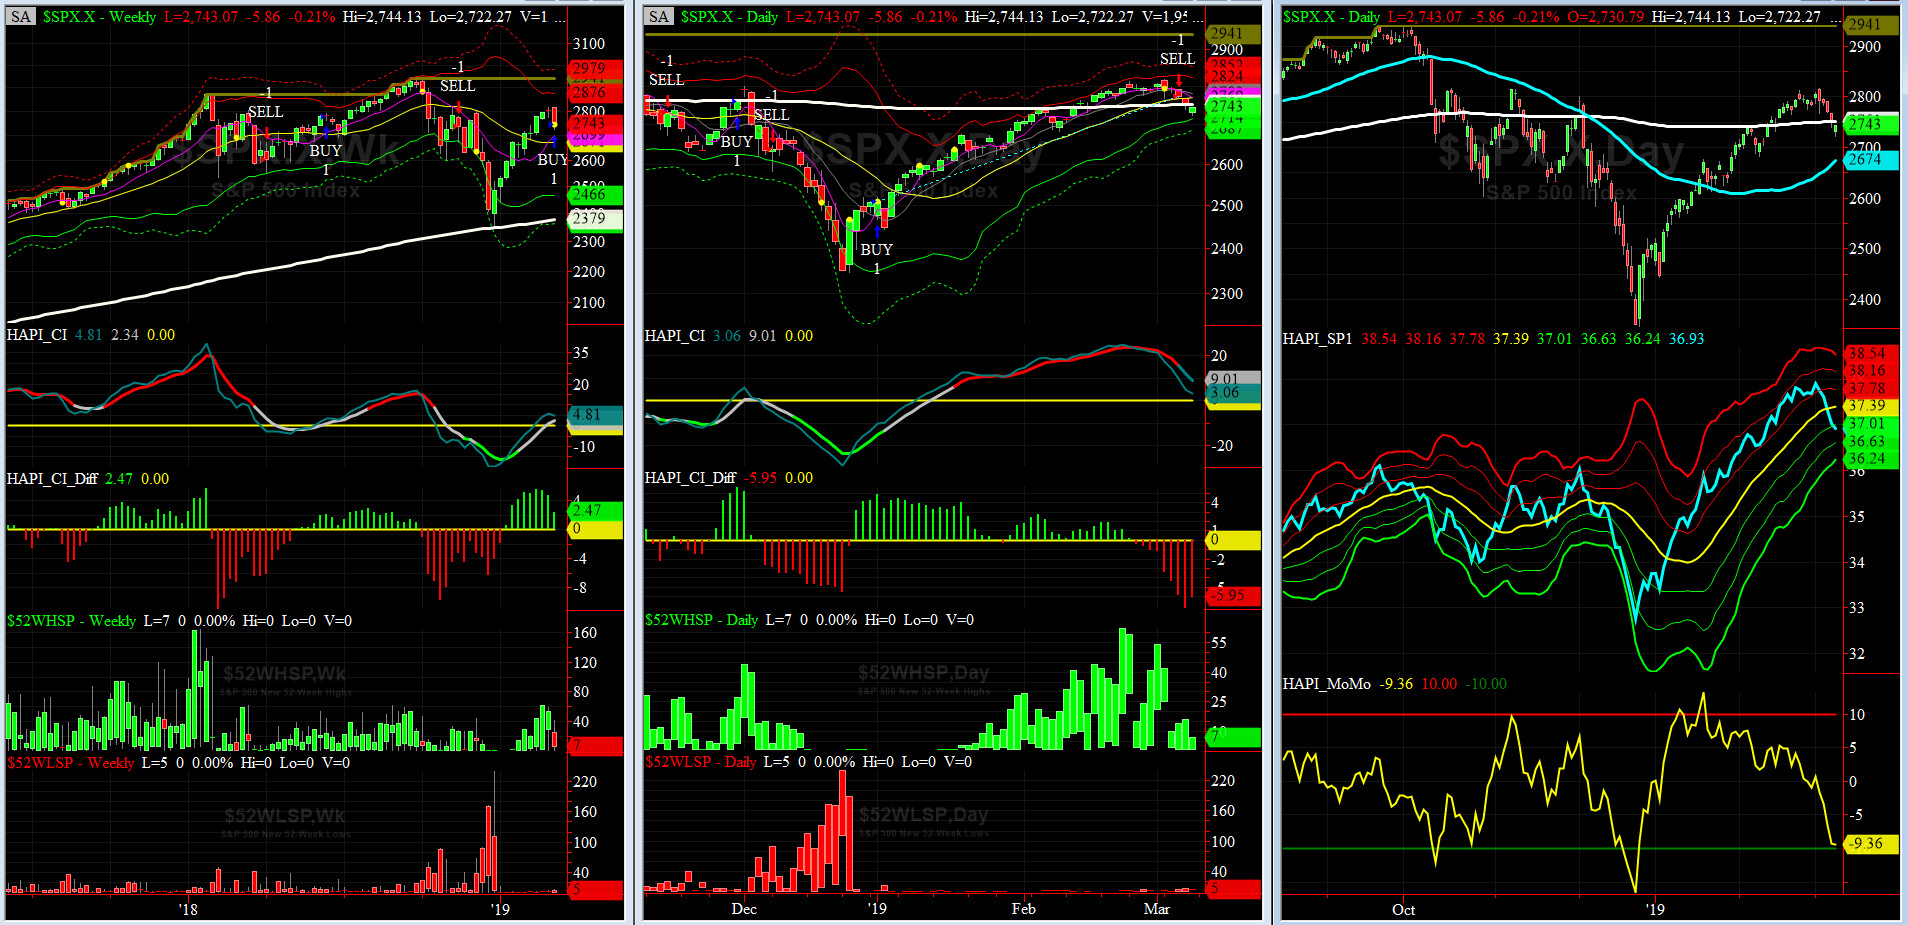
HA_SP1_Momo Chart
WEEKLY Timing Model = on a BUY Signal since Friday, March 8, 2019 CLOSE at 2743
DAILY Timing Model = on a SELL Signal since Wednesday, March 6, 2019 CLOSE at 2771
Max SPX 52wk-highs reading last week = 42 (over 120-140, the local maxima is in)
Max SPX 52wk-Lows reading last week = 6 (over 40-60, the local minima is in)
HA_SP1 closed near its -1 sigma channels
HA_Momo = -9.37 (reversals most likely occur above +10 or below -10)
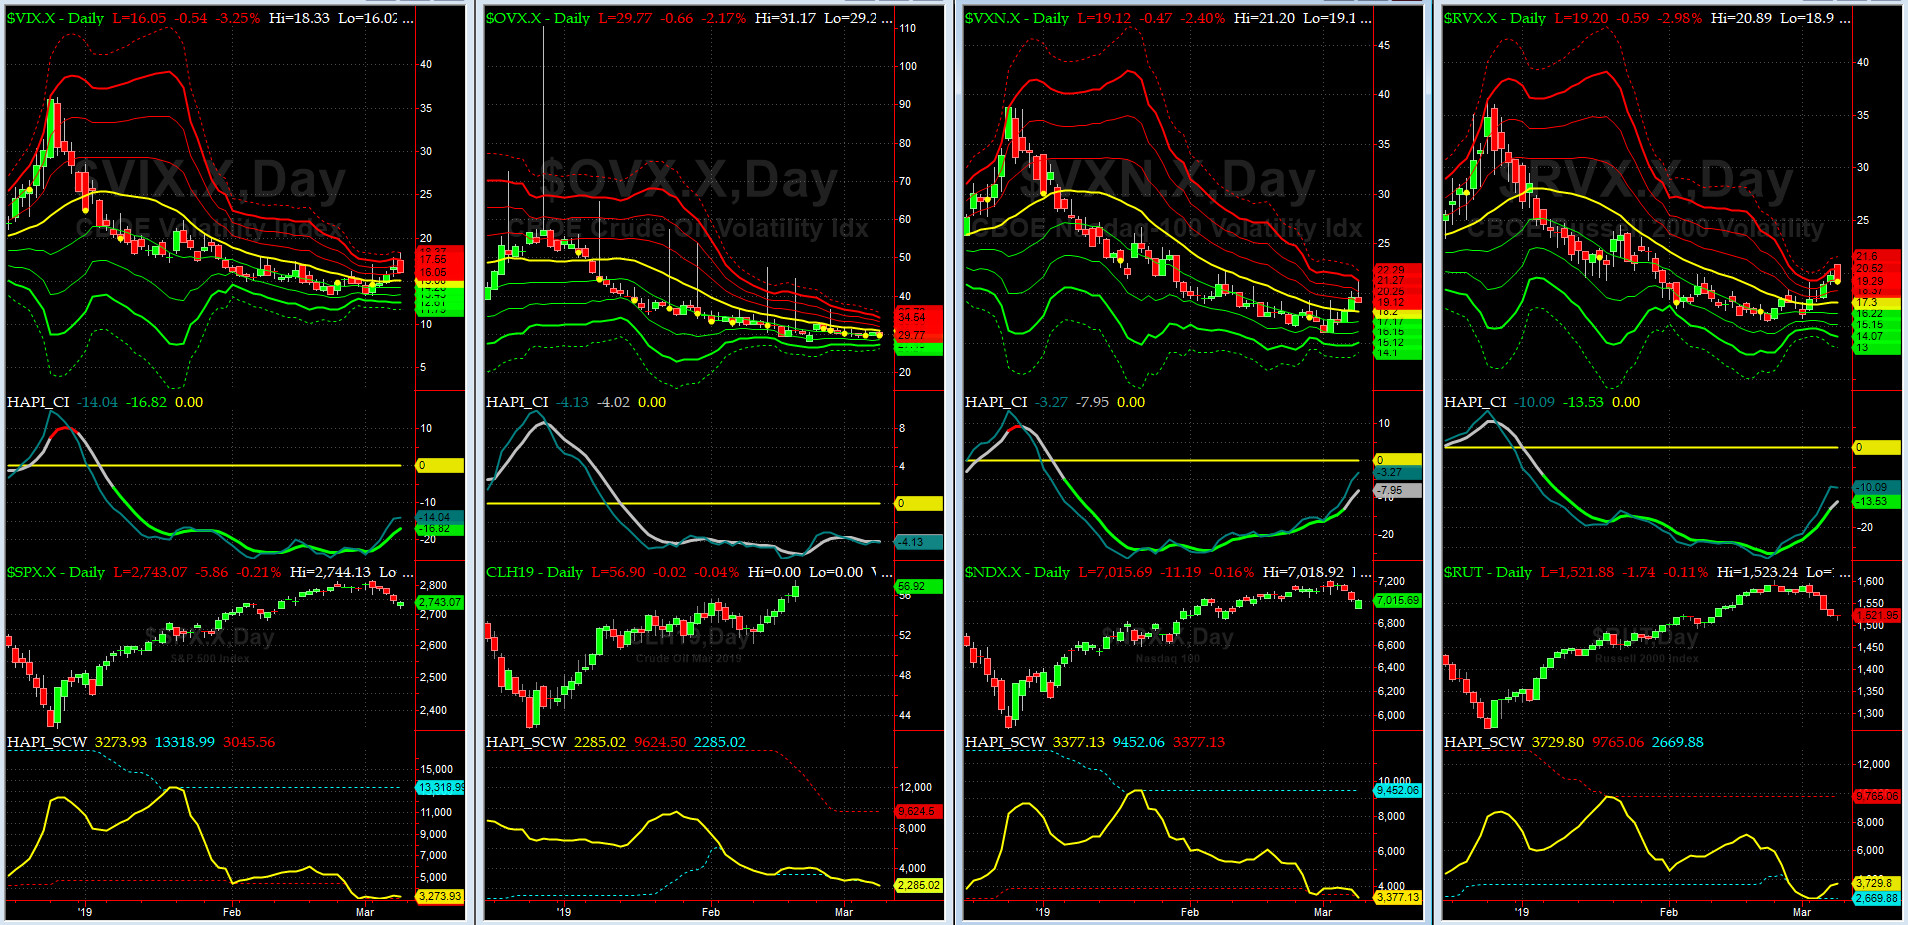
Vol of the Vols Chart
Spot VIX currently stands at 16.05, at about its +1 sigma (remember it's the VIX volatility pattern aka "its sigma channels" that matters, and not the level of VIX itself (this is per Dr. Robert Whaley, a great mentor and inventor of original VIX, now called VXO). VIX usually peaks around a test of its +4 sigma).
VIX rallied all week and reached +4 sigma by mid-day Friday and then reversed 3 sigma levels !!

5-day TRIN & TRINQ Charts
NYSE 5-day TRIN is nearing a BUY zone while 5-day TRIN is nearing a SELL zone. Be careful out there.
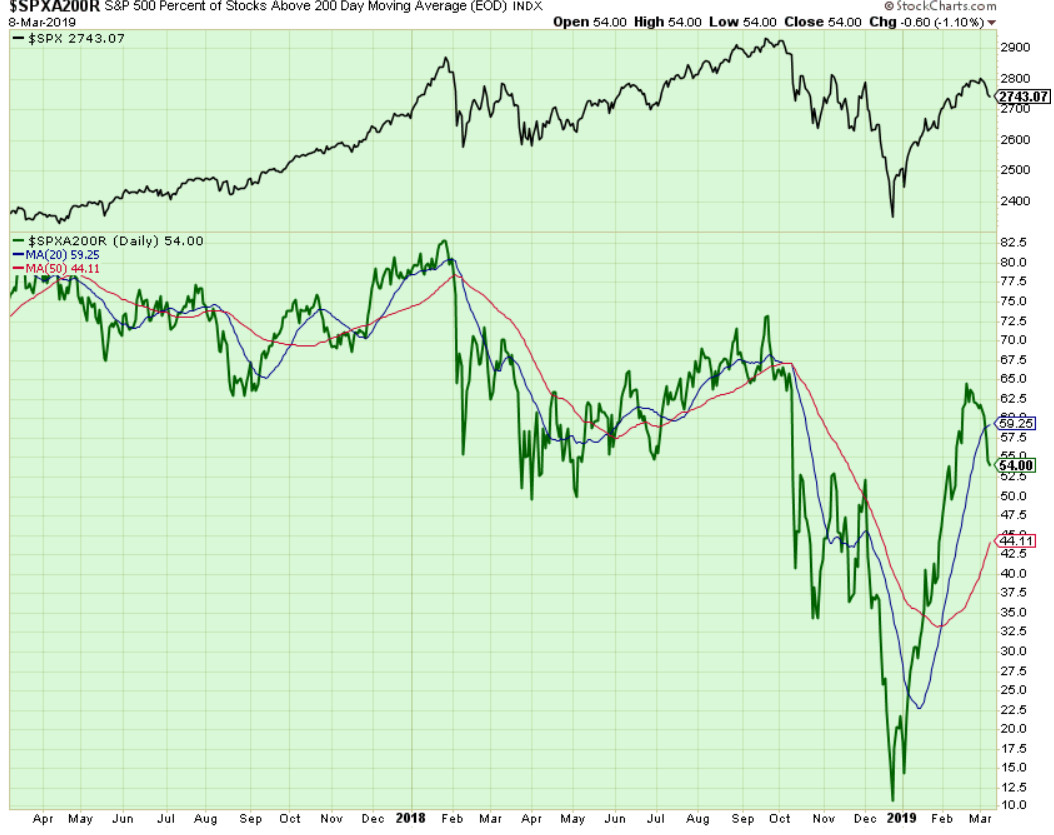
Components of SPX above their respective 200day MA Chart
This scoring indicator rallied hard to 54% after failing earlier in the week at 65-ish. While we continue to keep an eyes on its dual MAs at 20 & 50 Days, if this indicator does not fall below 50% soon, then the downside momo shall be in serious doubt.
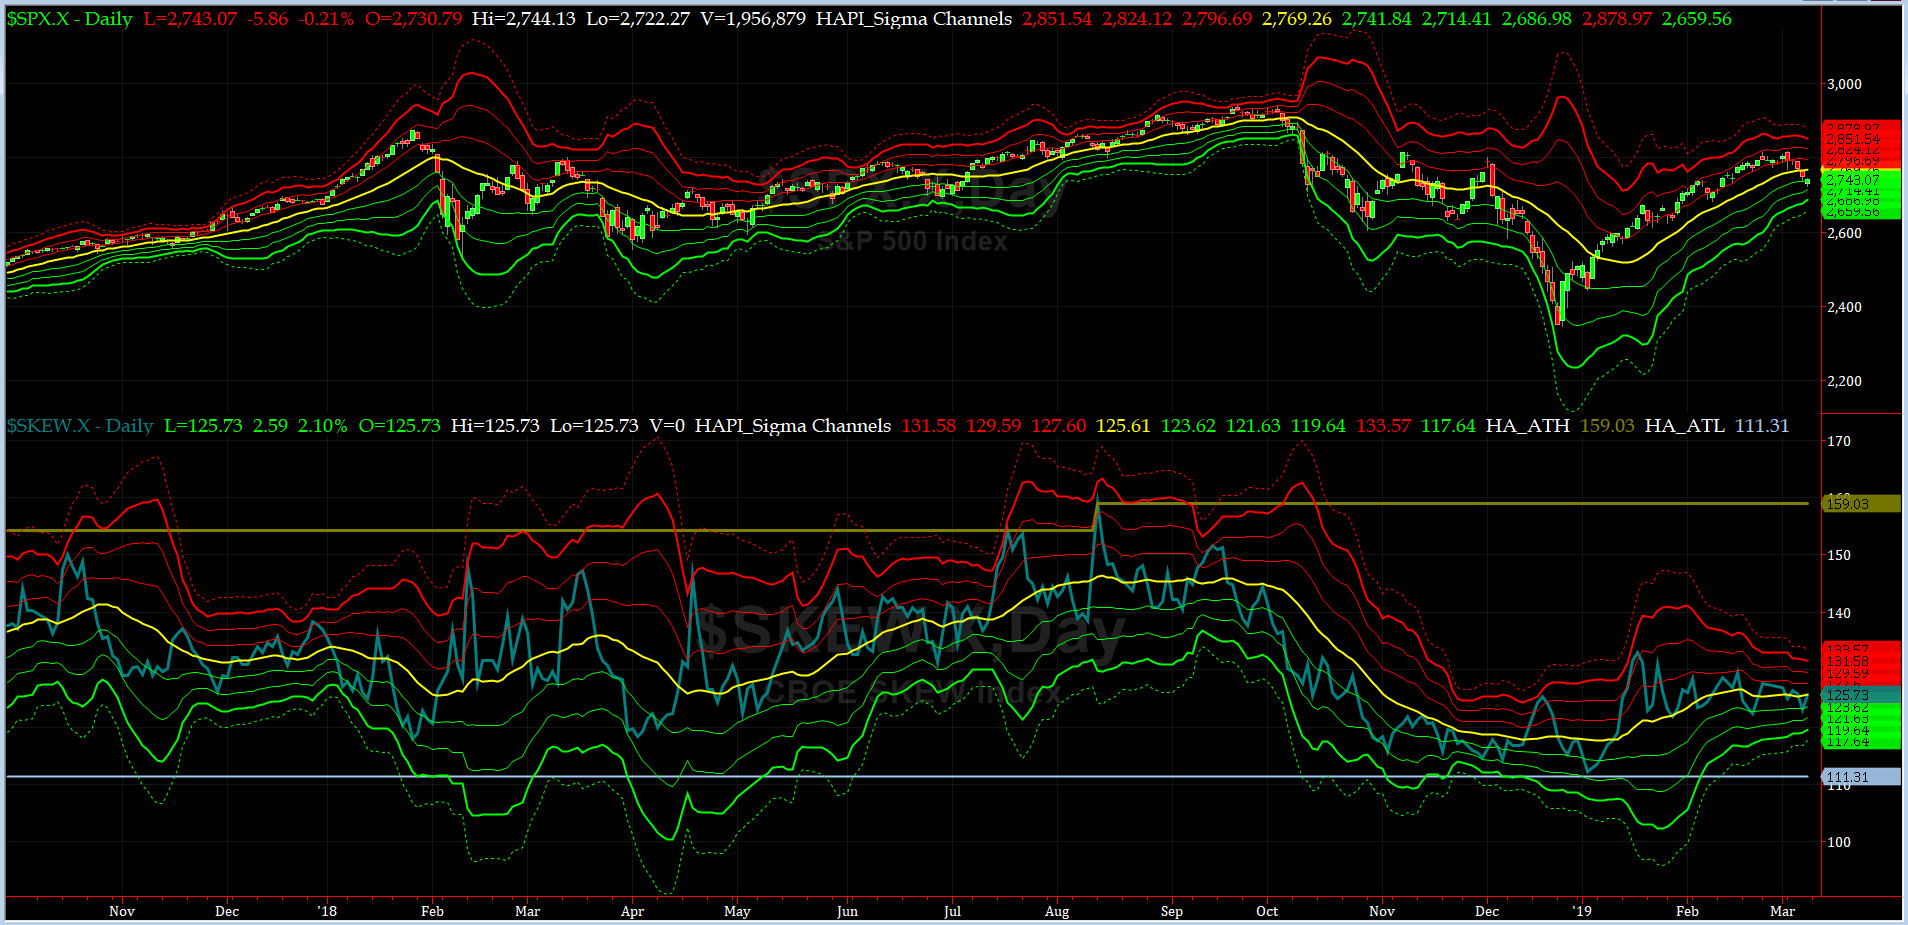
SPX SKEW (Tail Risk) Chart
On Friday, SPX SKEW (Tail Risk) closed near 125.7, now about its zero sigma (normal = 120-125, range 100-150).
All quiet on the Eastern & Mid-Western Fronts, again? YES, this is according to our beloved HRH Capt Tiko, KCPE....
How to interpret the value of SPX SKEW? (from CBOE white paper on SKEW)


3-month VIX Futures Spread(VX) Chart
This popular timing indicator, (now long MAR19, & short JUN19 VIX Futures) crossed the zero line on Friday and closed at -0.6 which says we **may** have seen the SPX low.
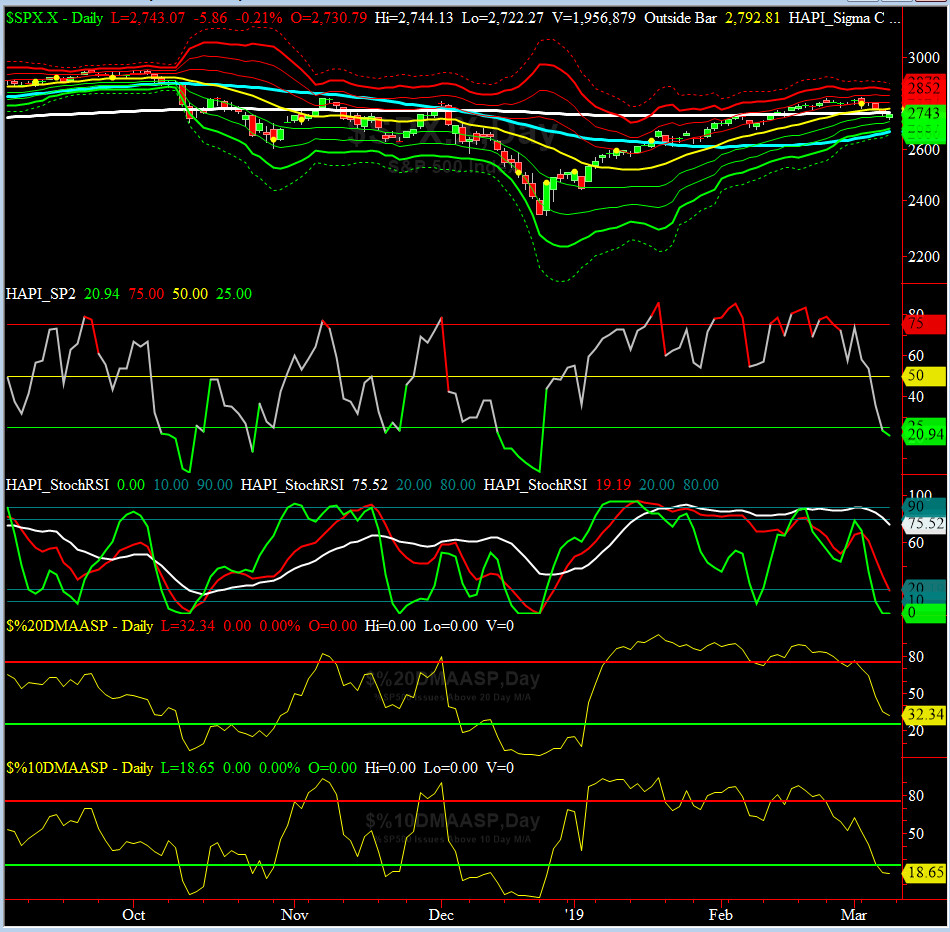
HA_SP2 Chart
HA_SP2 = 20.9 (Buy signal <= 25, Sell Signal >= 75)
Our coveted SP2 prop indicator is in OVERSOLD zone now.
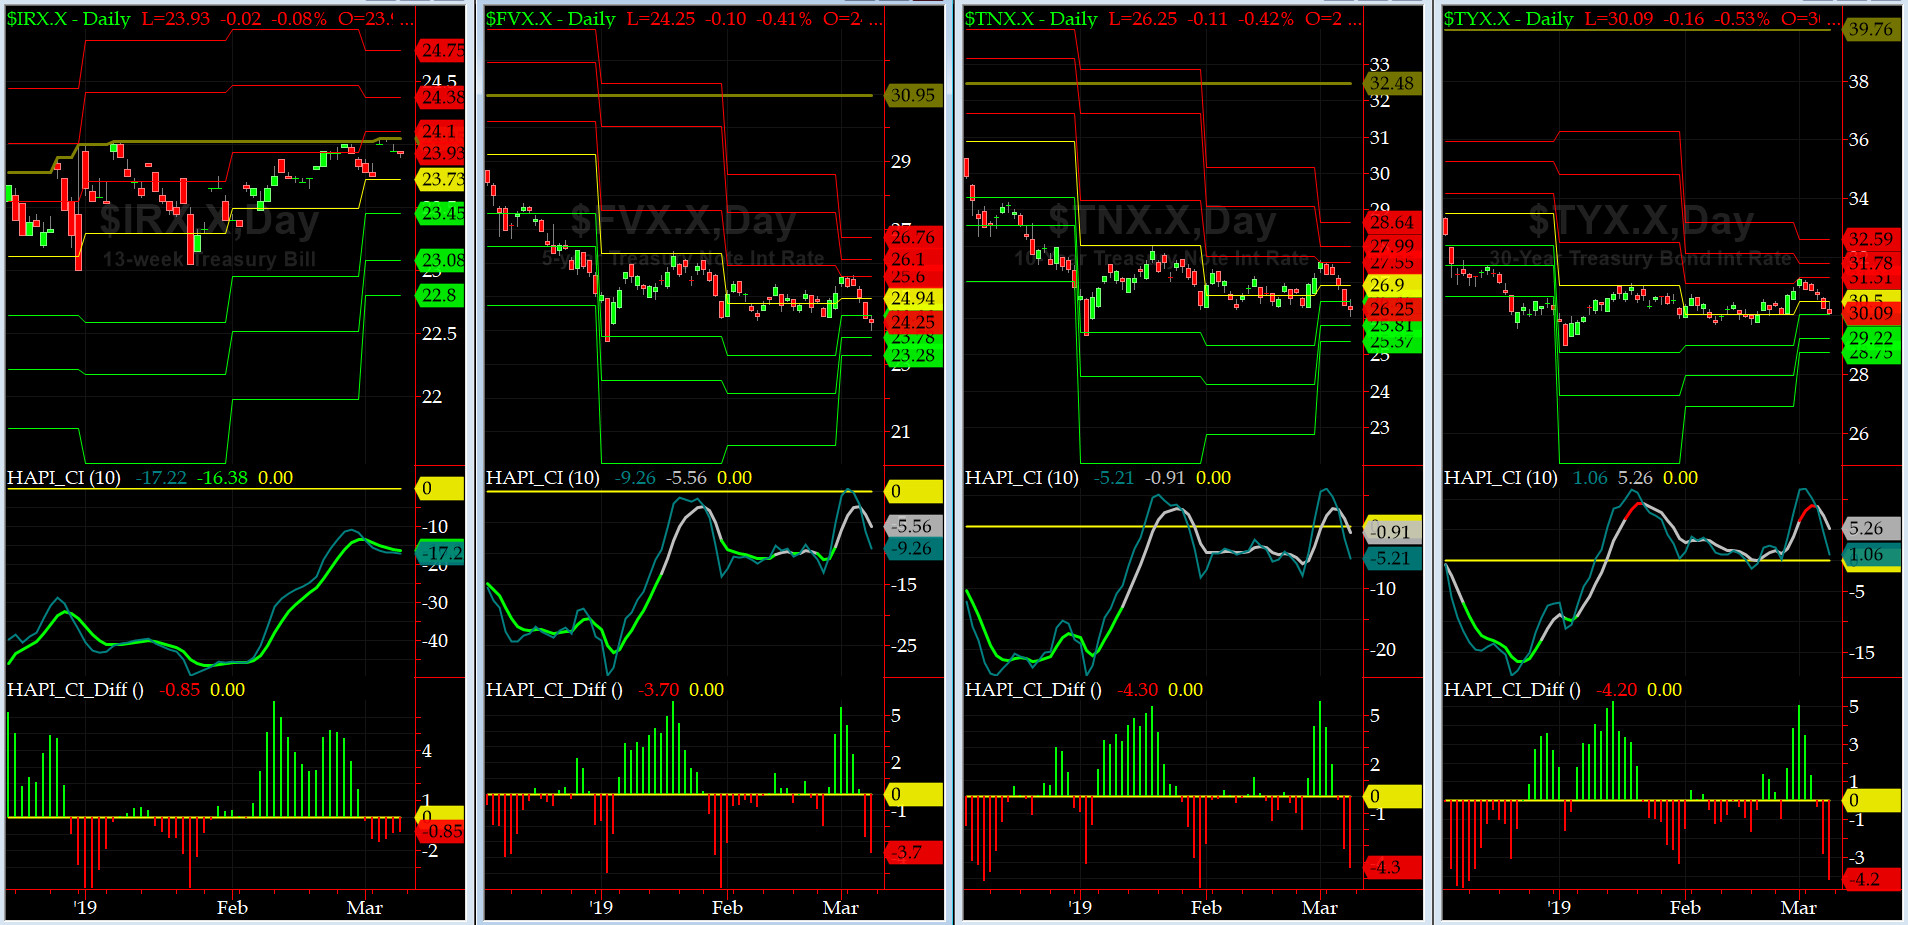
US Treasury T-Notes & T-Bonds Yields Chart
The front end of the Curve jumped on Wednesday and then went sideways while the intermediate to long end of the Curve sold off hard (notes & bonds rallied). Maury is upset again. oh boy.
Fari Hamzei
|


 Proactive Market Timing


