|
Tuesday, April 9, 2019, 0845ET
Market Timing Charts, Analysis & Commentary for Issue #287
Timer Charts of S&P-500 Cash Index (SPX) + NASDAQ-100 Cash Index (NDX)
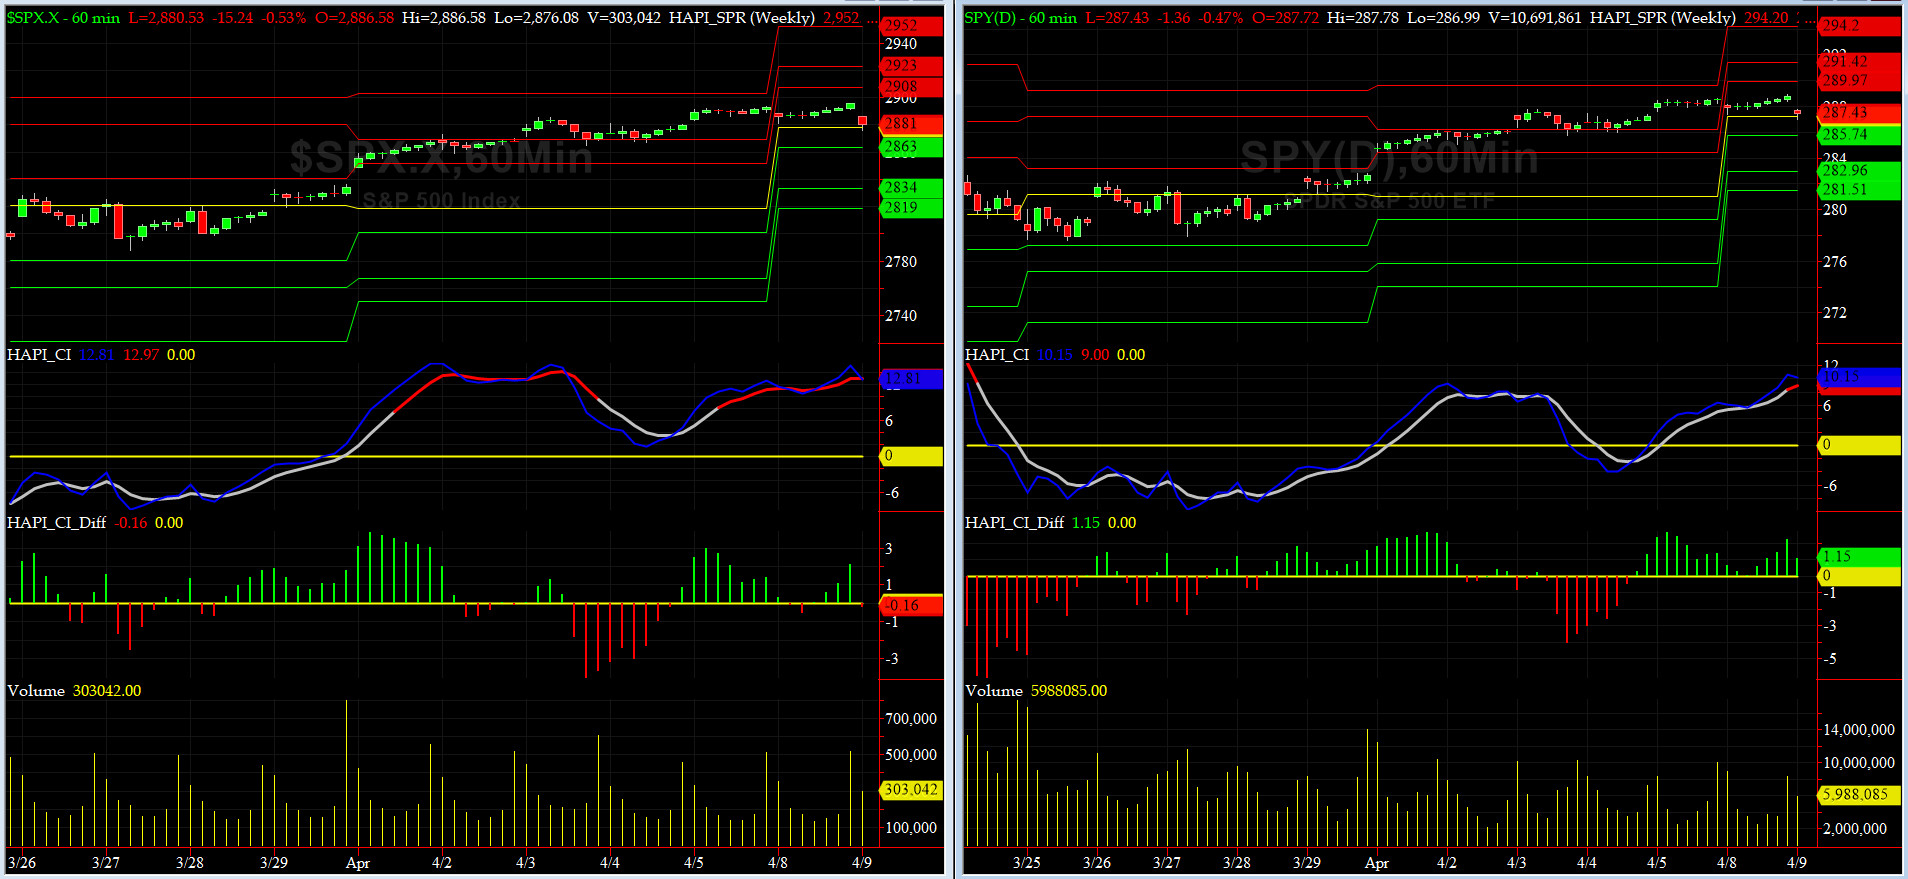
Most recent S&P-500 Cash Index (SPX): 2895 up +3 for the six days ending on Monday, April 8, 2019, which closed at its +2 sigma.
DJIA ALL TIME INTRADAY HIGH = 26951 (reached on Wednesday, October 3, 2018)
DJ TRAN ALL TIME INTRADAY HIGH = 11623 (reached on Friday, September 14, 2018)
SPX ALL TIME INTRADAY HIGH = 2941 (reached on Friday, September 21, 2018)
NDX ALL TIME INTRADAY HIGH = 7700 (reached on Thursday, October 1, 2018)
RUT ALL TIME INTRADAY HIGH = 1742 (reached on Friday, August 31, 2018)
Current DAILY +2 Sigma SPX = 2868 with WEEKLY +2 Sigma = 2964
Current DAILY 0 Sigma SPX = 2836 with WEEKLY 0 Sigma = 2707
Current DAILY -2 Sigma SPX = 2783 with WEEKLY -2 Sigma = 2450
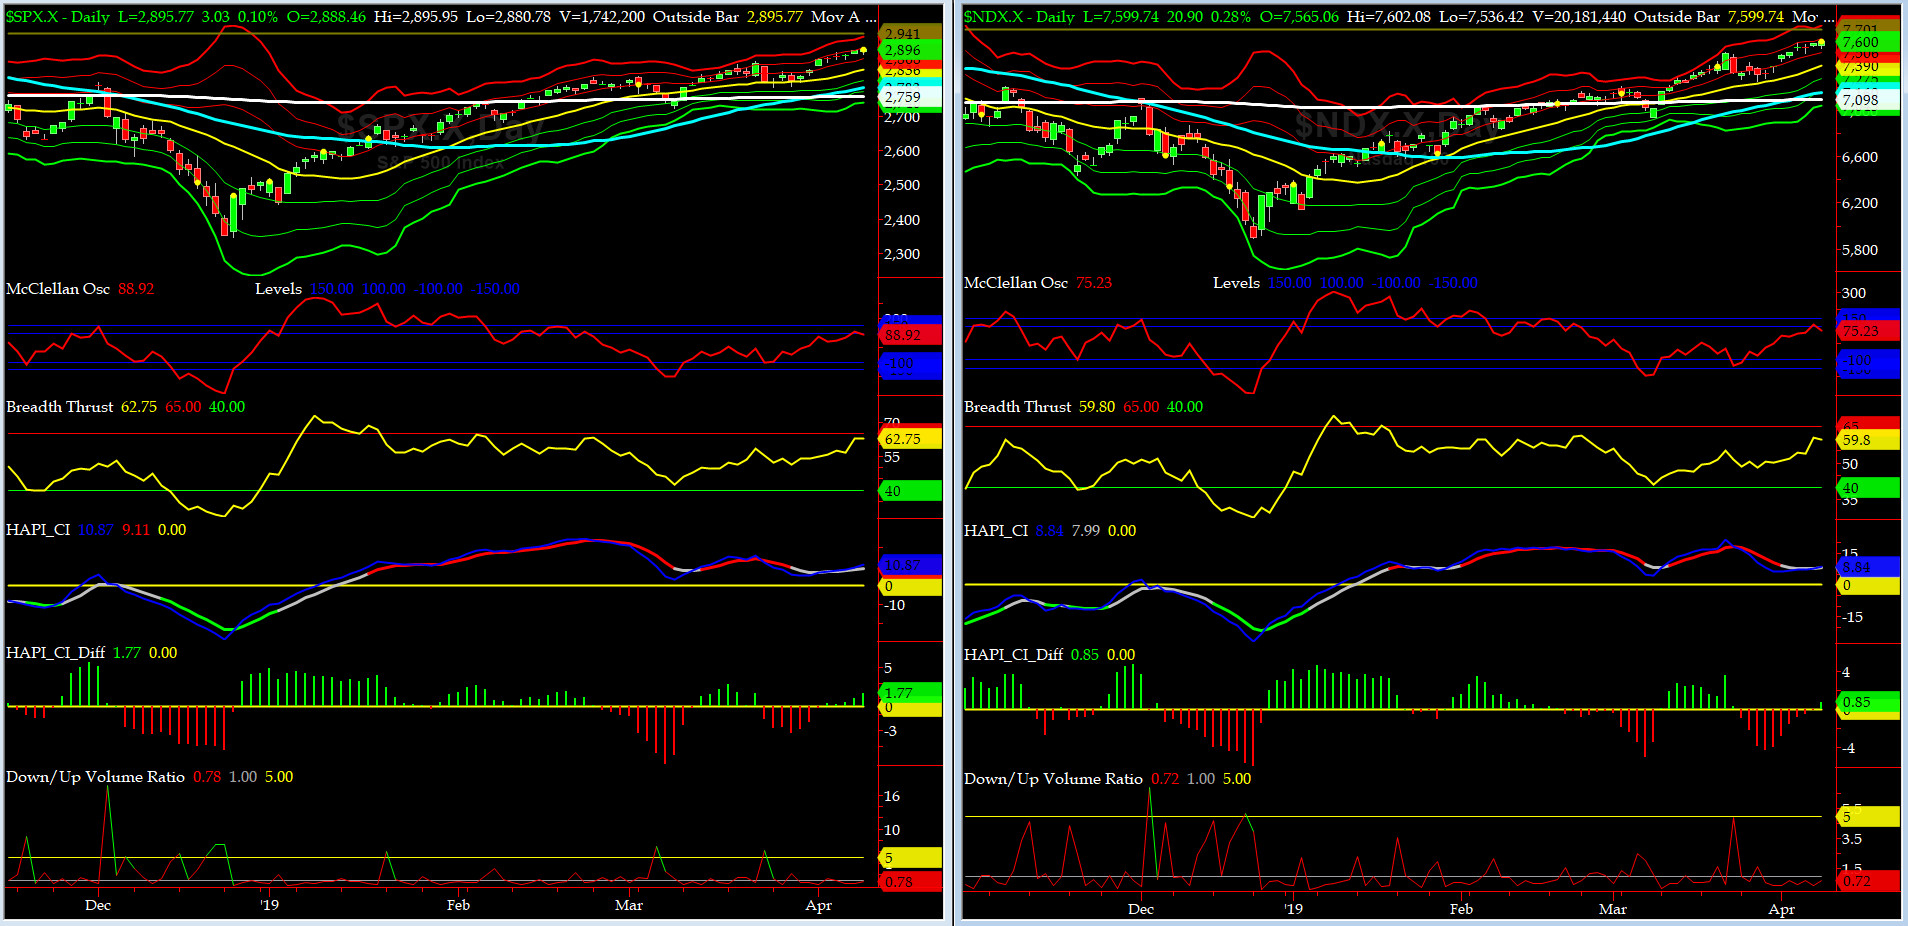
NYSE McClellan Oscillator = +89 (-150 is start of the O/S area; around -275 to -300 area or lower, we go into the �launch-pad� mode; over +150, we are in O/B area)
NYSE Breadth Thrust = 62.7 (40 is considered as oversold and 65 as overbought)
During the past week, both SPX and NDX had a nice run-up. Many shorts gasped for air.
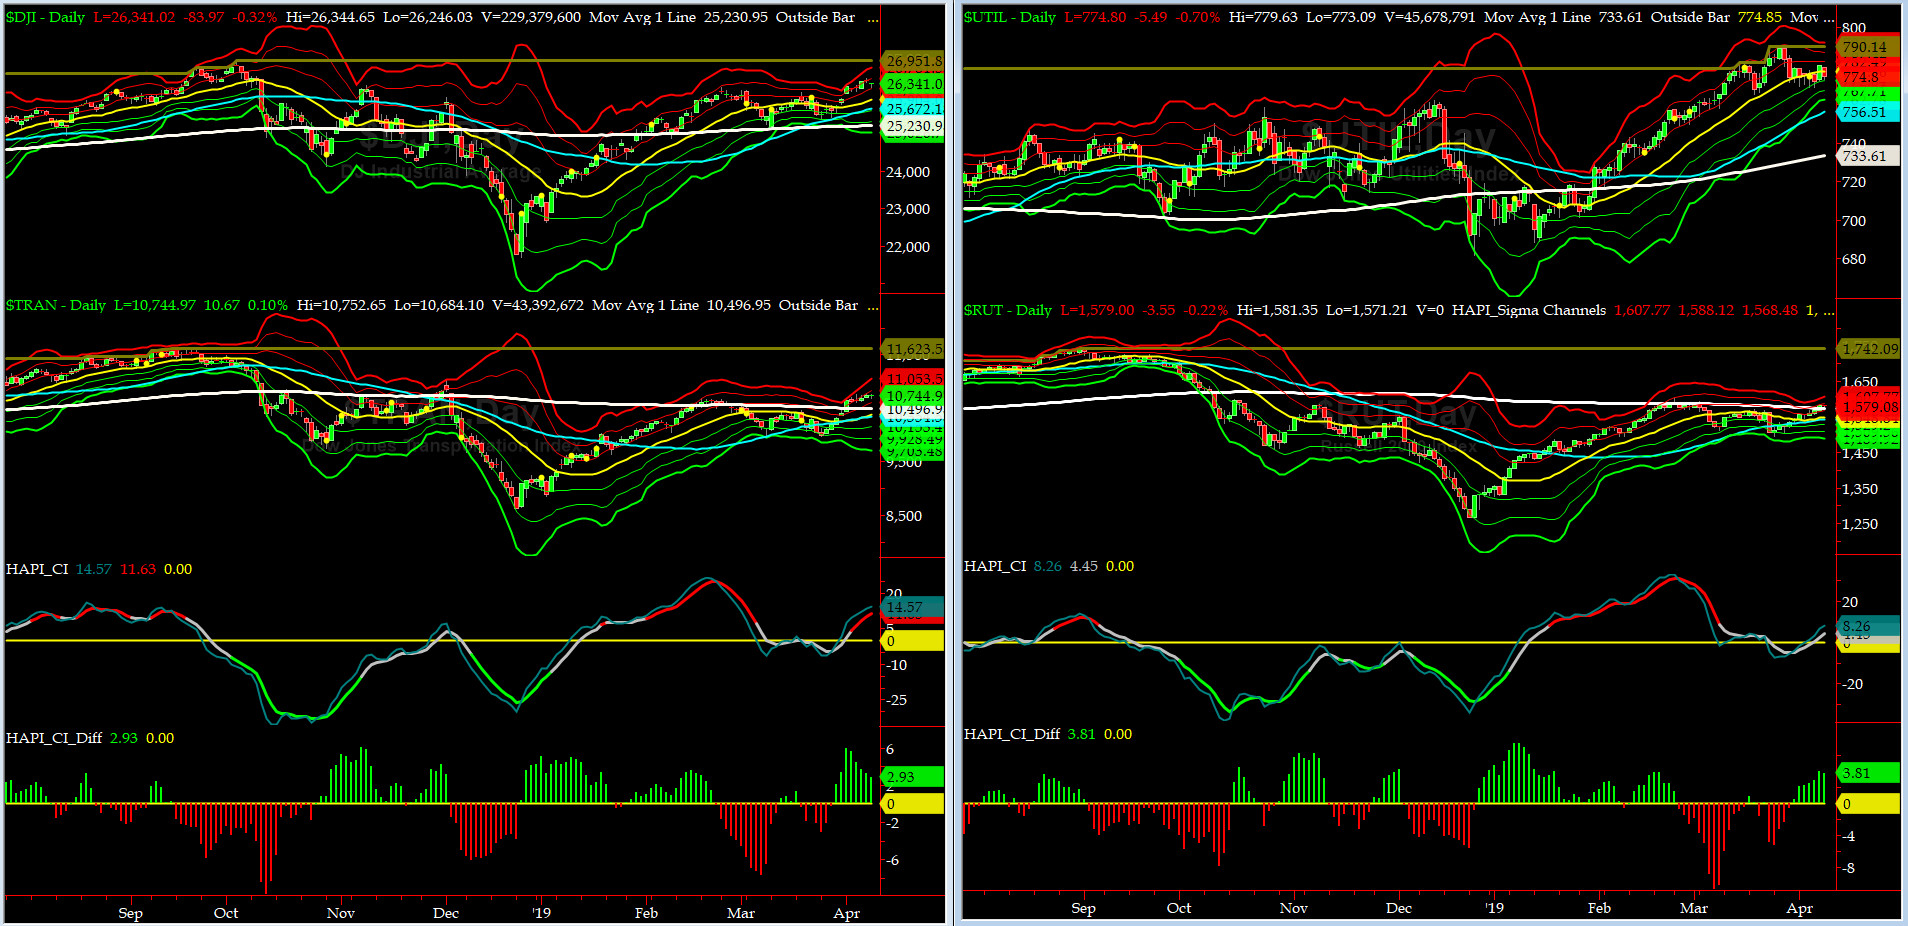
Canaries [in the Coal Mine] Chart for DJ TRAN & RUT Indices
200-Day MA DJ TRAN = 10,496 or 2.4% BELOW DJ TRAN (max observed in last 7 yrs = 20.2%, min = -20.3%)
200-Day MA RUT = 1573 or 0.3% BELOW RUT (max observed in last 7 yrs = 21.3%, min = -22.6%)
DJ Transportation Index (proxy for economic conditions 6 to 9 months hence) started the new quarter with a nice run-up and it is channel breakout. Bulls love that.
Russell 2000 Small Caps Index (proxy for Risk ON/OFF) had slower but more steady breakout but we need to see a close above 1600 to declare RISK is back ON.
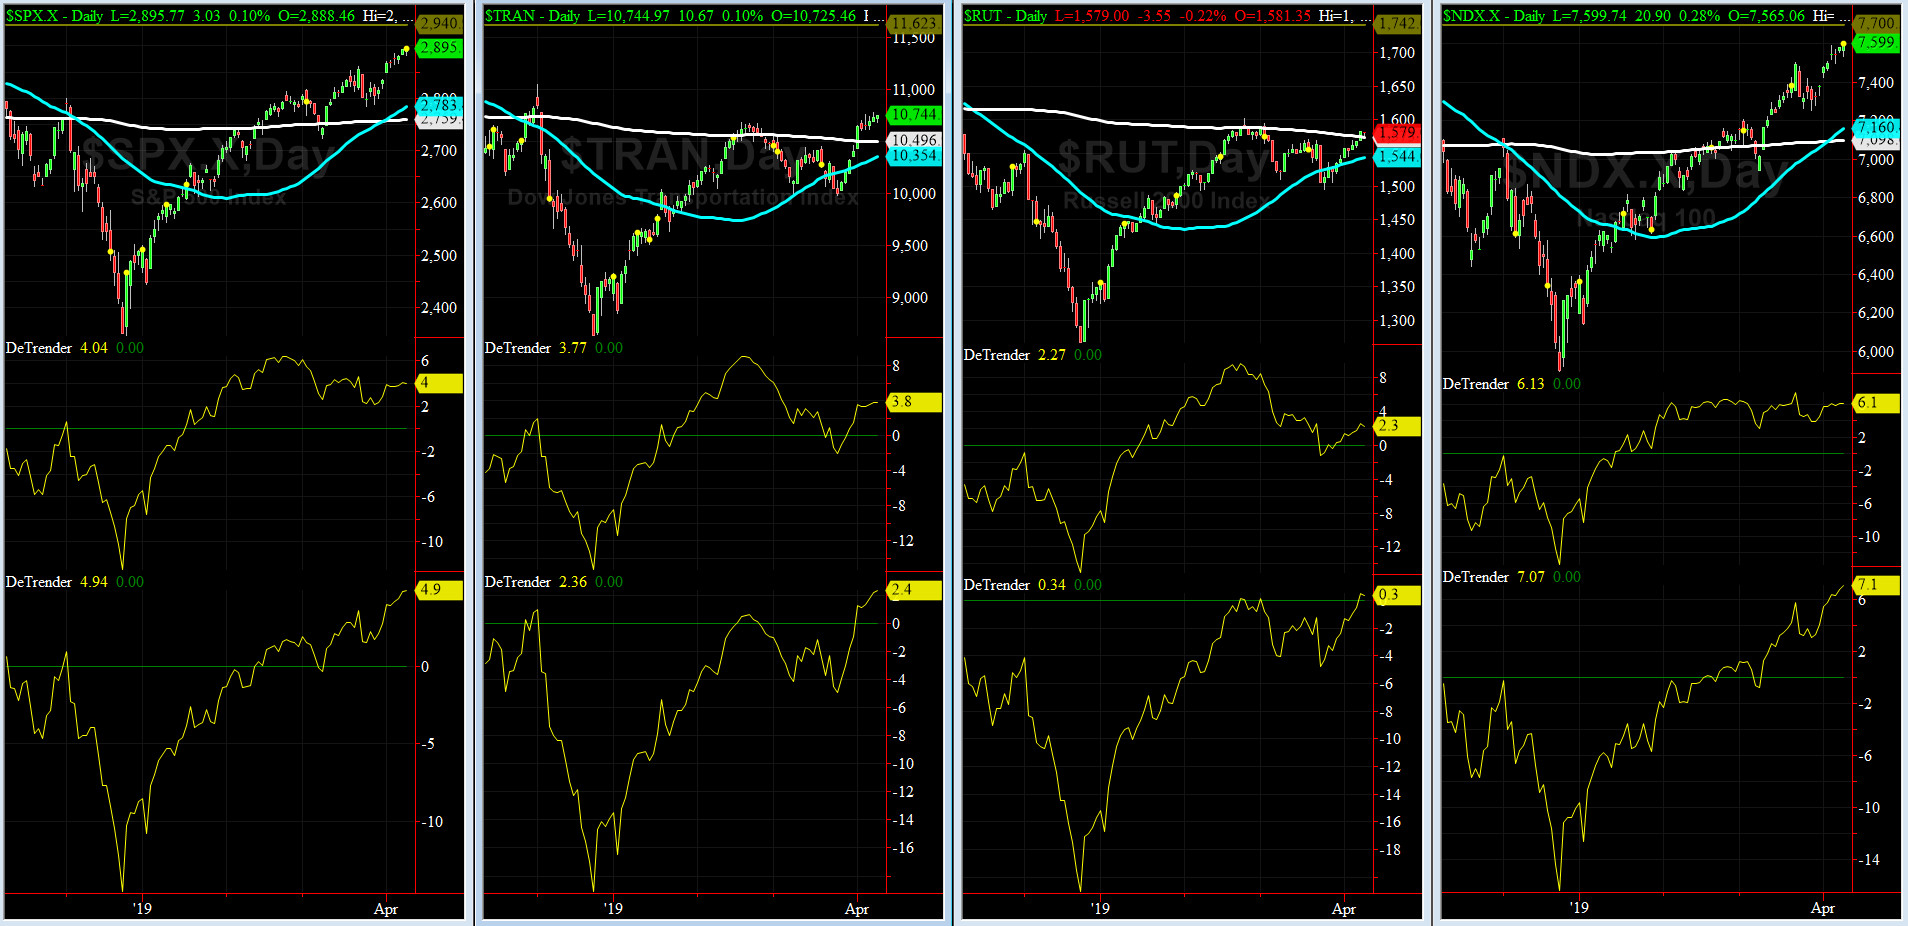
DeTrenders Charts for SPX, NDX, TRAN & RUT Indices
50-Day MA SPX = 2783 or 4% BELOW SPX (max observed in last 7 yrs = +8.6%, min = -9.3%)
200-Day MA SPX = 2759 or 4.9% BELOW SPX (max observed in last 7 yrs = 15.2%, min = -14%)
ALL of our EIGHT DeTrenders are now in the POSITIVE territory. The DeTrenders for DJ Tran & RUT will continue to be harbingers of future price behavior in broad indices.
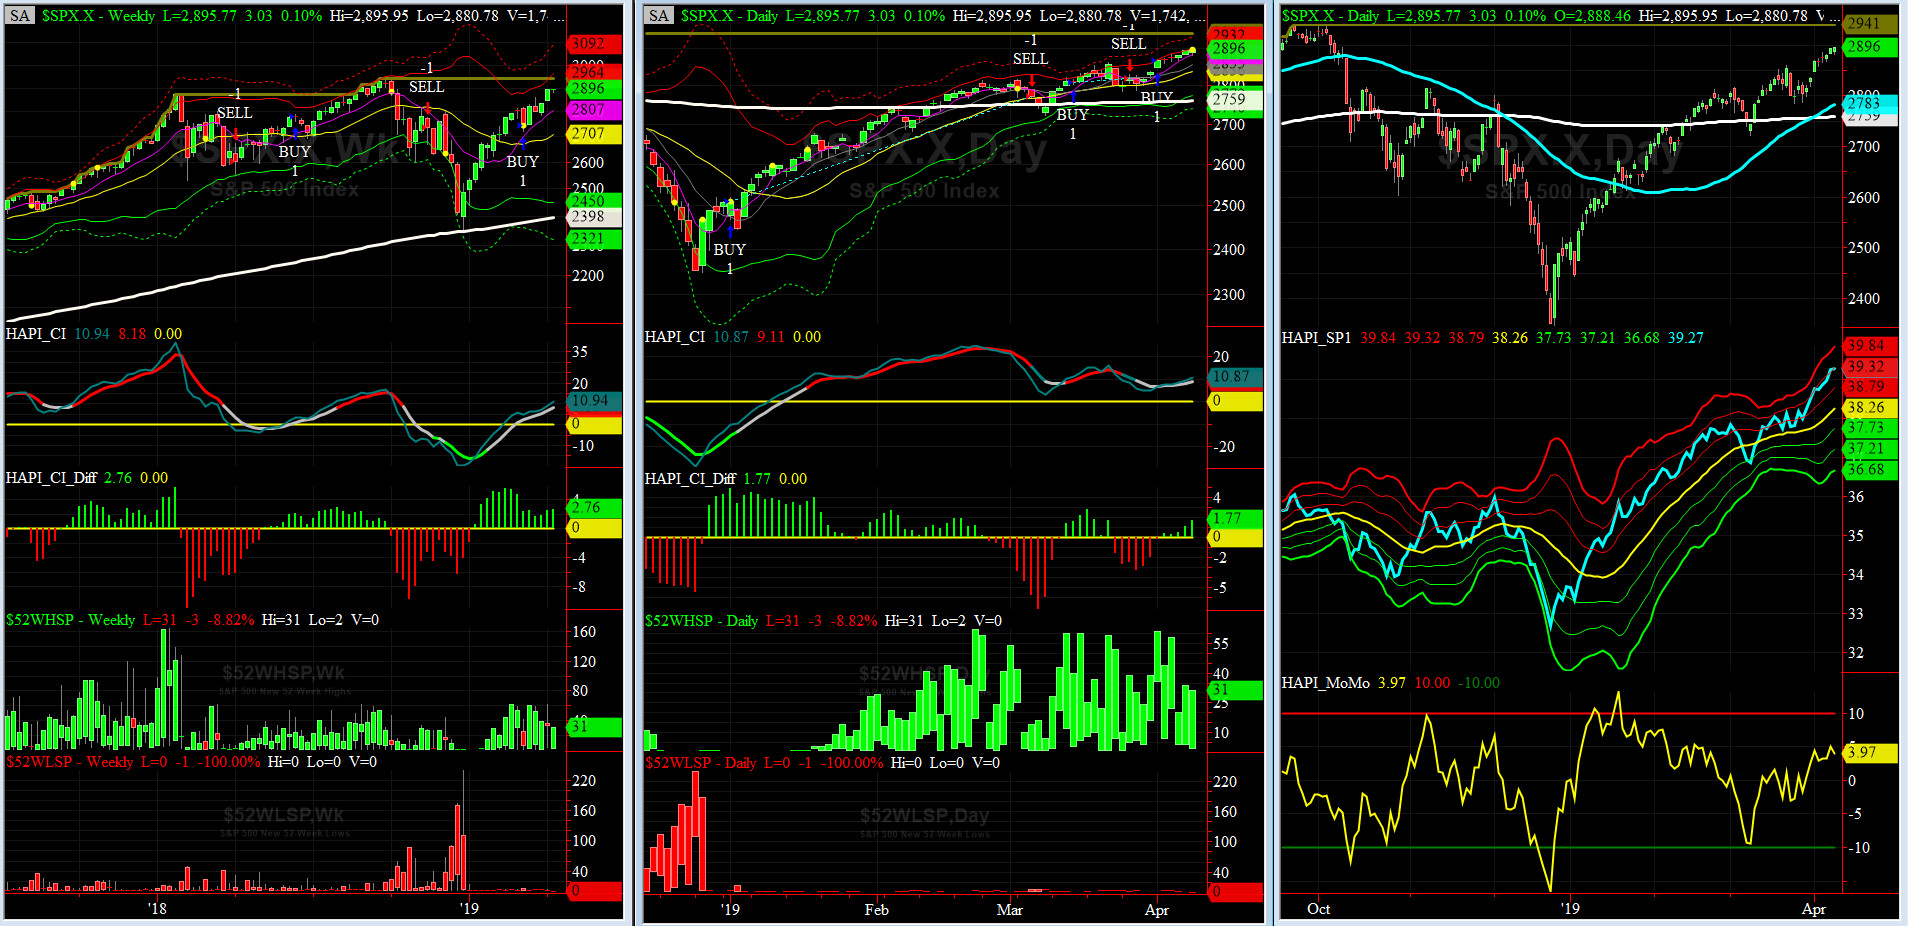
HA_SP1_Momo Chart
WEEKLY Timing Model = on a BUY Signal since Friday, March 8, 2019 CLOSE at 2743
DAILY Timing Model = on a BUY Signal since Monday, April 1, 2019 CLOSE at 2768
Max SPX 52wk-highs reading last week = 61 (over 120-140, the local maxima is in)
Max SPX 52wk-Lows reading last week = 4 (over 40-60, the local minima is in)
HA_SP1 closed near its +2 sigma channels
HA_Momo = +4 (reversals most likely occur above +10 or below -10)
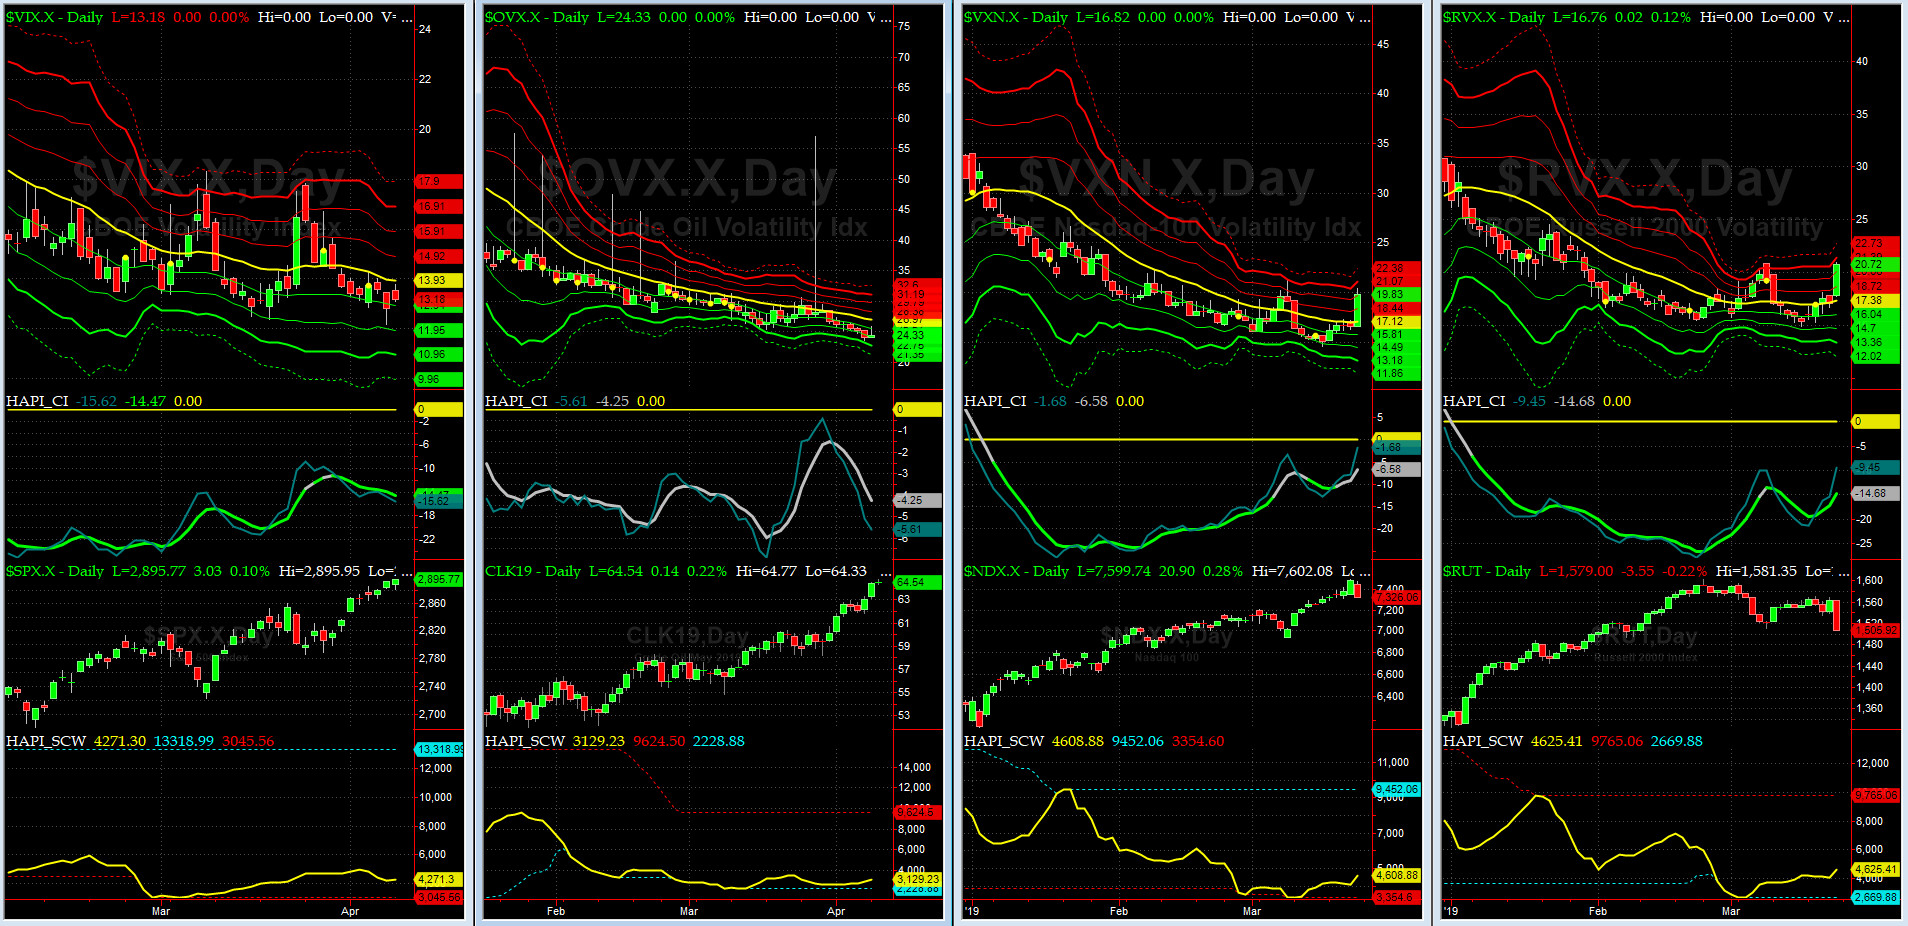
Vol of the Vols Chart
Spot VIX currently stands at 13.6, at about its zero sigma (remember it's the VIX volatility pattern aka "its sigma channels" that matters, and not the level of VIX itself (this is per Dr. Robert Whaley, a great mentor and inventor of original VIX, now called VXO). VIX usually peaks around a test of its +4 sigma).
No signal here.....
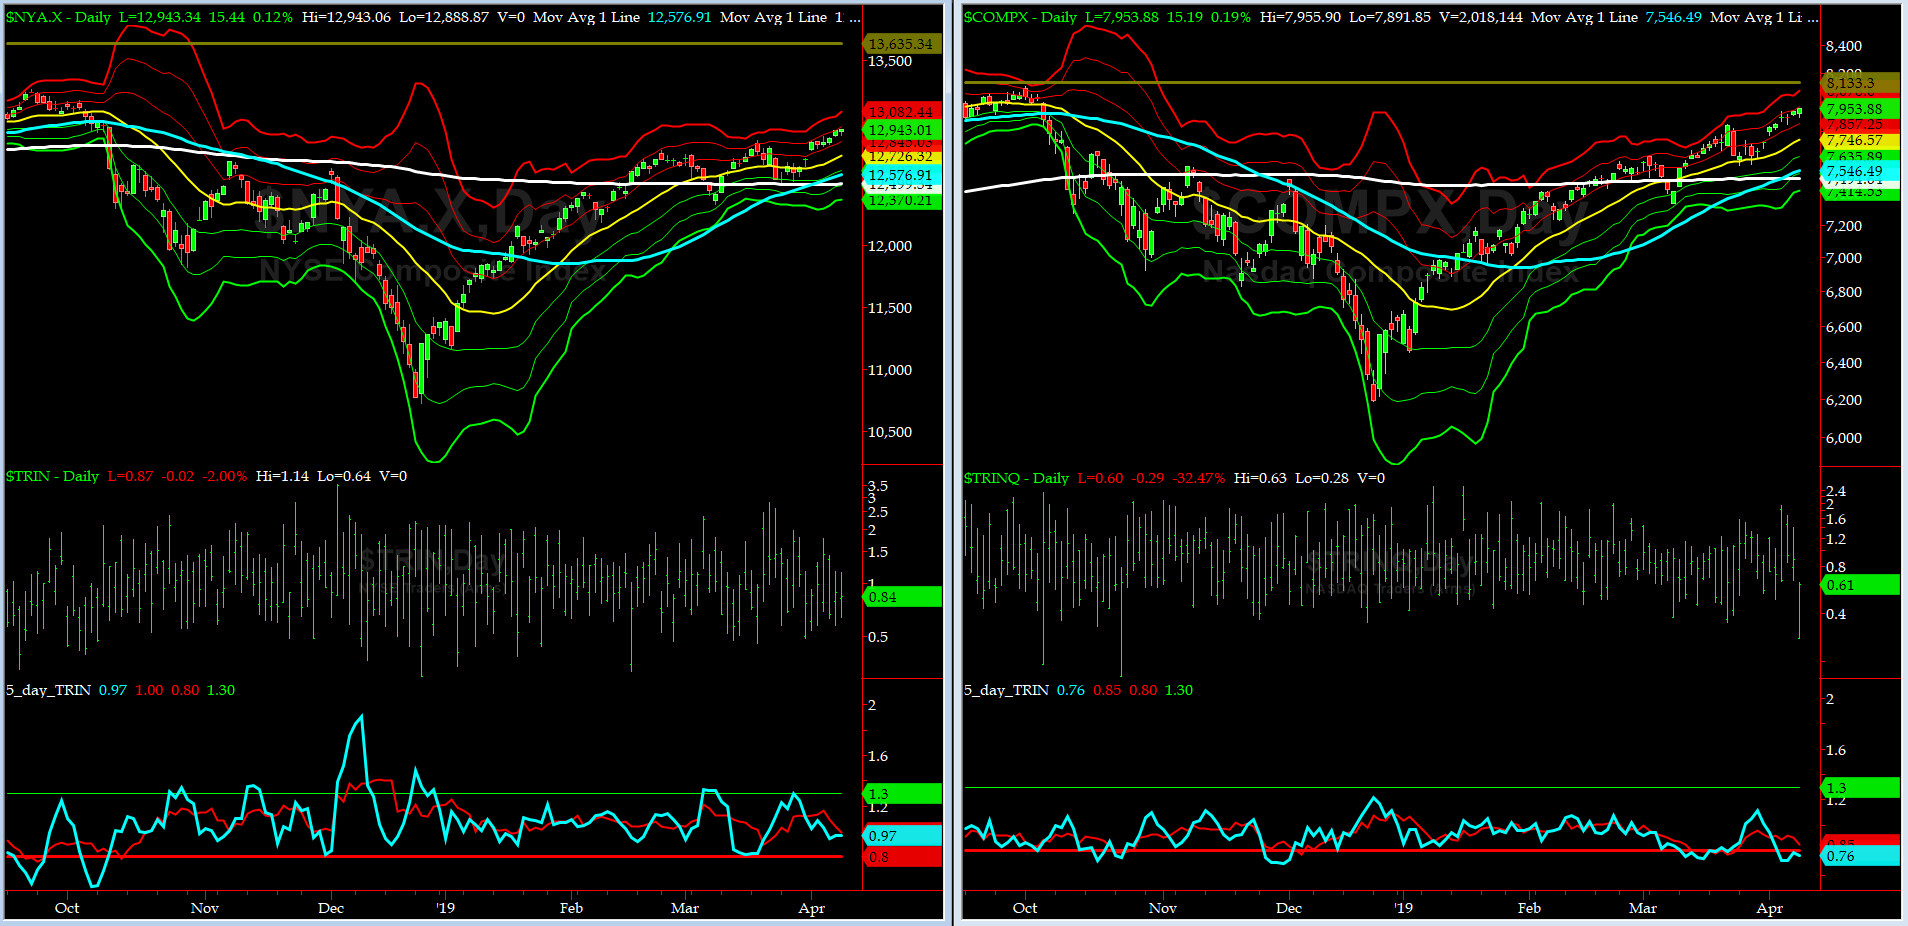
5-day TRIN & TRINQ Charts
NYSE 5-day TRIN is in NEUTRAL zone while NASDAQ 5-day TRINQ is in a SELL zone now.

Components of SPX above their respective 200-day MA Chart
This scoring indicator rose very fast to 70.7% as it punched thru our previous targets near 67%. Next level to watch for is around 73%-75%.
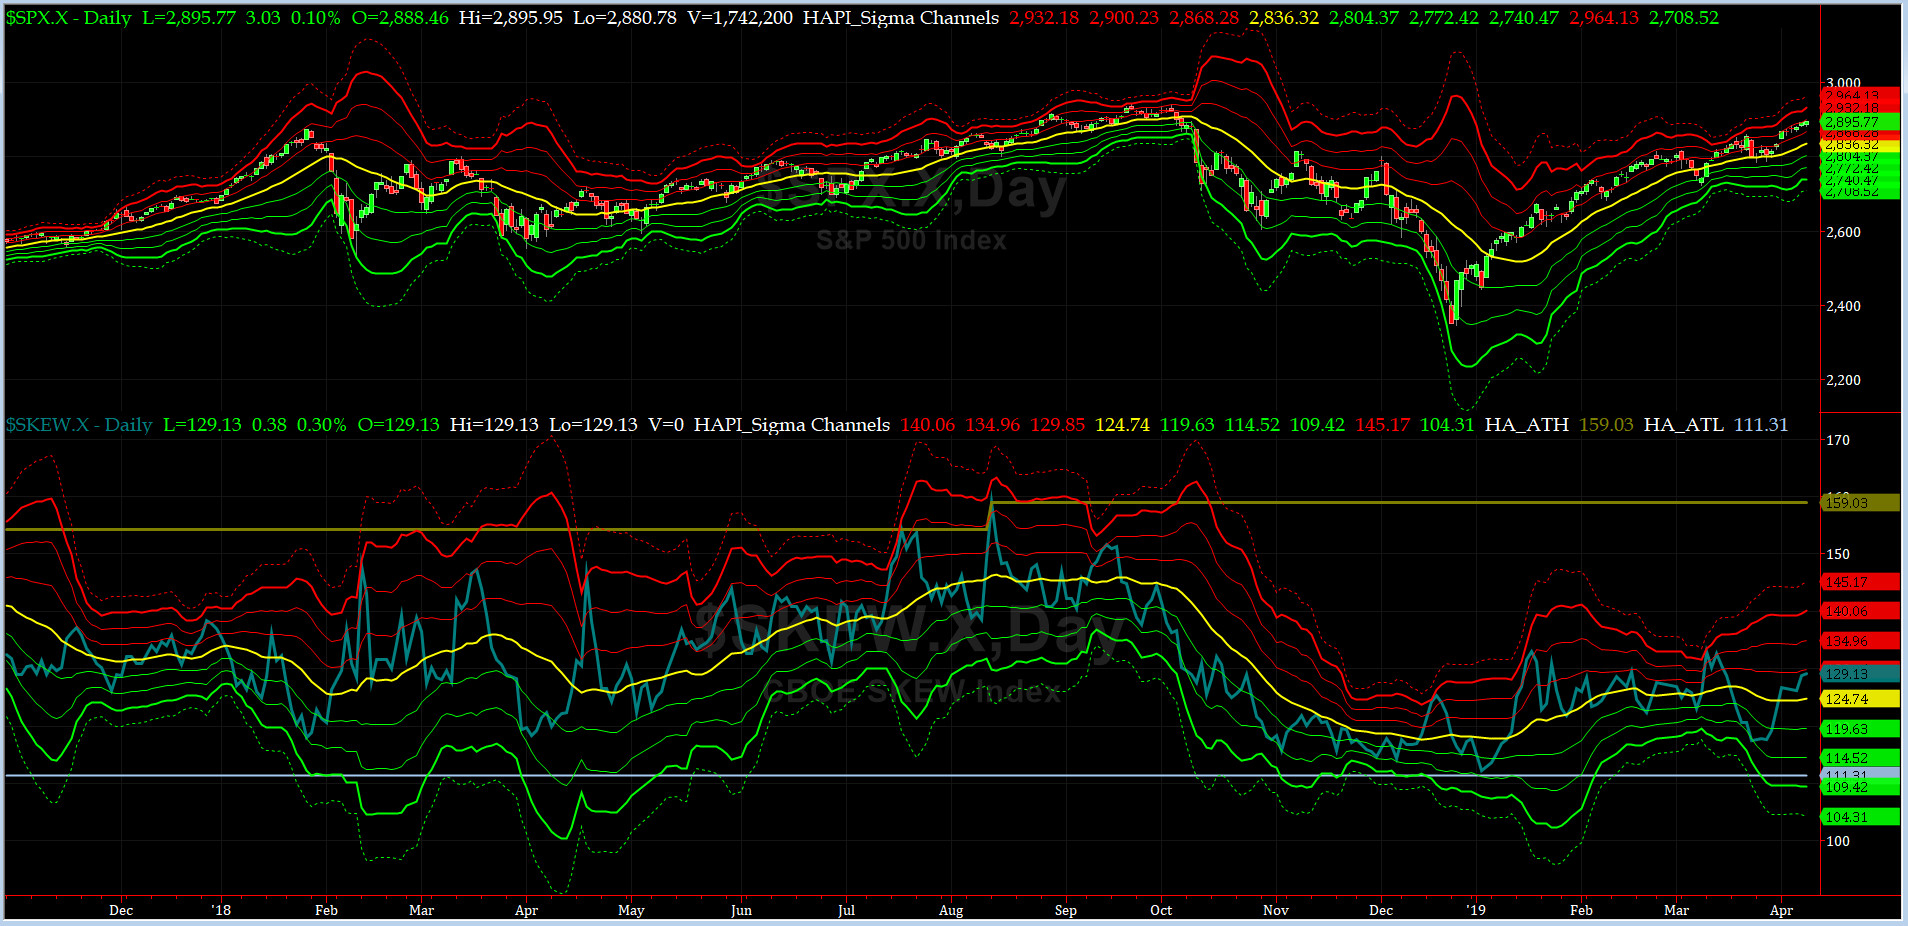
SPX SKEW (Tail Risk) Chart
On Friday, SPX SKEW (Tail Risk) closed near 129, now about its +1 sigma (normal = 120-125, range 100-150).
All quiet on the Eastern & Mid-Western Fronts? YES, this is according to our beloved HRH Capt Tiko, KCPE....
How to interpret the value of SPX SKEW? (from CBOE white paper on SKEW)

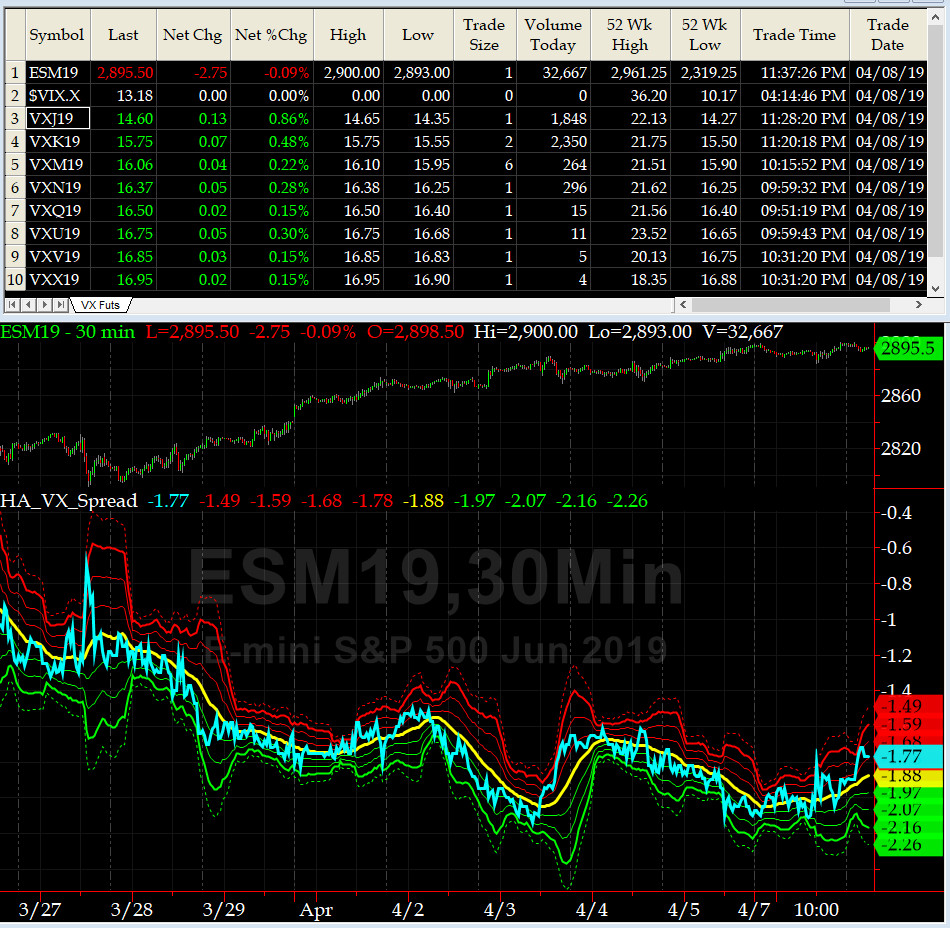
3-month VIX Futures Spread(VX) Chart
This popular timing indicator, (now long APR19, & short JUL19 VIX Futures) closed the week at -1.90 which is NEUTRAL here.
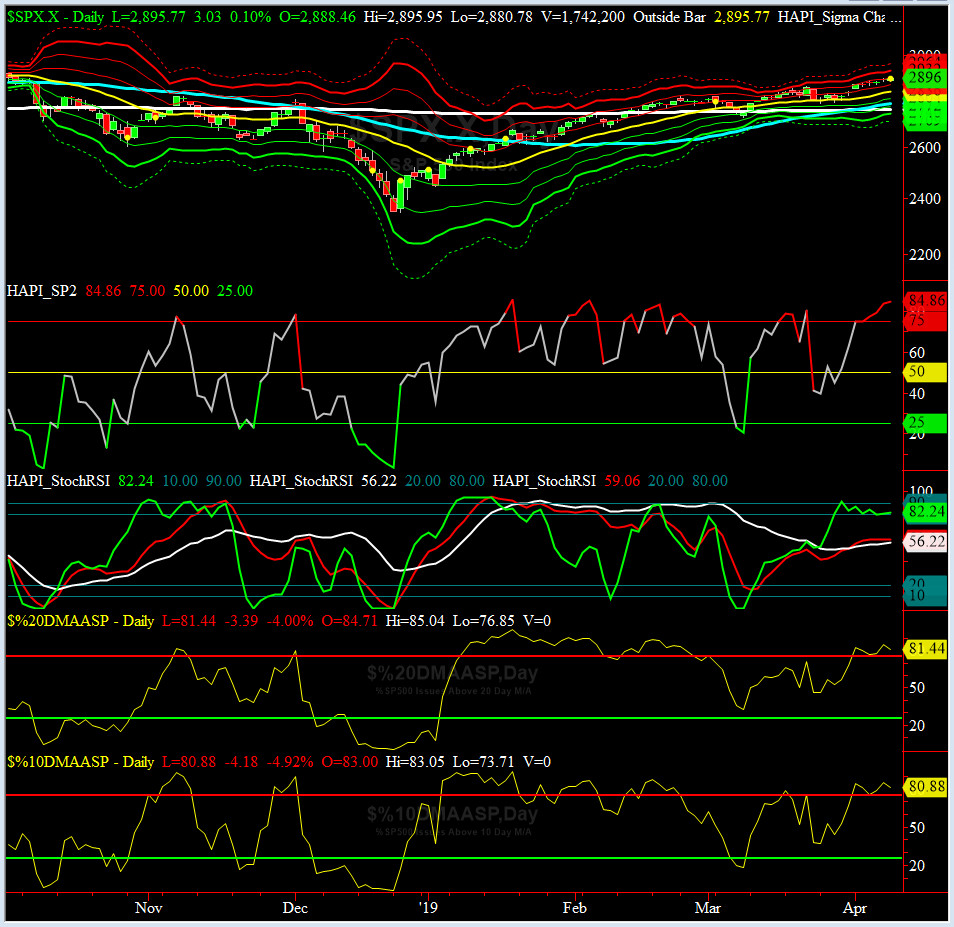
HA_SP2 Chart
HA_SP2 = 63 (Buy signal <= 25, Sell Signal >= 75)
Our coveted SP2 prop indicator went from 75 to 82 this past week. We are in OVERBOUGHT zone now.
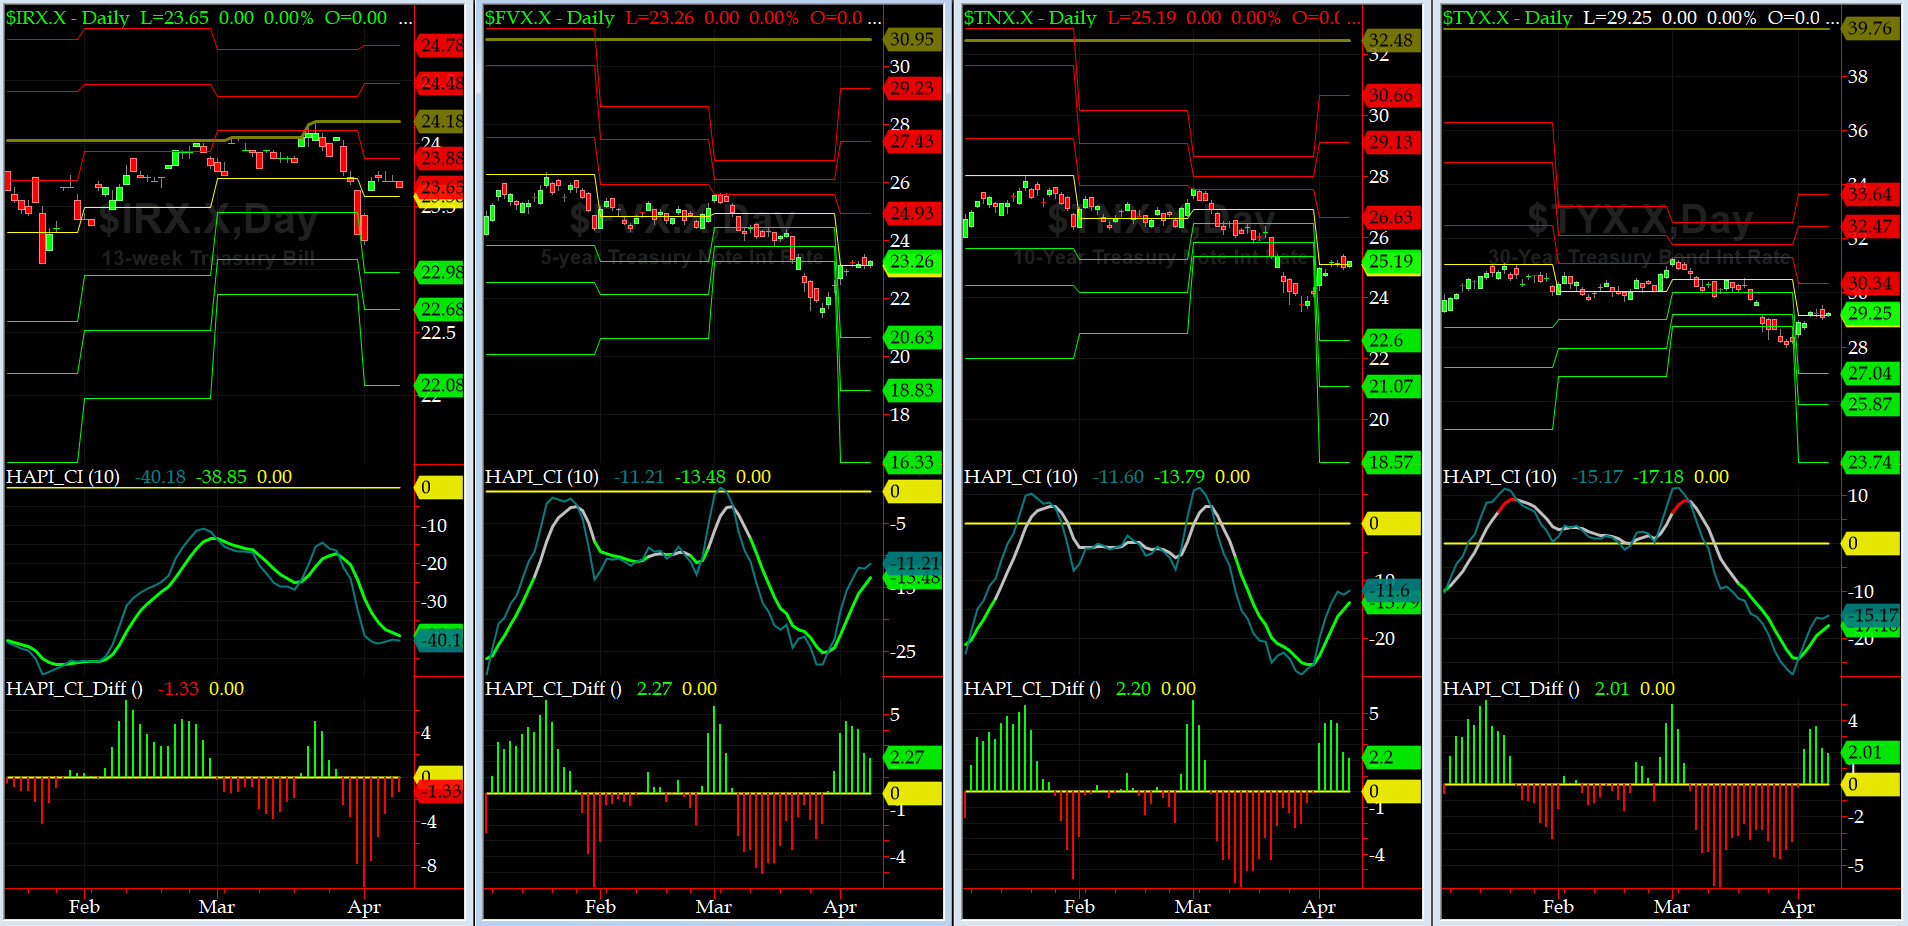
US Treasury T-Notes & T-Bonds Yields Chart
The Yield Curve went nowhere fast but Maury's pain is no less. Maury wrote to Grumpino to be nominated as a Fed Governor. His argument, we are told is that he can't be worst than the two clowns under consideration now (Moore & Caine). LOL !!
Fari Hamzei
|


 Proactive Market Timing