
|
 |
 |
 |
 |
 |
 |
 |
 |
 Proactive Market Timing Proactive Market Timing
|
|
|
Most Recent PMT vs SPX Performance Chart

|
|
|
|
Thursday, May 9, 2019, 1605ET
Notice of Change of Bias with Timer Digest
Dear Jim,
Most of our short prop indicators are in oversold zones, and therefore, we are going from FLAT SPX to LONG SPX as of the Close of today�. SPX is at ~ 2870.72
Cheers�..
Fari Hamzei
|
|
|
|
|
|
Tuesday, May 7, 2019, 1909ET
Notice of Change of Bias with Timer Digest
Dear Jim,
We are going FLAT SPX as of today�s Close of 2,884.05 for a cool 61+ handles in just two trading sessions�..
Fari Hamzei
|
|
|
|
|
|
Monday, May 6, 2019, 1025ET
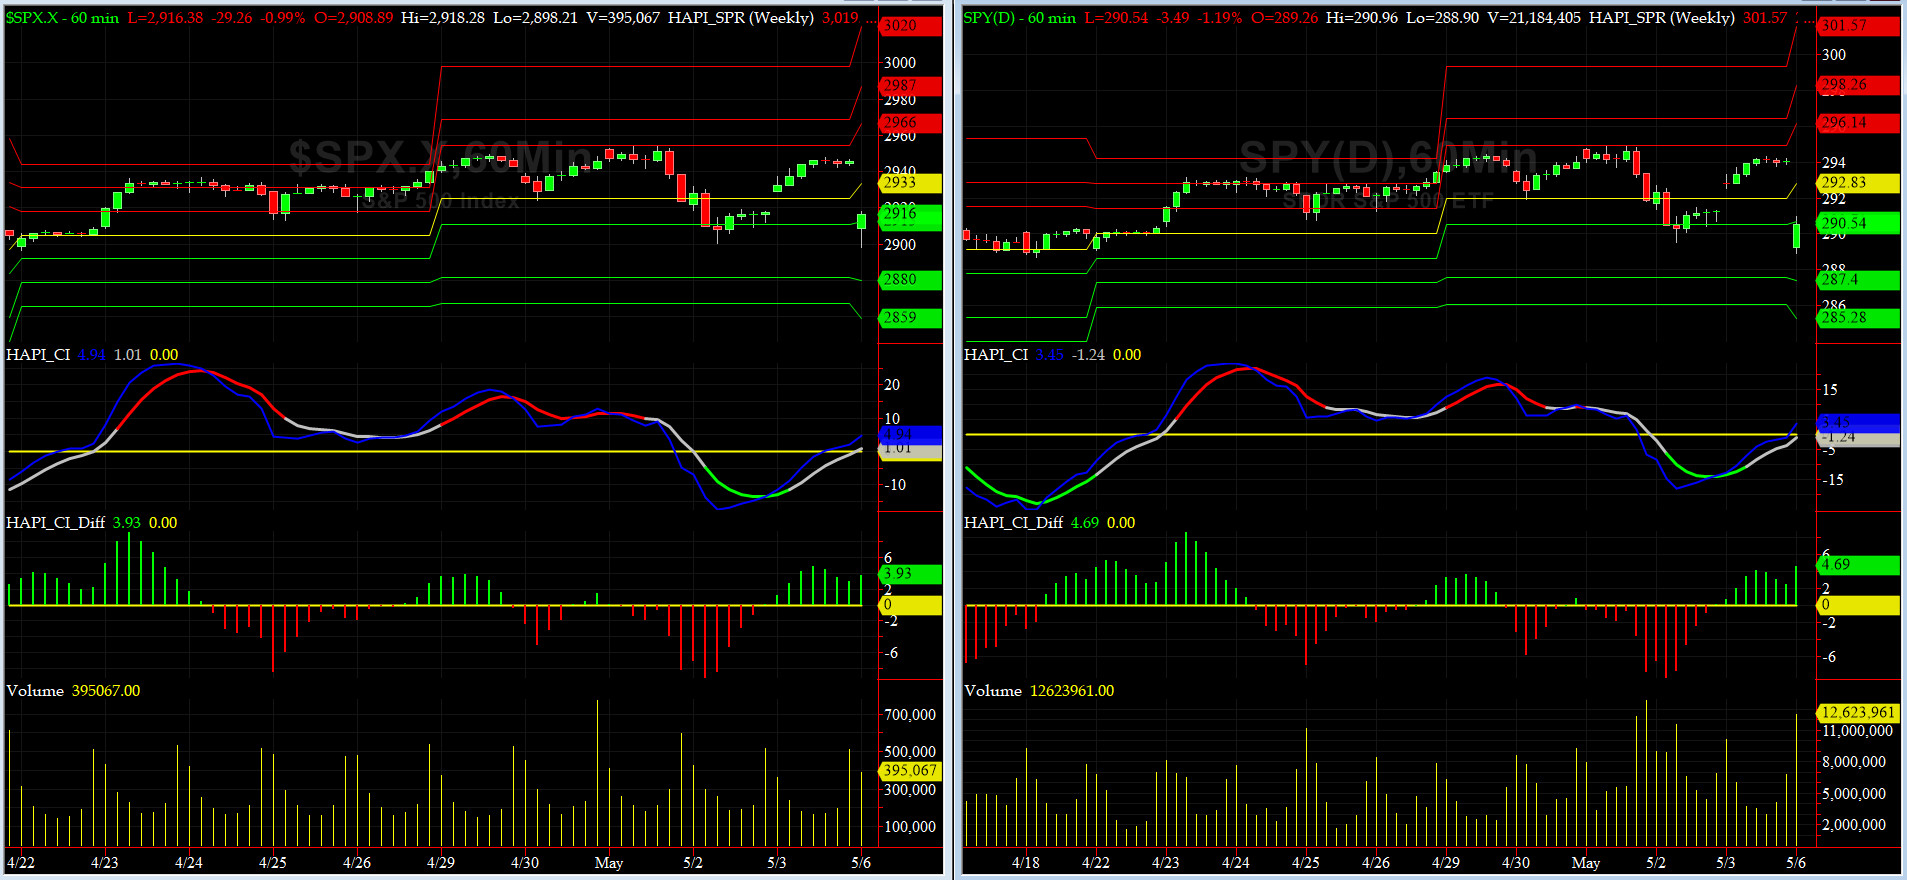
Companion Chart for Market Bias Review, Issue #289
|
|
|
|
|
|
Monday, May 6, 2019, 1020ET
Market Bias for Issue #289
Our current Market Bias with Timer Digest is SHORT SPX as of MAY 3 at 2946
Our previous Market Bias was FLAT SPX as of APR 26 at 2940
Here are the trade parameters for this week:
SPX Money Management Stop for 100% of our position = 2930
SPX BreakEven Stop (Current Price) for last 20% of our position = 2919
SPX Primary Profit Target for first 80% of our position = 2875
SPX Secondary Profit Target for last 20% of our position = 2855
|
| Action |
Asset |
Expiration |
Strike |
Option |
| BUY |
SPY |
Friday MAY 24 |
290 |
Puts |
| SELL SHORT |
SPY |
Friday MAY 24 |
285 |
Puts |
| You need to execute both legs and hold it as a Put-Spread.
|
Note A:
Once the Primary Profit Target has been reached, traders are advised to close 80% of their position in order to lock in profits. The remaining balance can be carried over with a BreakEven STOP, based on the SPX level at the time of entry, in order to make the trade a zero-risk trade with the final position running to reach the Secondary Profit Target.
Once either Secondary Profit or Money Management (BreakEven STOP after the 80% peel-off) is hit, our Option/ETF trade for that week is over. Go to Cash and wait for the next PMT Issue.
Note B:
When we change our Market Bias with Timer Digest, You need to go FLAT asap. With PMT Pro, that is before the Close that day and with the basic PMT, at the open of the next day. The following trading day, we will issue new SPX targets and a new SPY options trade, as long our new market bias with Timer Digest is NOT flat.
Fari Hamzei
|
|
|
|
|
|
Monday, May 6, 2019, 0835ET
Market Timing Charts, Analysis & Commentary for Issue #289
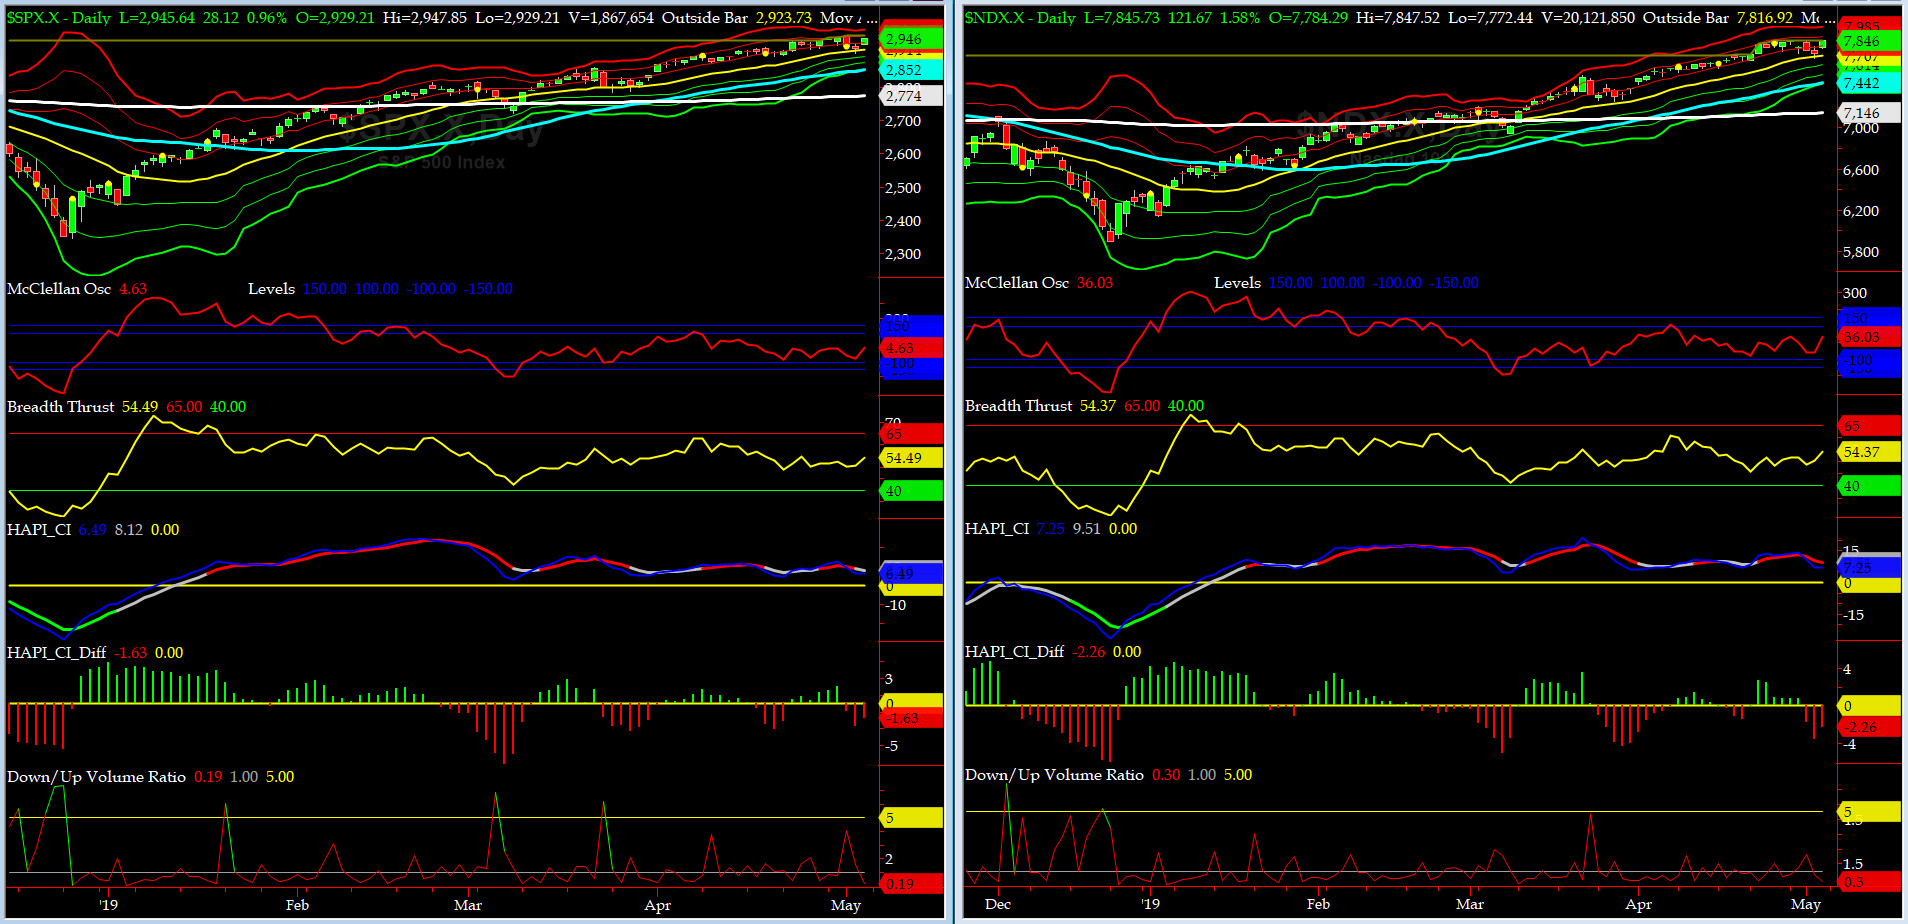
Timer Charts of S&P-500 Cash Index (SPX) + NASDAQ-100 Cash Index (NDX)
Most recent S&P-500 Cash Index (SPX): 2946 up +41 (+1.4%) for the two weeks ending on Friday, May 3, 2019, which closed near its +2 sigma.
DJIA ALL TIME INTRADAY HIGH = 26951 (reached on Wednesday, October 3, 2018)
DJ TRAN ALL TIME INTRADAY HIGH = 11623 (reached on Friday, September 14, 2018)
SPX ALL TIME INTRADAY HIGH = 2954 (reached on Wednesday, May 1, 2019)
NDX ALL TIME INTRADAY HIGH = 7852 (reached on Wednesday, May 1, 2019)
RUT ALL TIME INTRADAY HIGH = 1742 (reached on Friday, August 31, 2018)
Current DAILY +2 Sigma SPX = 2954 with WEEKLY +2 Sigma = 3042
Current DAILY 0 Sigma SPX = 2914 with WEEKLY 0 Sigma = 2747
Current DAILY -2 Sigma SPX = 2873 with WEEKLY -2 Sigma = 2453
NYSE McClellan Oscillator = +5 (-150 is start of the O/S area; around -275 to -300 area or lower, we go into the �launch-pad� mode; over +150, we are in O/B area)
NYSE Breadth Thrust = 54.5 (40 is considered as oversold and 65 as overbought)
During the past week, SPX and NDX new ATHs while the McClellan Osc and Breadth Thrust meandered. more later.
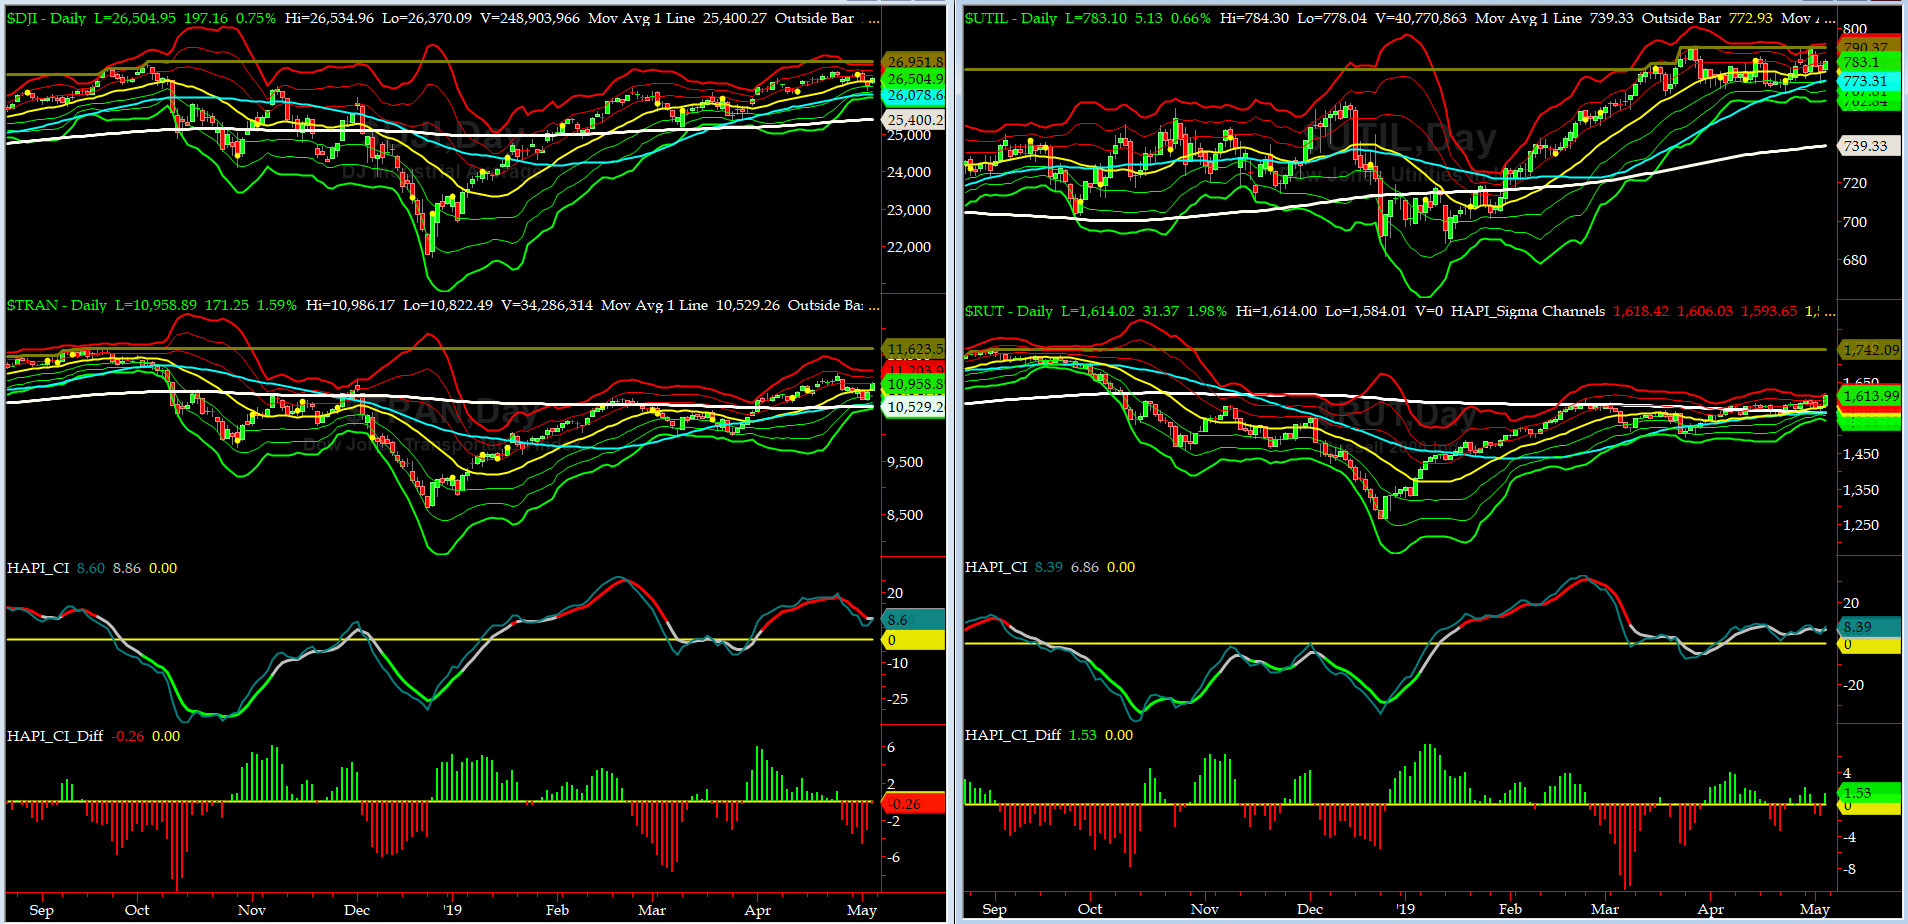
Canaries [in the Coal Mine] Chart for DJ TRAN & RUT Indices
200-Day MA DJ TRAN = 10,555 or 4.1% BELOW DJ TRAN (max observed in last 7 yrs = 20.2%, min = -20.3%)
200-Day MA RUT = 1565 or 3.2% BELOW RUT (max observed in last 7 yrs = 21.3%, min = -22.6%)
DJ Transportation Index (proxy for economic conditions 6 to 9 months hence) sold off last week till Wednesday night and then reversed up. This is a MUST WATCH index during this week.
Russell 2000 Small Caps Index (proxy for Risk ON/OFF) finally put in a breakout. Another MUST WATCH index during this week.
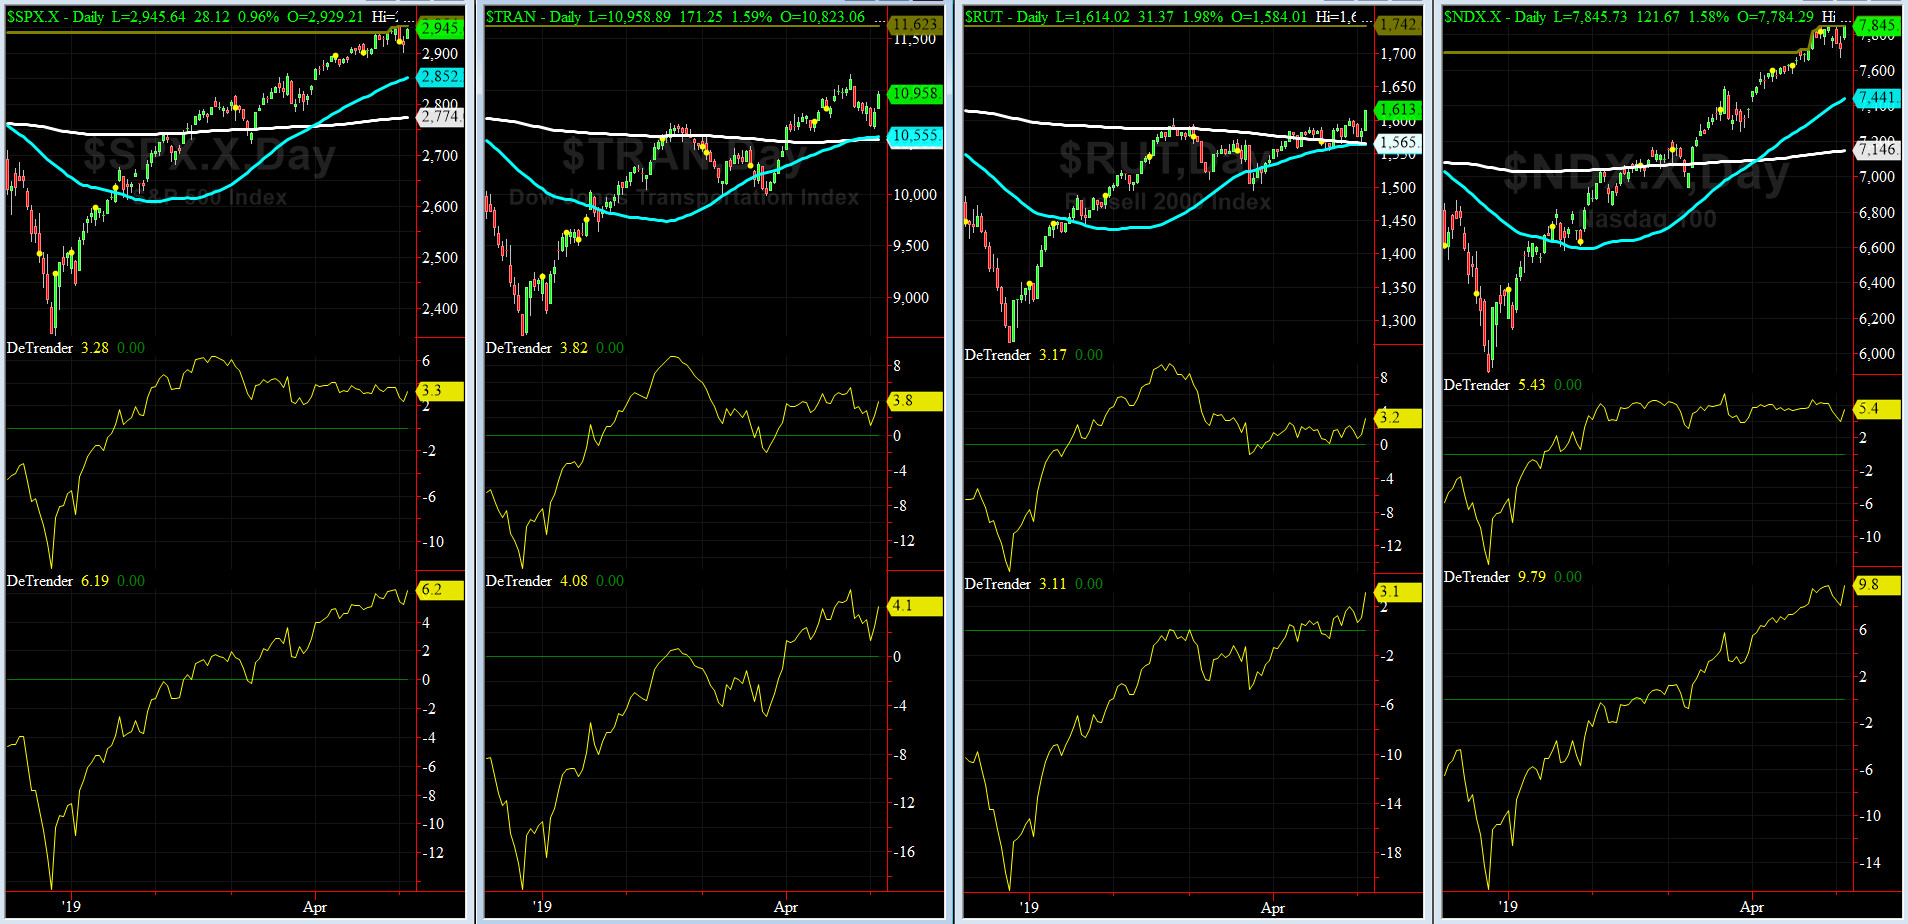
DeTrenders Charts for SPX, NDX, TRAN & RUT Indices
50-Day MA SPX = 2852 or 3.3% BELOW SPX (max observed in last 7 yrs = +8.6%, min = -9.3%)
200-Day MA SPX = 2774 or 6.2% BELOW SPX (max observed in last 7 yrs = 15.2%, min = -14%)
ALL of our EIGHT DeTrenders are in the POSITIVE territory. The DeTrenders for DJ Tran & RUT will continue to be harbingers of future price behavior in broad indices.
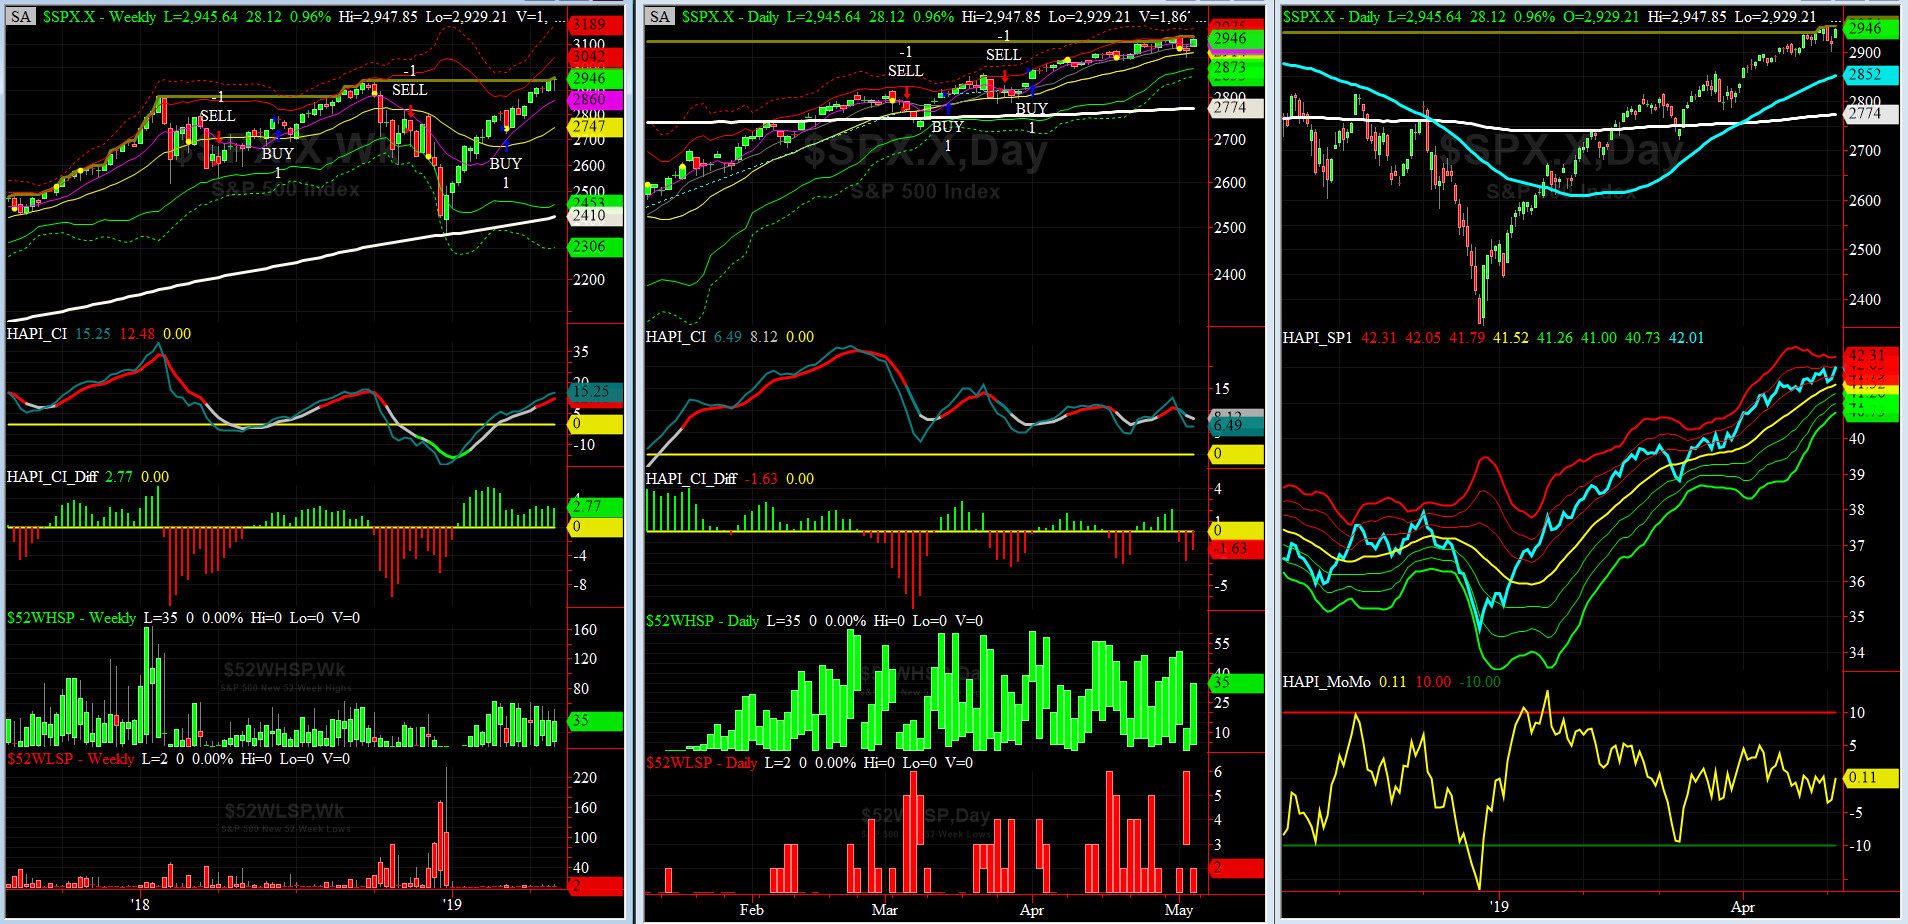
HA_SP1_Momo Chart
WEEKLY Timing Model = on a BUY Signal since Friday, March 8, 2019 CLOSE at 2743
DAILY Timing Model = on a BUY Signal since Monday, April 1, 2019 CLOSE at 2768
Max SPX 52wk-highs reading last week = 51 (over 120-140, the local maxima is in)
Max SPX 52wk-Lows reading last week = 6 (over 40-60, the local minima is in)
HA_SP1 closed near its +2 sigma channels
HA_Momo = +0.11 (reversals most likely occur above +10 or below -10)
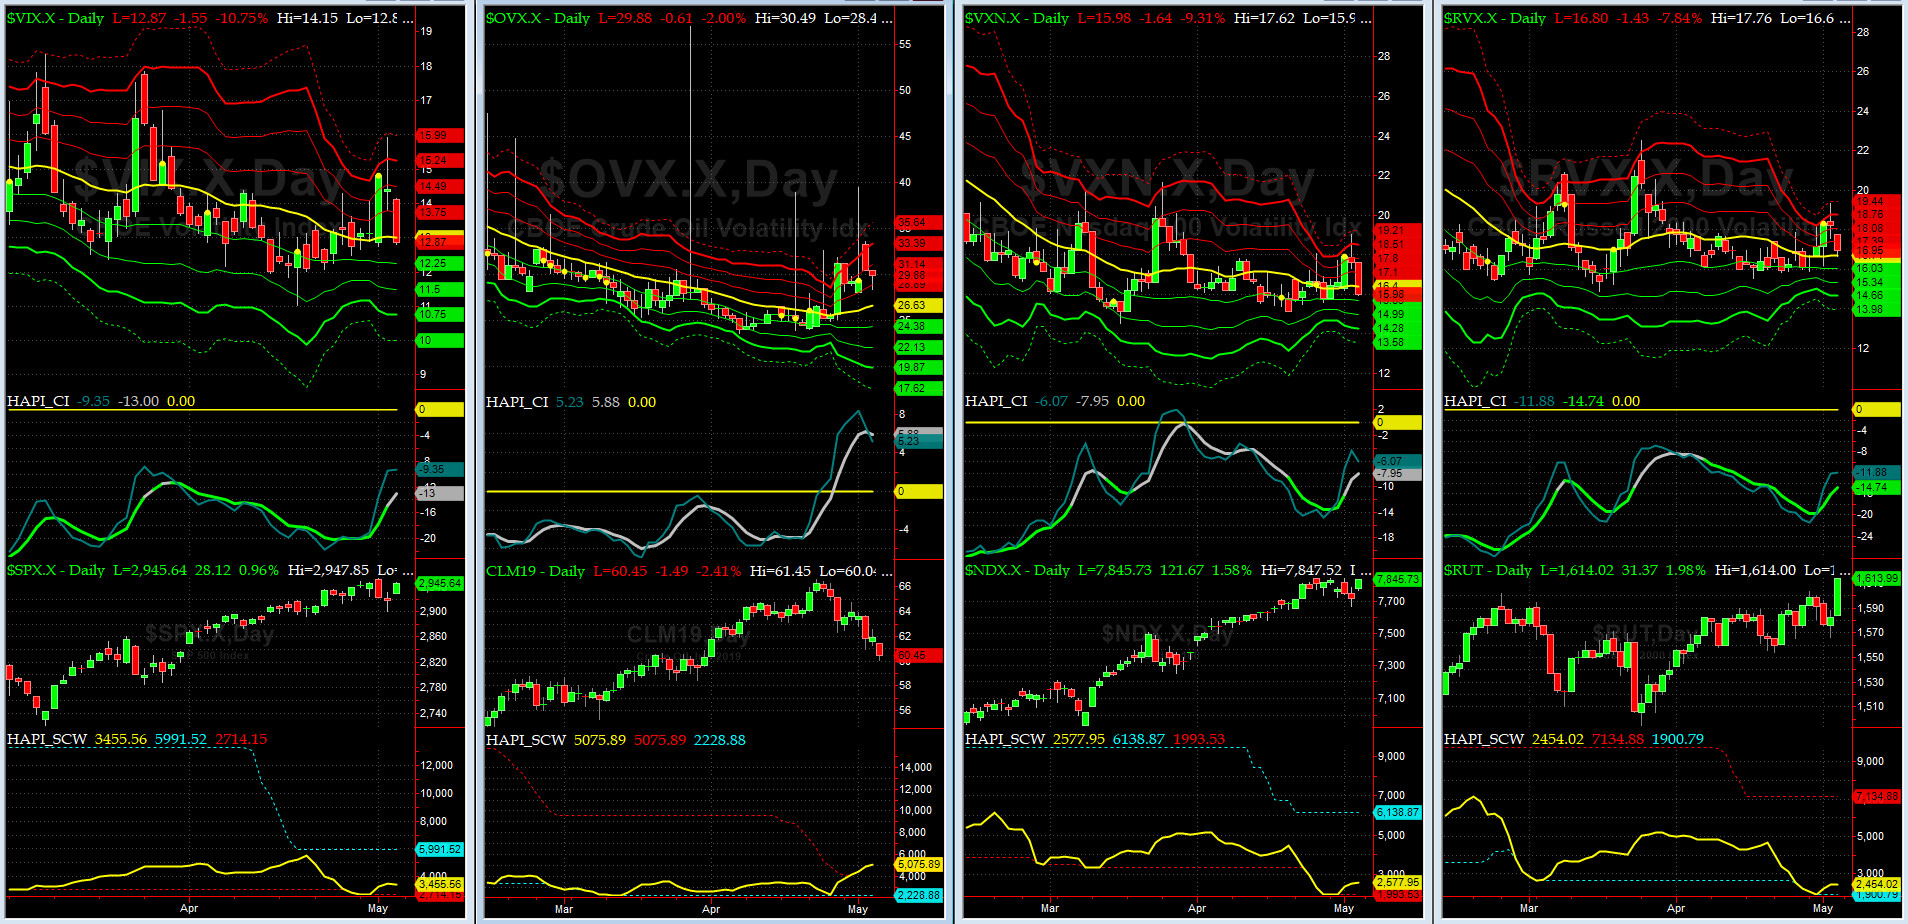
Vol of the Vols Chart
Spot VIX stood at 12.9 Friday night, at about its zero sigma (remember it's the VIX volatility pattern aka "its sigma channels" that matters, and not the level of VIX itself (this is per Dr. Robert Whaley, a great mentor and inventor of original VIX, now called VXO). VIX usually peaks around a test of its +4 sigma).
No signal here..... read more Rumi? @Capt_Tiko says YES!
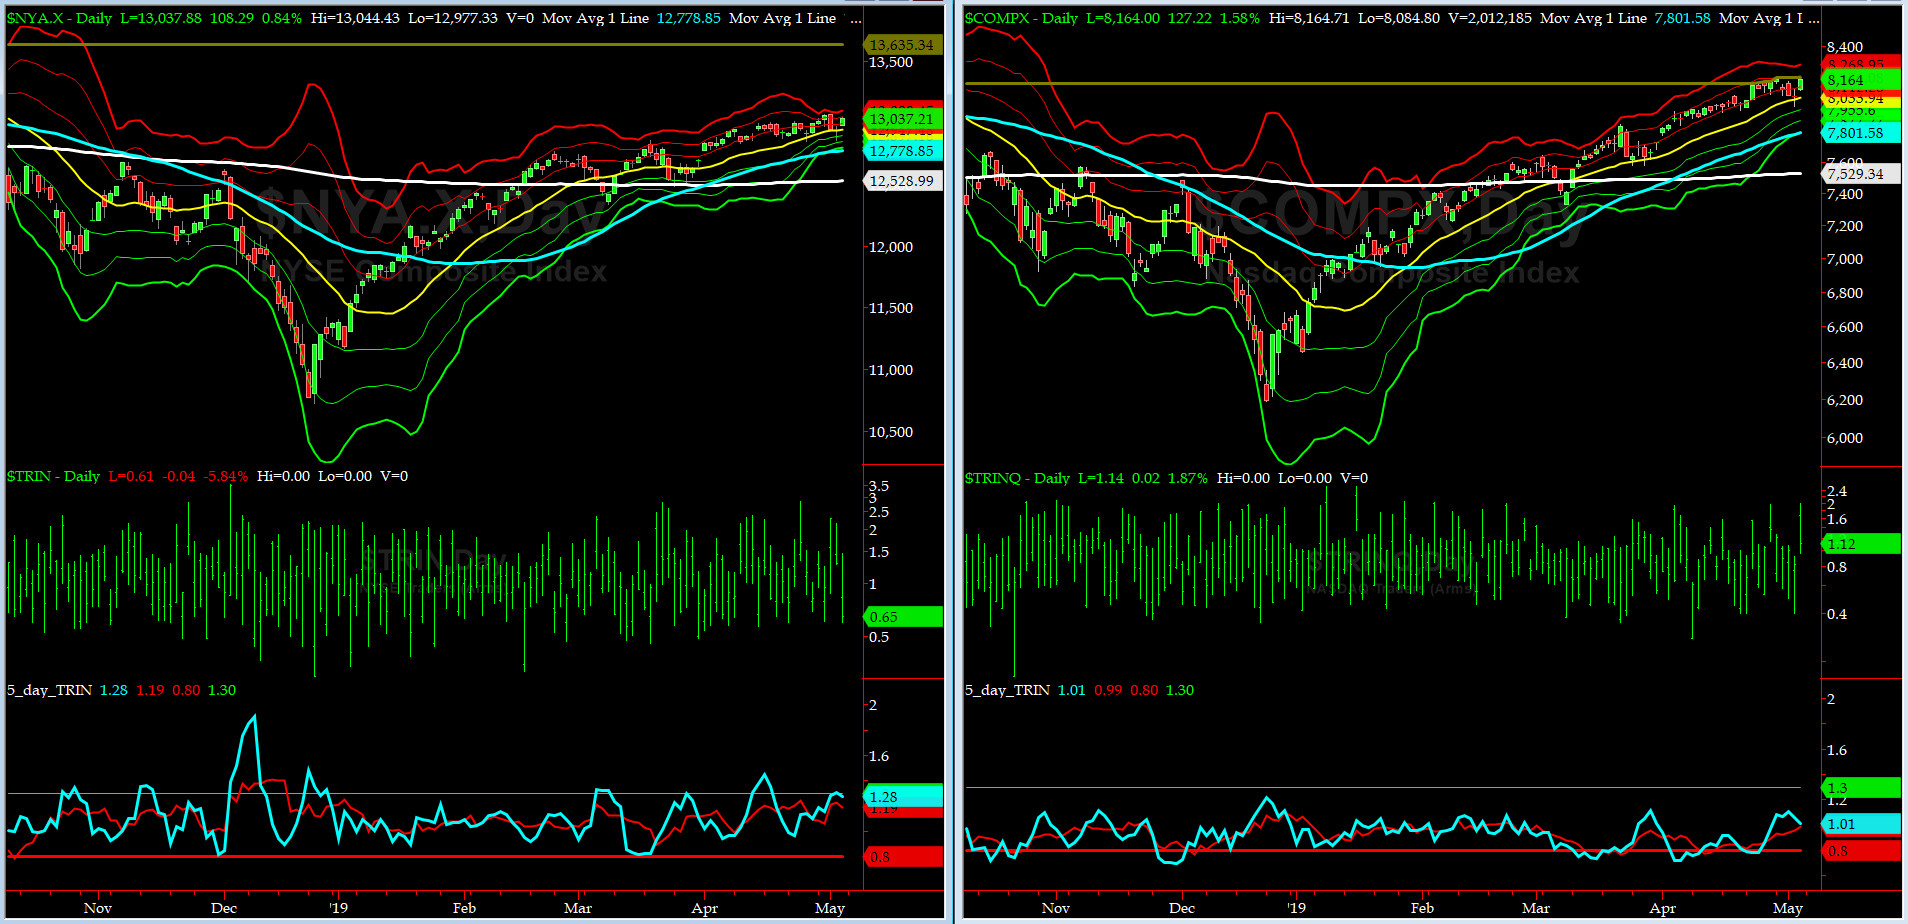
5-day TRIN & TRINQ Charts
NYSE 5-day TRIN stood at BUY zone while NASDAQ 5-day TRINQ remains in a NEUTRAL zone, as of Friday Close.
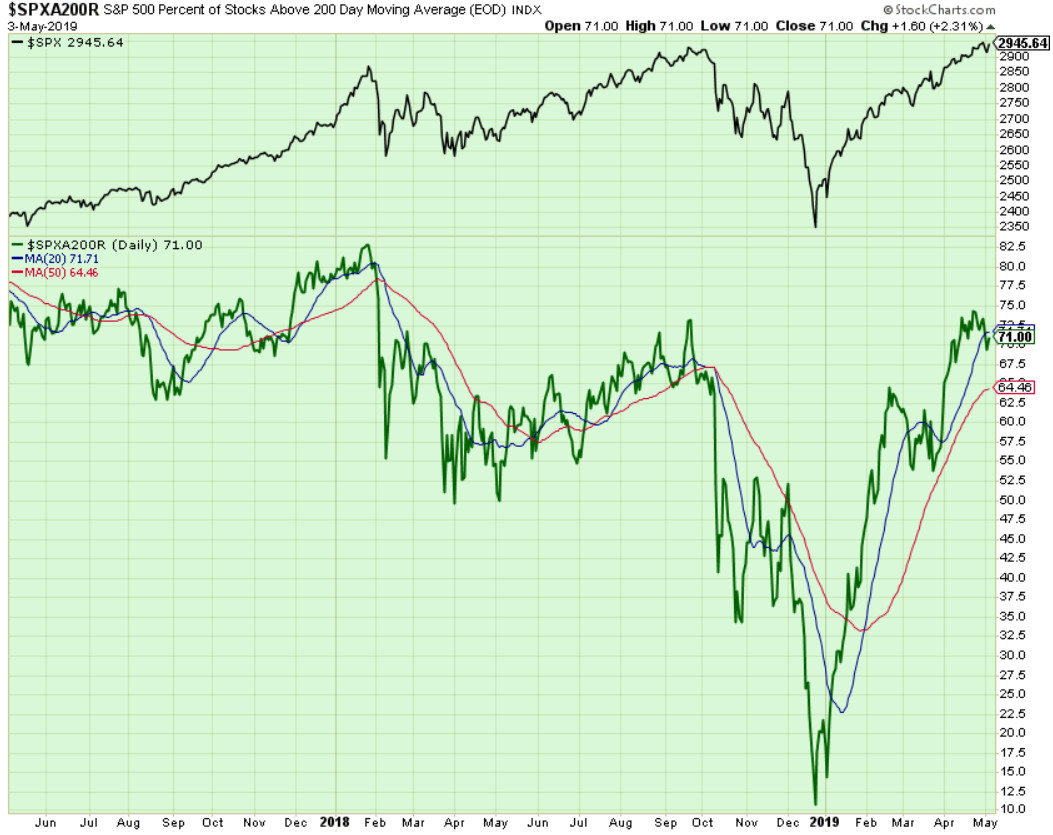
Components of SPX above their respective 200-day MA Chart
This scoring indicator rose very gradually to 71%. Divergence Galore? ubetcha (in Palingo).....
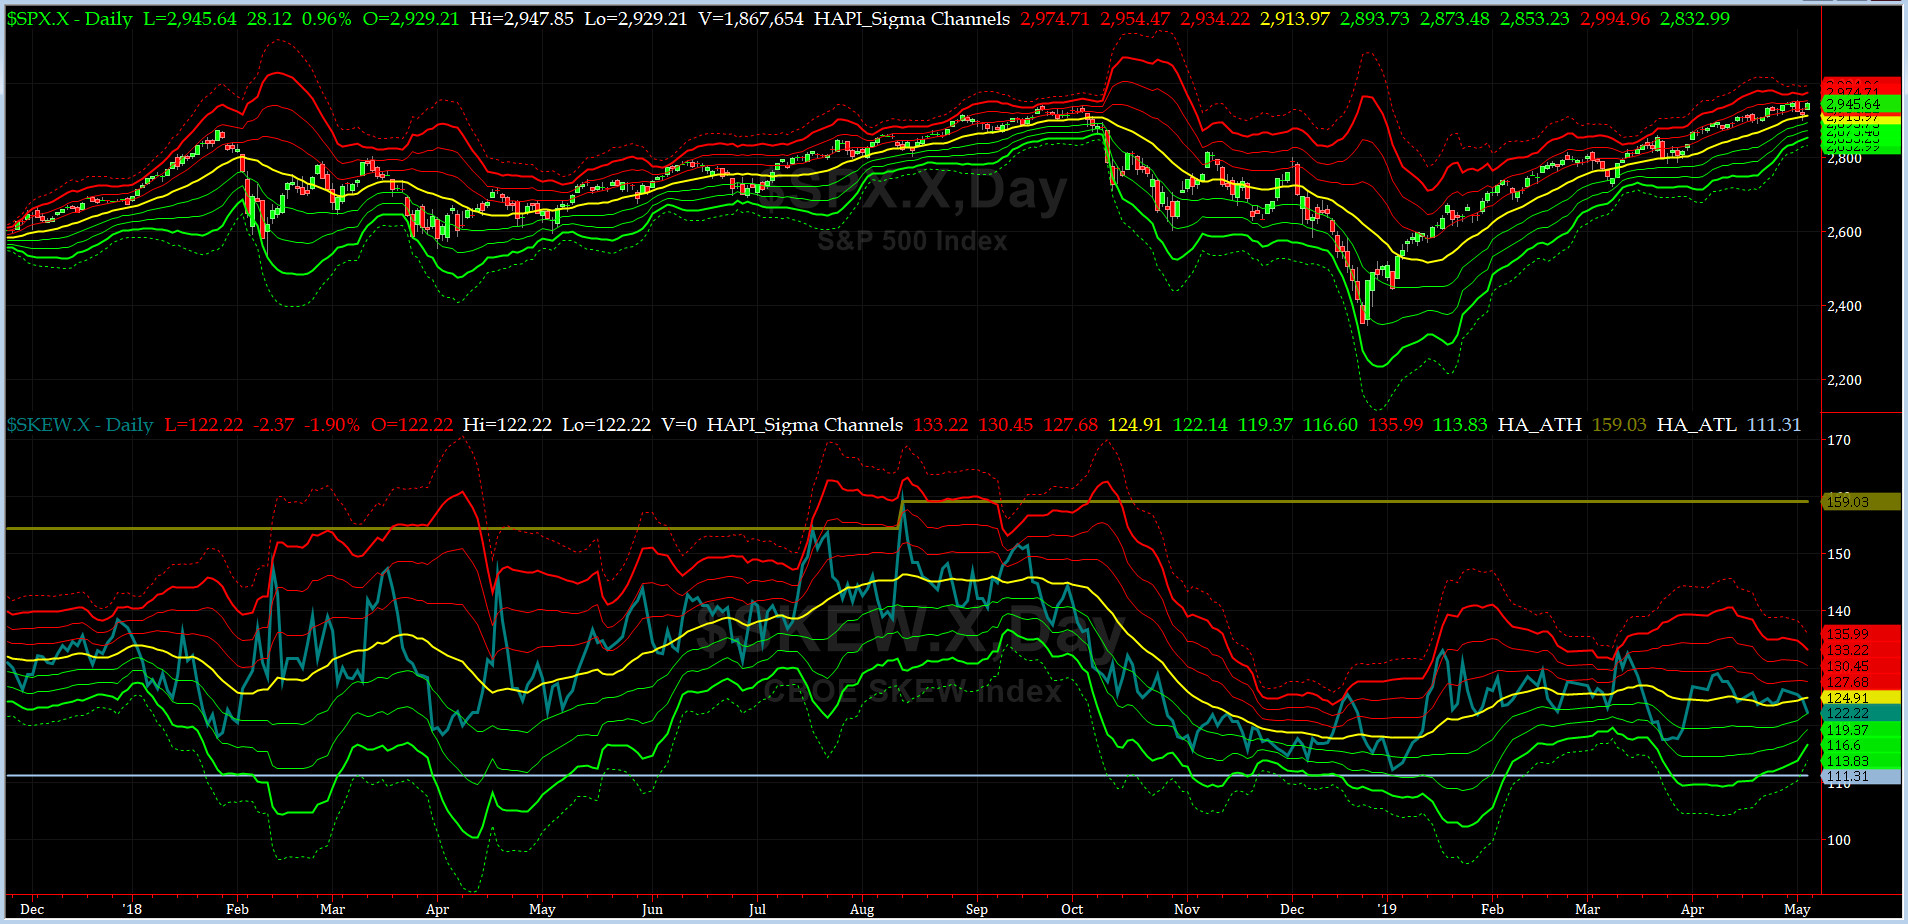
SPX SKEW (Tail Risk) Chart
On Friday, SPX SKEW (Tail Risk) closed near 122, now about its -1 sigma (normal = 120-125, range 100-150).
All quiet on the Eastern & Mid-Western Fronts? [As of Friday Close,] YES, this is according to our beloved HRH Capt Tiko, KCPE....
How to interpret the value of SPX SKEW? (from CBOE white paper on SKEW)

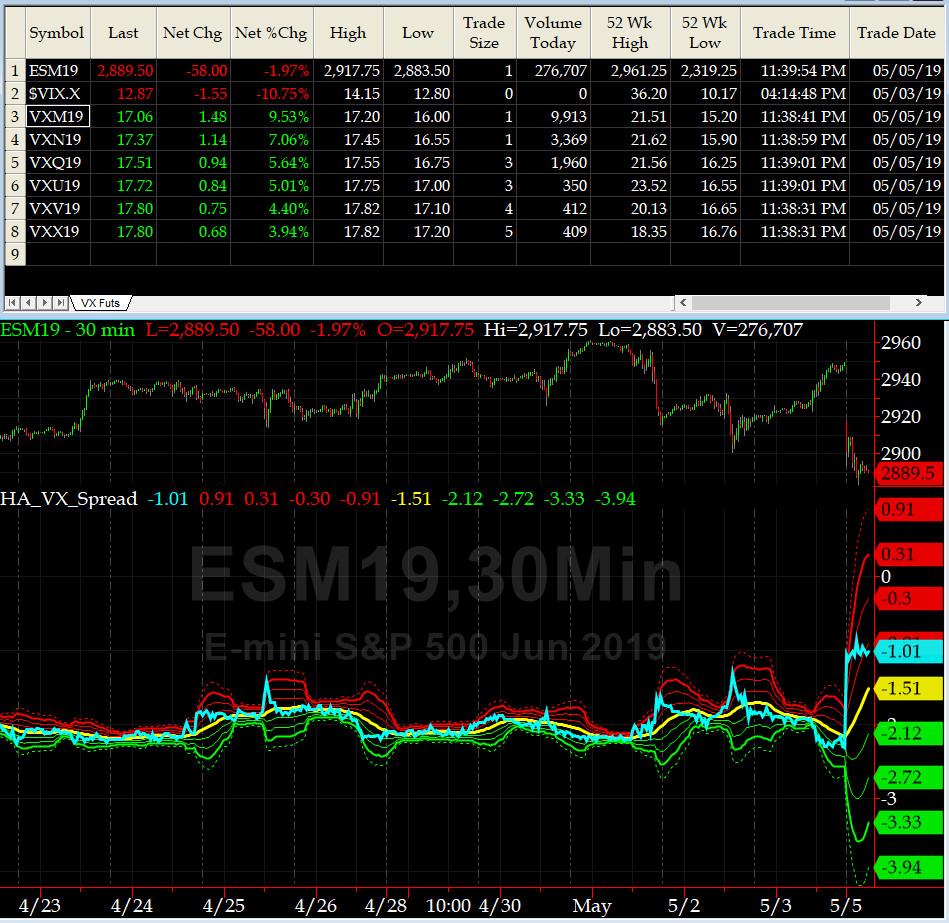
3-month VIX Futures Spread(VX) Chart
This popular timing indicator, (now long MAY19, & short AUG19 VIX Futures) closed the week at -2.32 which is in the OVERBOUGHT zone here.
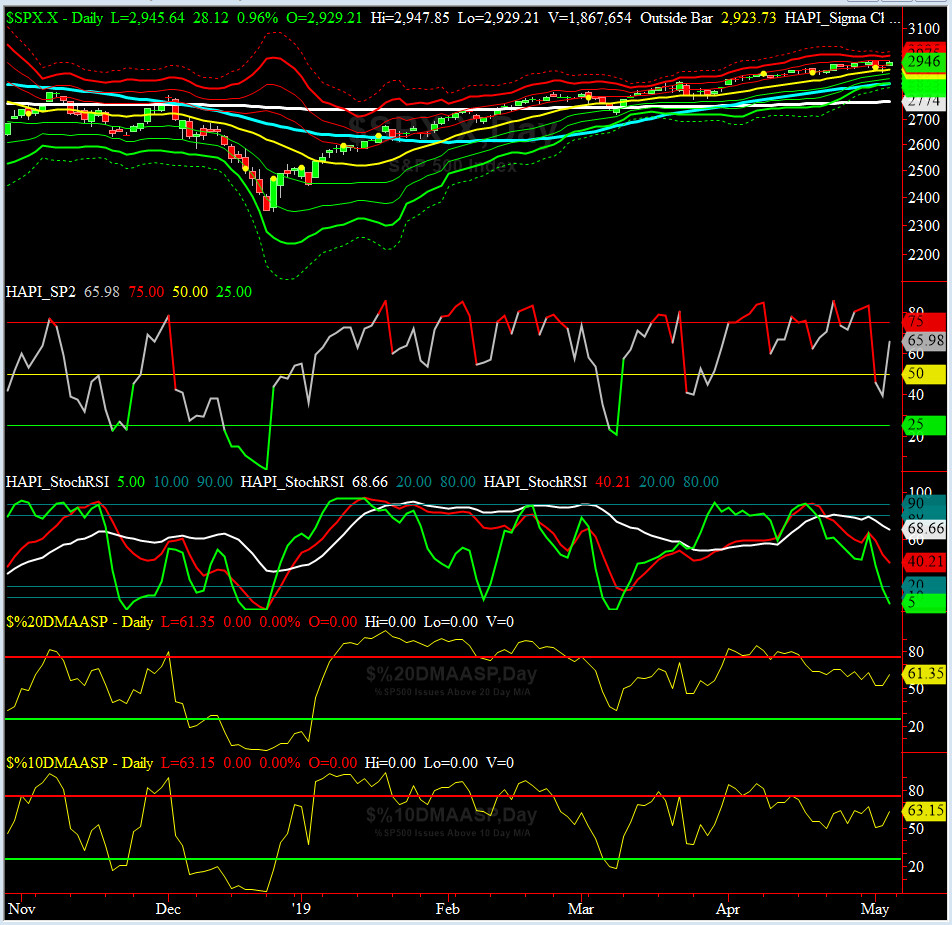
HA_SP2 Chart
HA_SP2 = 66 (Buy signal <= 25, Sell Signal >= 75)
Our coveted SP2 prop indicator went sideways for a week and then last week, it exhibited wild swings. Later on this week, we will need to look for possible oversold readings.
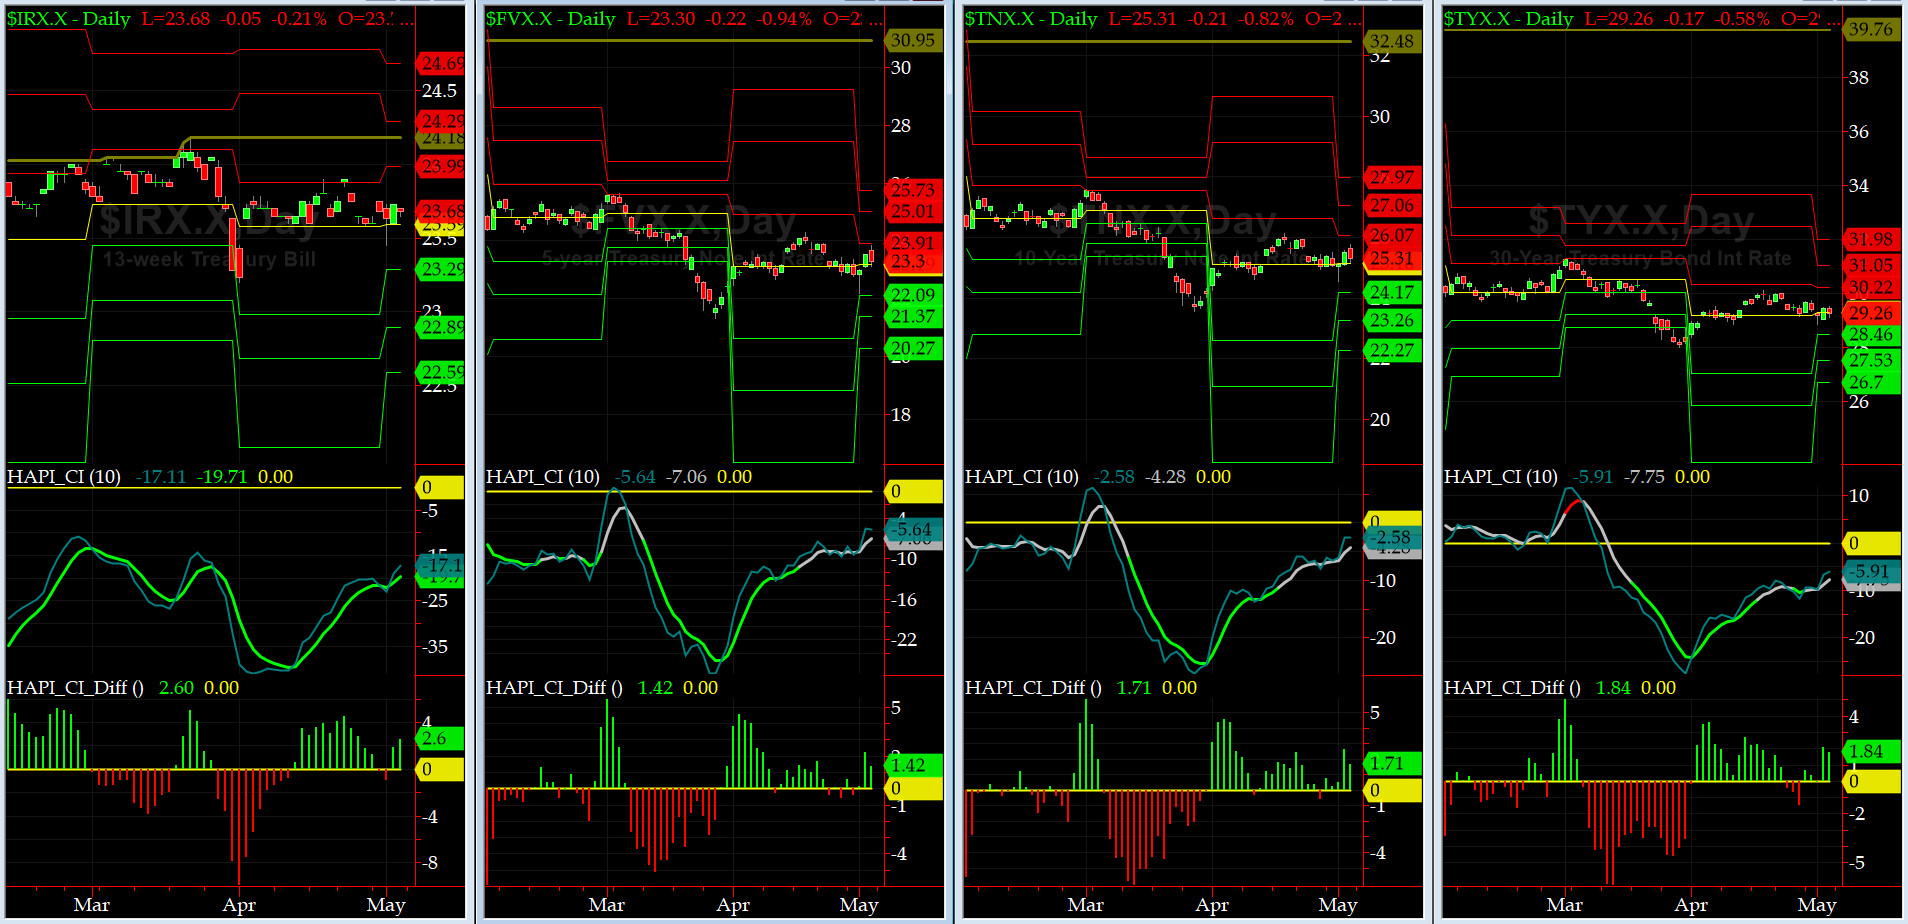
US Treasury T-Notes & T-Bonds Yields Chart
During the last two weeks, Yield Curve eased off a tad with little to no retracement.
Fari Hamzei
|
|
|
|
|
|
Sunday, May 5, 2019, 1826ET
Notice of Change of Bias with Timer Digest
Dear Jim,
We went flat last weekend due to the overbought readings of our key prop indicators. With April NFP hitting out of ballpark on Friday, we almost have a perfect �M� pattern in stock indices. In addition, politically, Washington is now entering a period of potential Constitutional Crisis should DOJ and/or WH disregard separation of powers, oversight role of Congress and rule of law in this great nation.
We now feel that we are better positioned to take the SHORT SPX side���.and look forward to Bob Mueller�s (Princeton Class of 1966), testimony next week.
Fari Hamzei
|
|
|
|
|
|
Customer Care:
|
|
|
|
|
|
|
 |
 |
|
 |
|
 |
 |
 |
HA YouTube Channel ::: HA Blog ::: Testimonials ::: Tutorials & FAQs ::: Privacy Policy
|
Trading Derivatives (Options & Futures) contains substantial risk and is not for every investor. An investor could potentially lose all or more than his/her initial investment.
Only risk capital should be used for trading and only those with sufficient risk capital should consider trading derivatives. Past performance is not
necessarily indicative of future results. Testimonials appearing on this website may not be representative of other clients or customers
and are not a guarantee of future performance or success.
|
| (c) 1998-2025, Hamzei Analytics, LLC.® All Rights Reserved. |
|
|