|
Monday, May 20, 2019, 0920ET
Market Timing Charts, Analysis & Commentary for Issue #291
Timer Charts of S&P-500 Cash Index (SPX) + NASDAQ-100 Cash Index (NDX)
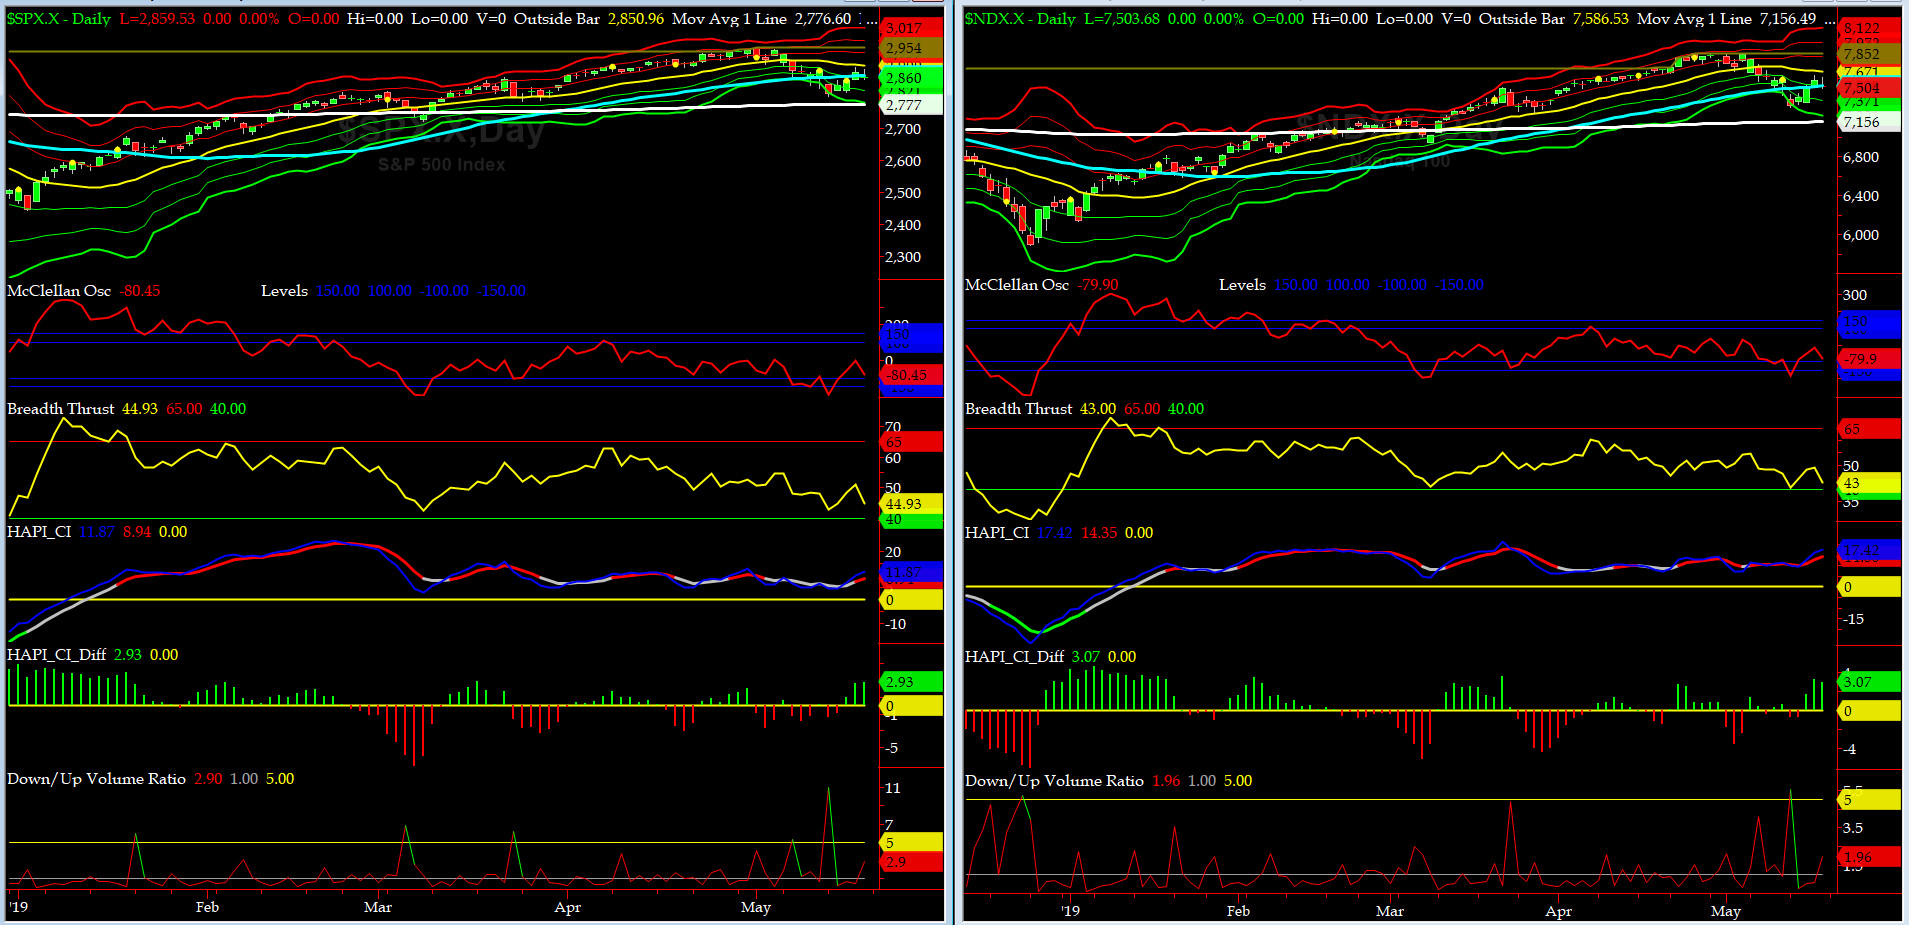
Most recent S&P-500 Cash Index (SPX): 2860 down 21 (down -0.73%) for the week ending on Friday, May 17, 2019, which closed near its -1 sigma.
DJIA ALL TIME INTRADAY HIGH = 26951 (reached on Wednesday, October 3, 2018)
DJ TRAN ALL TIME INTRADAY HIGH = 11623 (reached on Friday, September 14, 2018)
SPX ALL TIME INTRADAY HIGH = 2954 (reached on Wednesday, May 1, 2019)
NDX ALL TIME INTRADAY HIGH = 7852 (reached on Wednesday, May 1, 2019)
RUT ALL TIME INTRADAY HIGH = 1742 (reached on Friday, August 31, 2018)
Current DAILY +2 Sigma SPX = 2978 with WEEKLY +2 Sigma = 3013
Current DAILY 0 Sigma SPX = 2900 with WEEKLY 0 Sigma = 2789
Current DAILY -2 Sigma SPX = 2821 with WEEKLY -2 Sigma = 2565
NYSE McClellan Oscillator = -80 (-150 is start of the O/S area; around -275 to -300 area or lower, we go into the �launch-pad� mode; over +150, we are in O/B area)
NYSE Breadth Thrust = 44.9 (40 is considered as oversold and 65 as overbought)
Monday was a huge day and we got extra lucky. I made a big mistake of not getting long Monday night as SP2 was at 15.5. Won't happen again, promise. In the next three days we witnessed a big run-up into Friday OX.
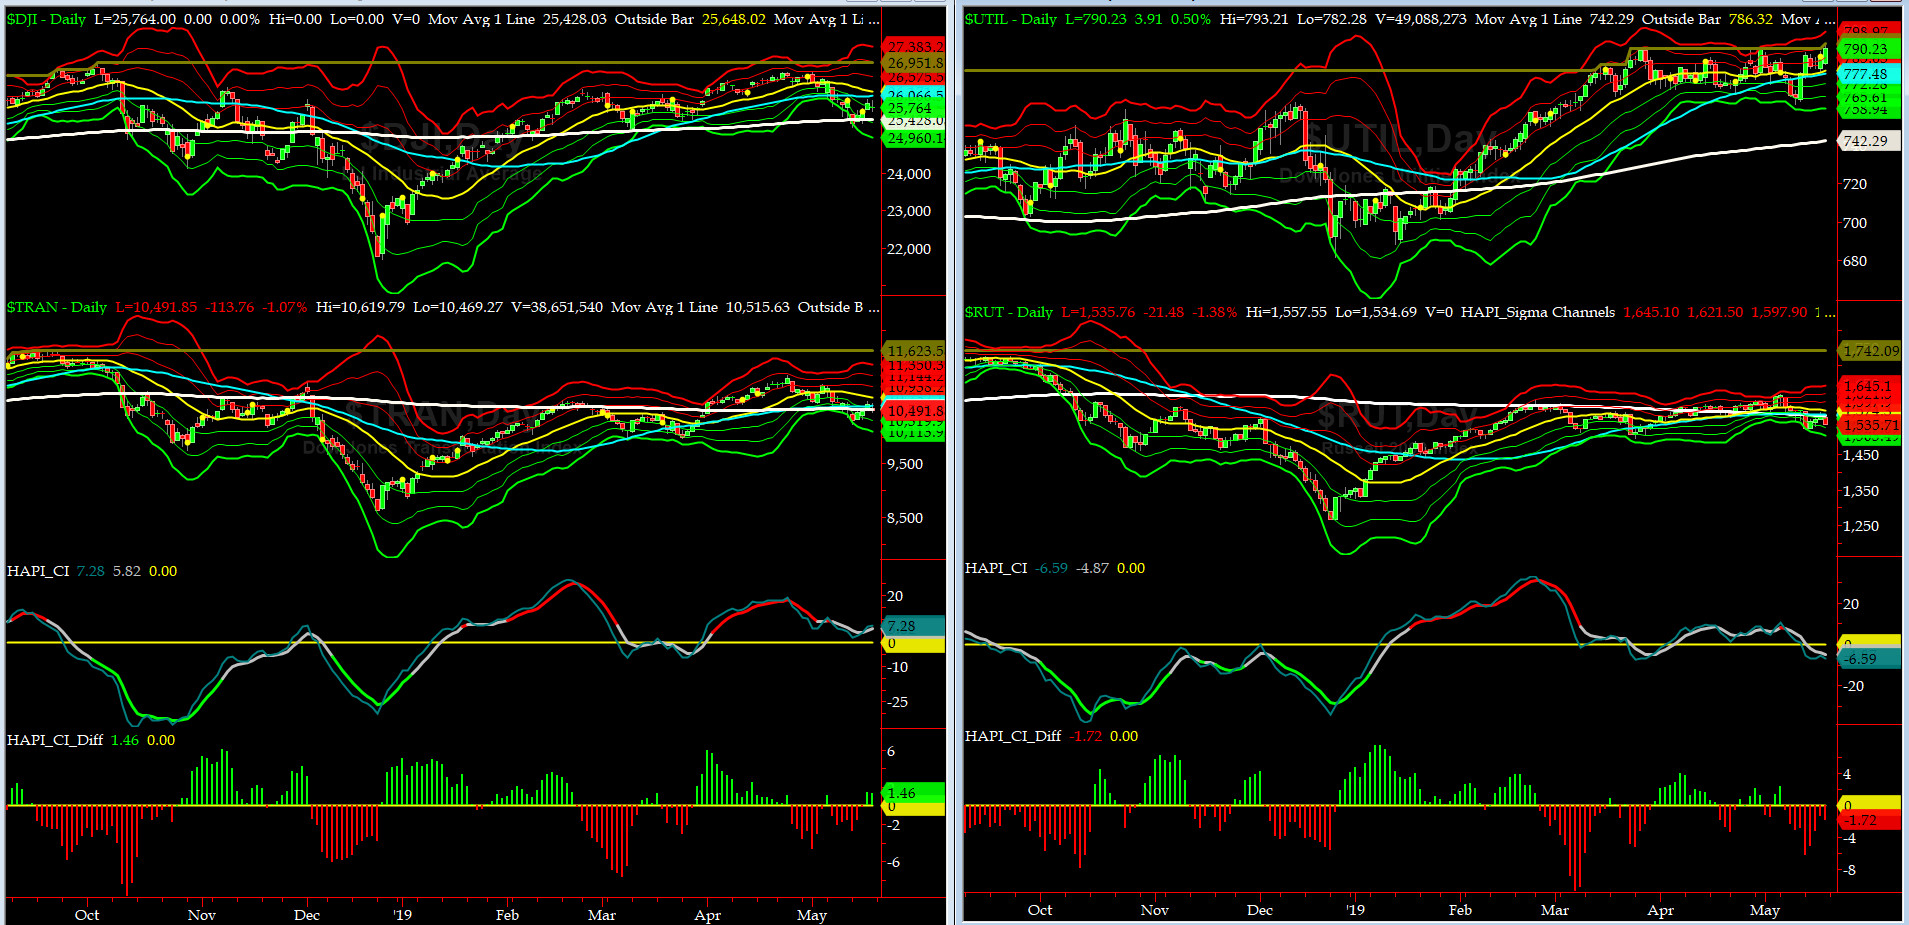
Canaries [in the Coal Mine] Chart for DJ TRAN & RUT Indices
200-Day MA DJ TRAN = 10,528 or 0.2% ABOVE DJ TRAN (max observed in last 7 yrs = 20.2%, min = -20.3%)
200-Day MA RUT = 1562 or 1.5% ABOVE RUT (max observed in last 7 yrs = 21.3%, min = -22.6%)
DJ Transportation Index (proxy for economic conditions 6 to 9 months hence) sold off on Monday and then tried to recover somewhat.
Russell 2000 Small Caps Index (proxy for Risk ON/OFF) sold off hard on Monday and then went sideways.
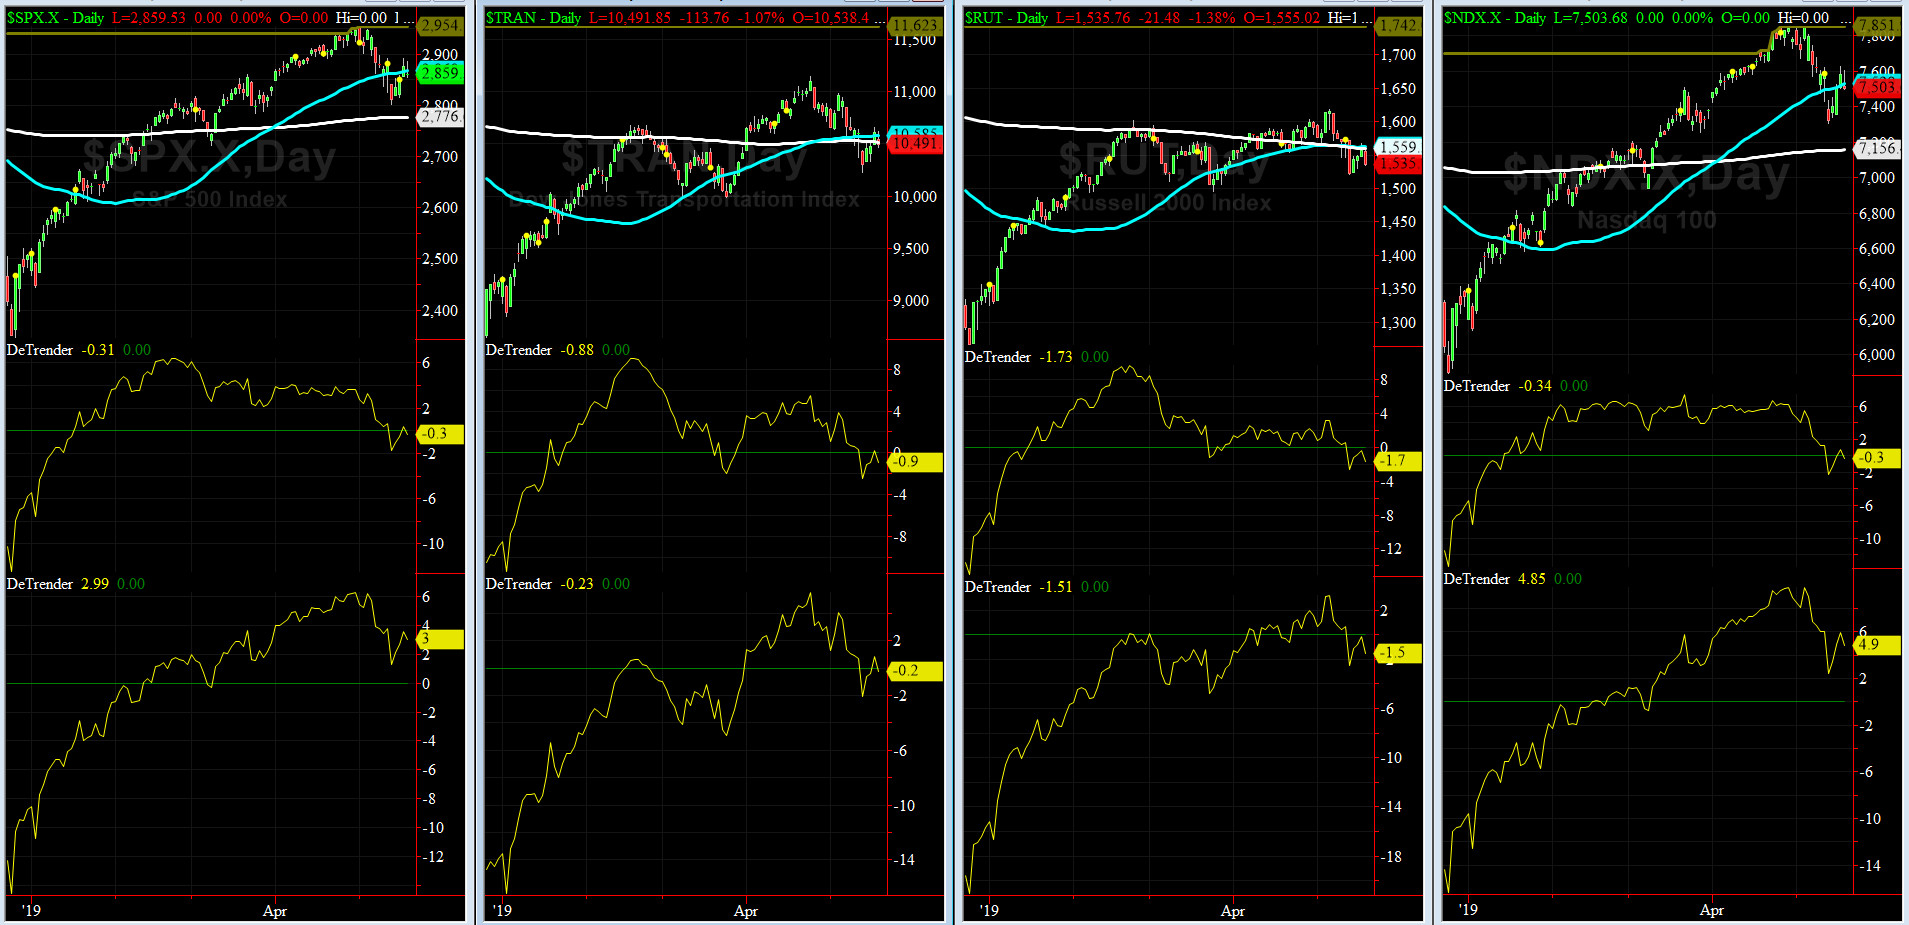
DeTrenders Charts for SPX, NDX, TRAN & RUT Indices
50-Day MA SPX = 2868 or 0.3% ABOVE SPX (max observed in last 7 yrs = +8.6%, min = -9.3%)
200-Day MA SPX = 2776 or 3% BELOW SPX (max observed in last 7 yrs = 15.2%, min = -14%)
SIX of our EIGHT DeTrenders are in the NEGATIVE territory. The DeTrenders for DJ Tran & RUT will continue to be harbingers of future price behavior in broad indices.

HA_SP1_Momo Chart
WEEKLY Timing Model = on a BUY Signal since Friday, March 8, 2019 CLOSE at 2743
DAILY Timing Model = on a SELL Signal since Monday, May 6, 2019 CLOSE at 2932
Max SPX 52wk-highs reading last week = 50 (over 120-140, the local maxima is in)
Max SPX 52wk-Lows reading last week = 22 (over 40-60, the local minima is in)
HA_SP1 closed near its zero sigma channels
HA_Momo = -2.3 (reversals most likely occur above +10 or below -10)

Vol of the Vols Chart
Spot VIX stood at 17.3 Friday night, at about its +1 sigma (remember it's the VIX volatility pattern aka "its sigma channels" that matters, and not the level of VIX itself (this is per Dr. Robert Whaley, a great mentor and inventor of original VIX, now called VXO). VIX usually peaks around a test of its +4 sigma).
We now believe that @Capt_Tiko may have had an email from the Masters of Universe last week.... maybe AG Barr should investigate that too..... ROFLMTO
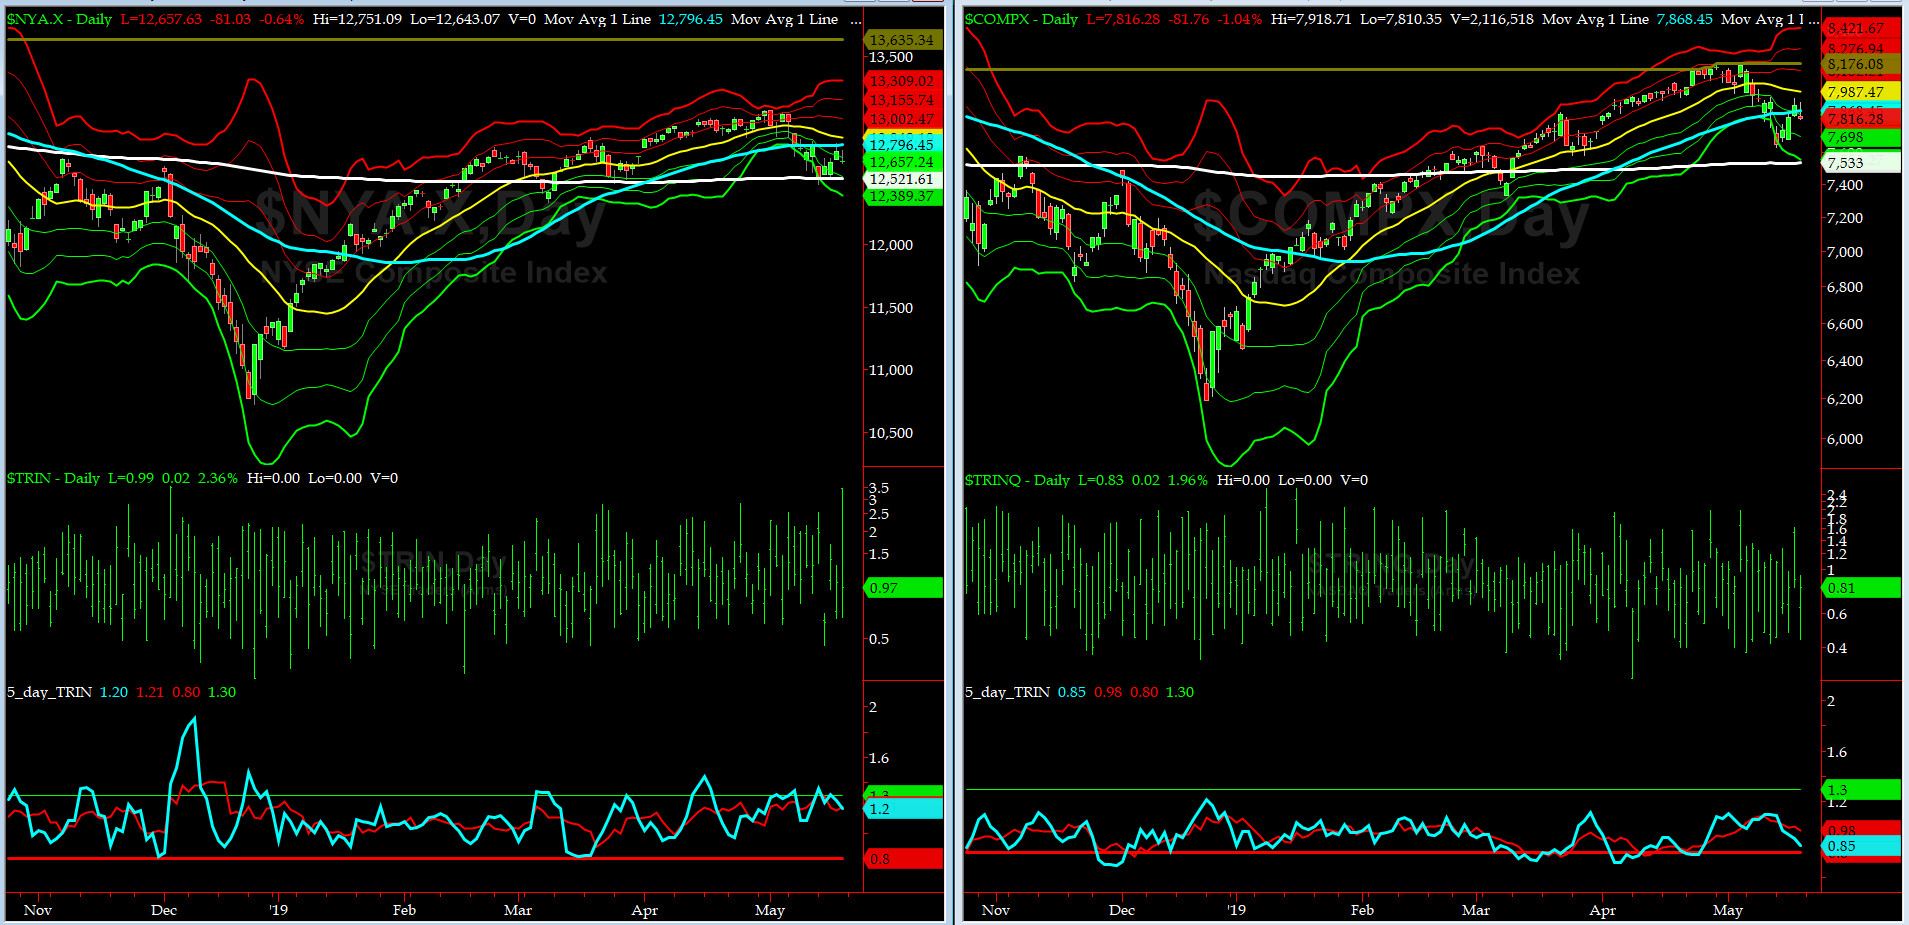
5-day TRIN & TRINQ Charts
NYSE 5-day TRIN is approaching a NEUTRAL signal & NASDAQ 5-day TRINQ is moving towards a SELL signal.
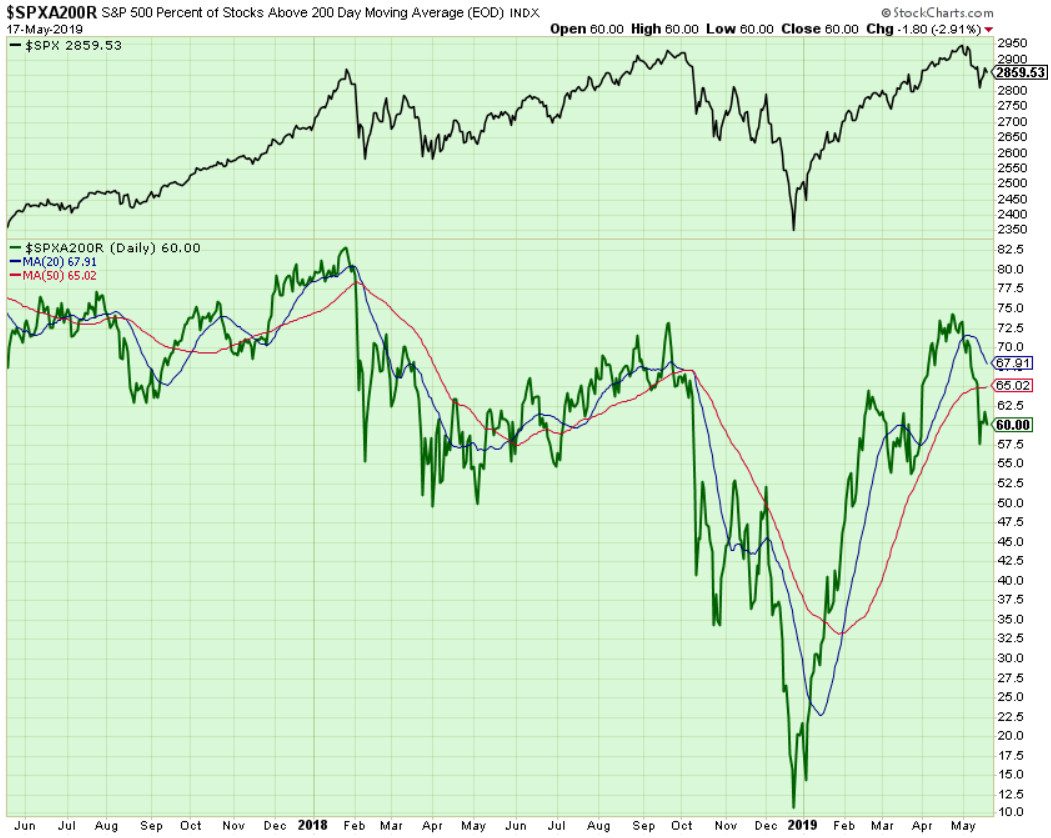
Components of SPX above their respective 200-day MA Chart
This scoring indicator dropped sharply to 60%. The Divergences we wrote about during the last few weeks have surely played out.
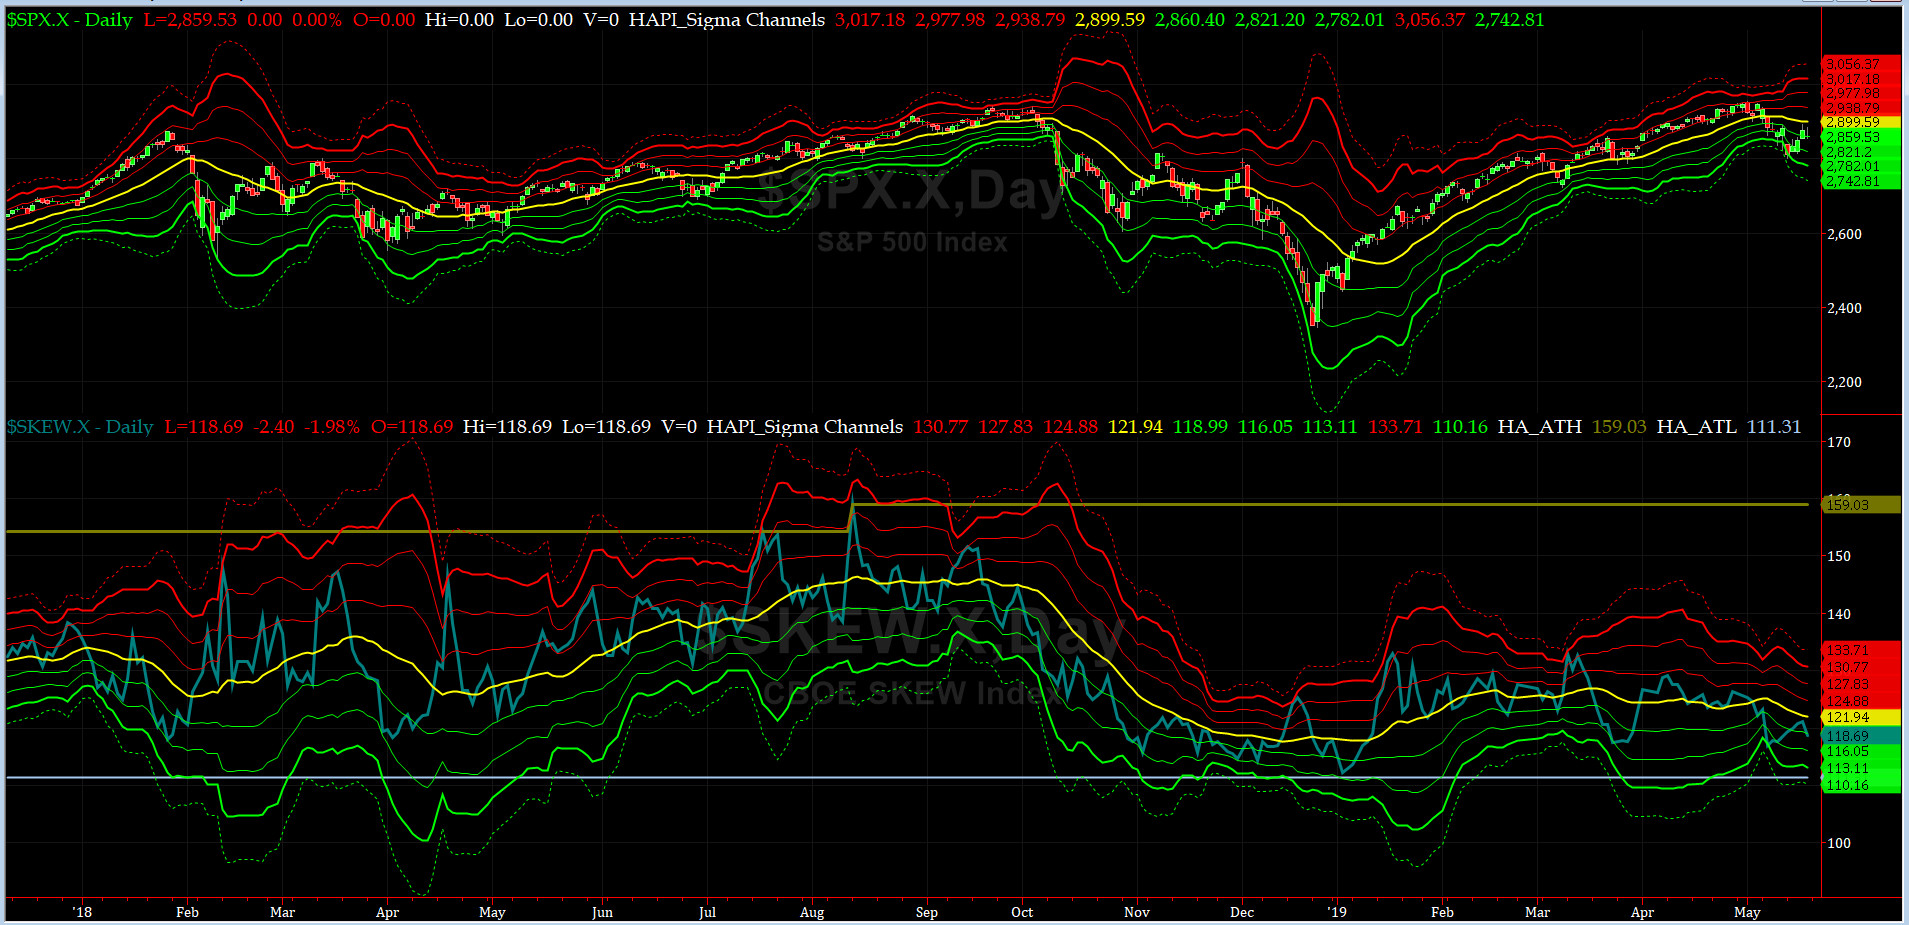
SPX SKEW (Tail Risk) Chart
On Friday, SPX SKEW (Tail Risk) closed near 118.7, now about its -1 sigma (normal = 115, range 100-150).
All quiet on the Eastern & Mid-Western Fronts? Still YES, this is according to our beloved HRH Capt Tiko, KCPE....
How to interpret the value of SPX SKEW? (from CBOE white paper on SKEW)

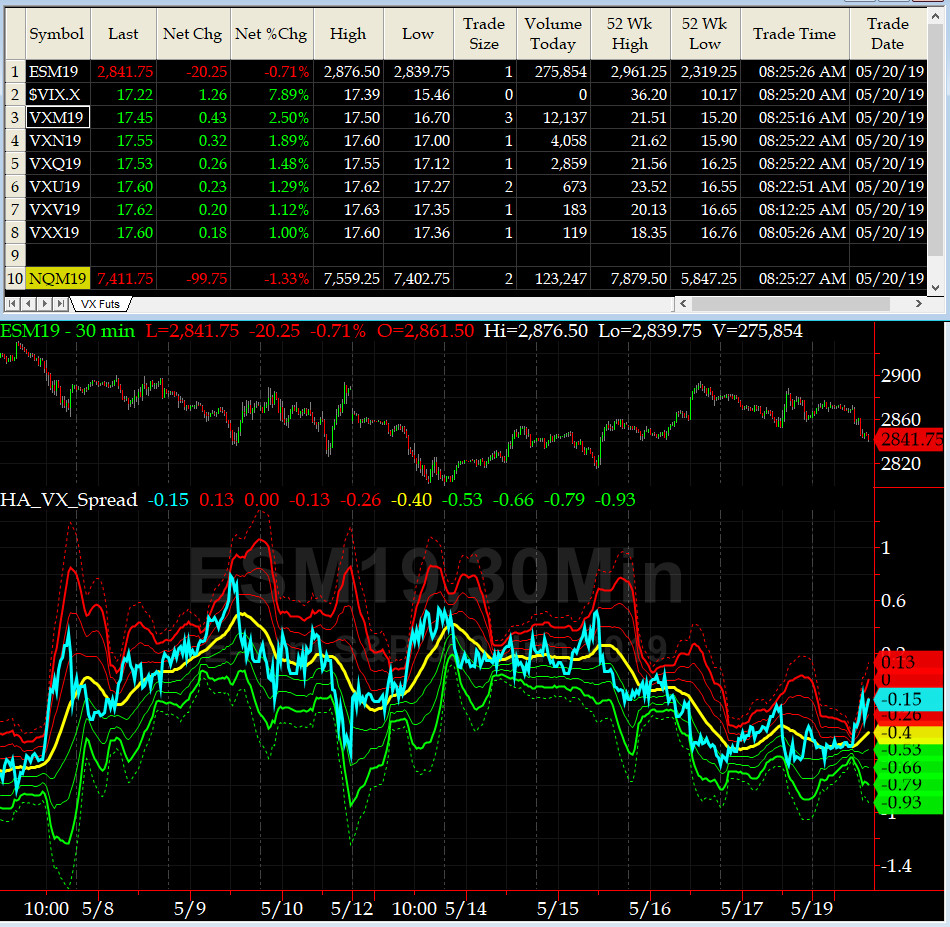
3-month VIX Futures Spread(VX) Chart
This popular timing indicator, (now long JUN19, & short SEP19 VIX Futures) hit -0.5 on Friday Close which translates to: we are still near the bottom.
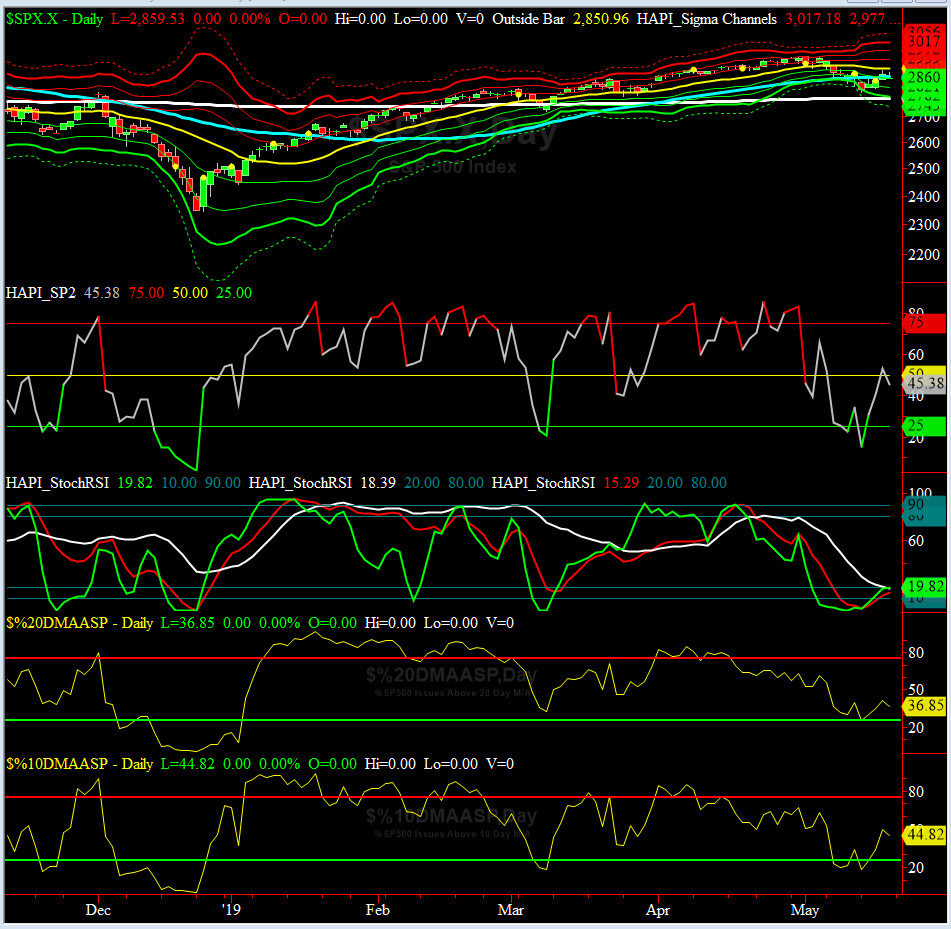
HA_SP2 Chart
HA_SP2 = 45.4 (Buy signal <= 25, Sell Signal >= 75)
Our coveted SP2 prop indicator dropped to 15 on Monday (we should have gone Long).
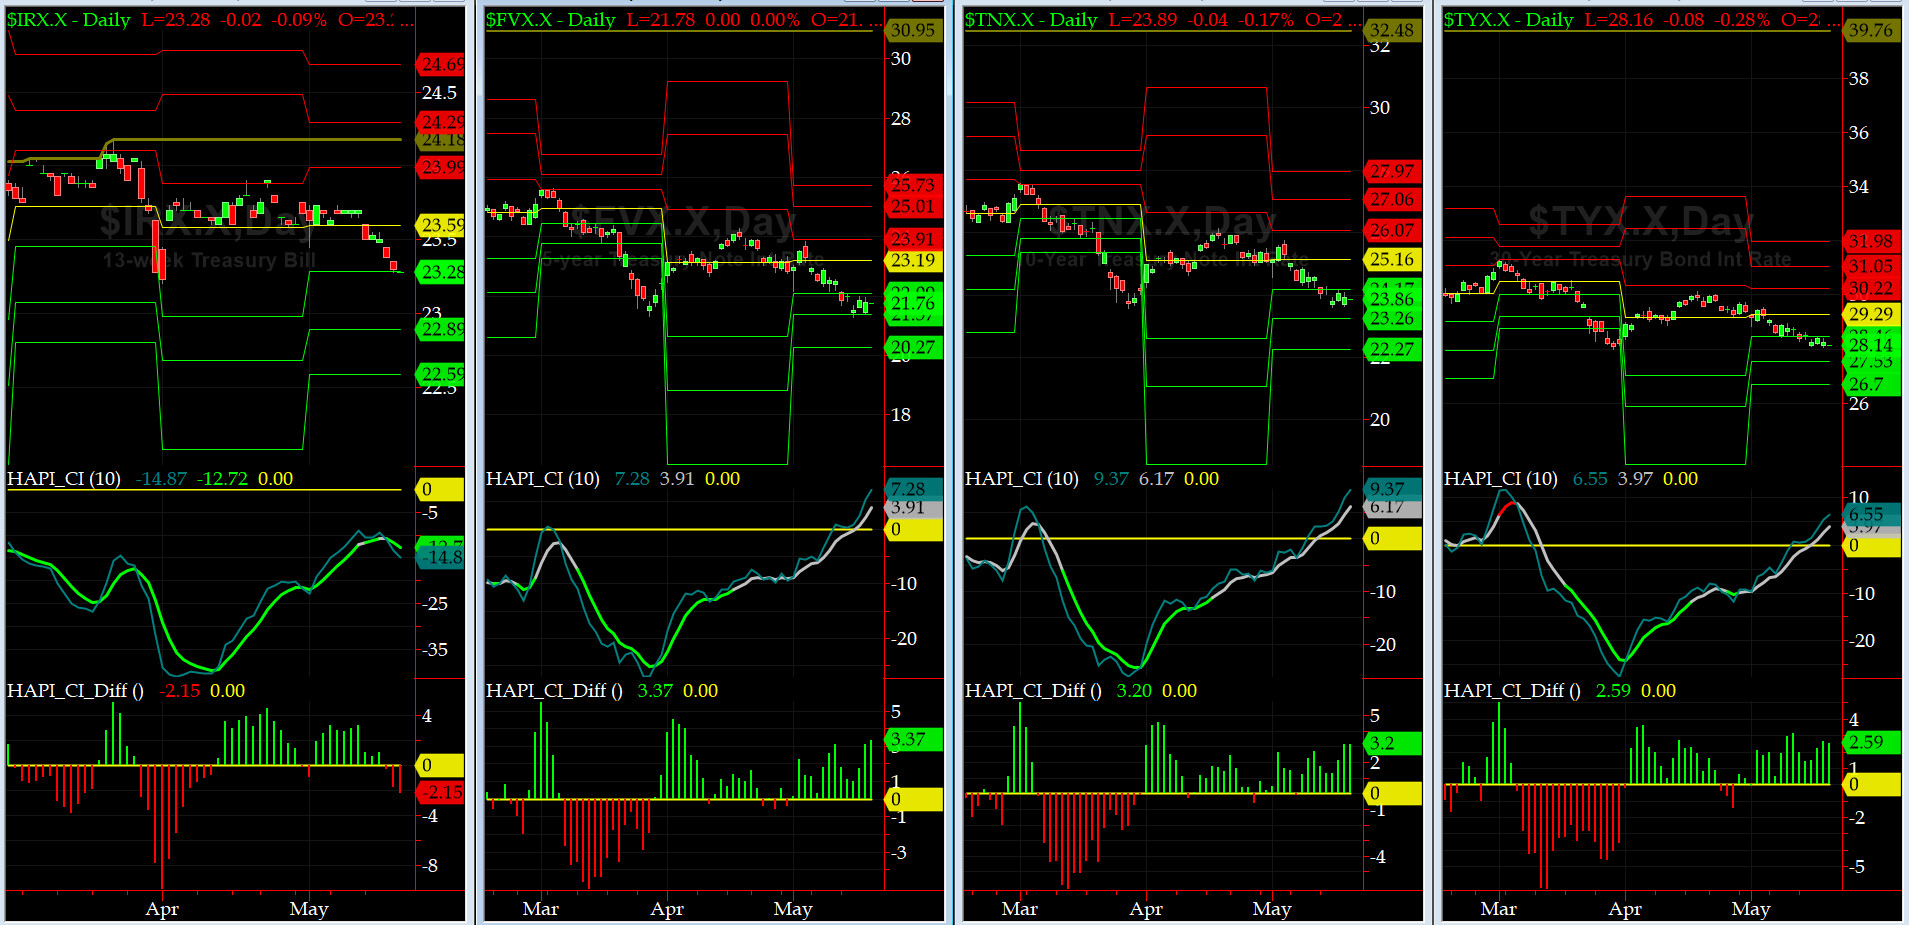
US Treasury T-Notes & T-Bonds Yields Chart
During last week our Yield Curve continued to ease off more.
Fari Hamzei
|


 Proactive Market Timing


