|
Sunday, June 16, 2019, 2230ET
Market Timing Charts, Analysis & Commentary for Issue #295
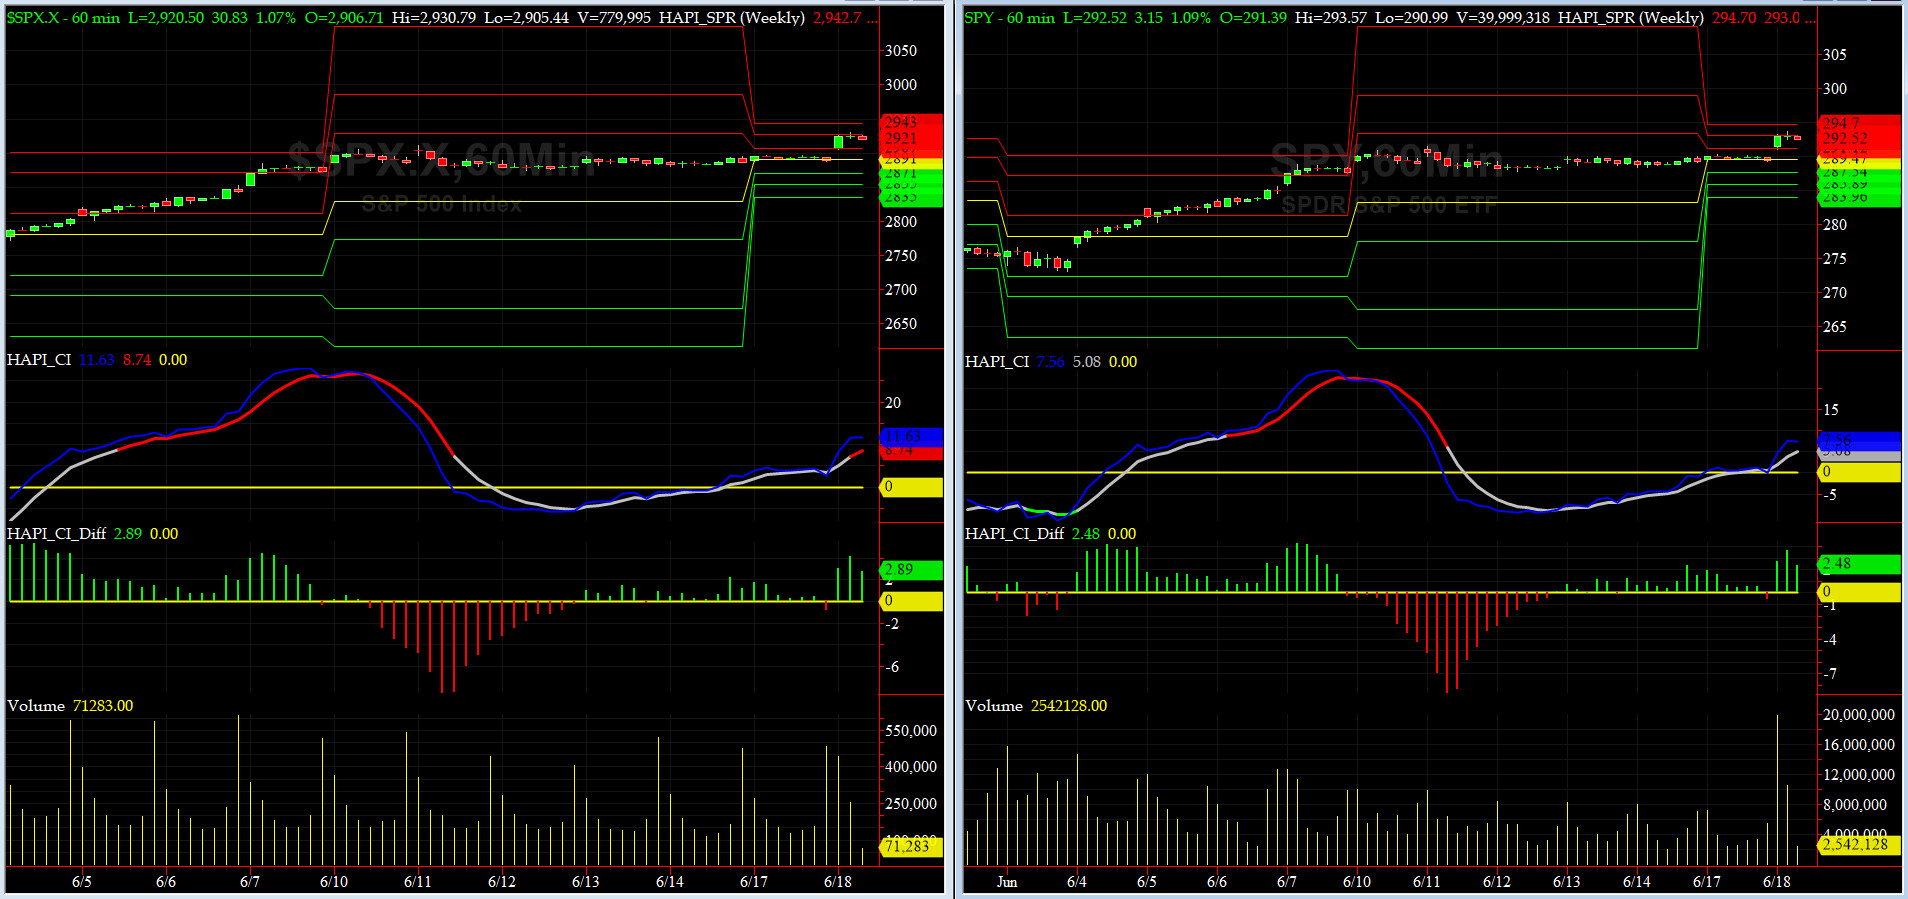
Timer Charts of S&P-500 Cash Index (SPX) + NASDAQ-100 Cash Index (NDX)
Most recent S&P-500 Cash Index (SPX): 2887 up 14 (up +0.5%) 2887 for the week ending on Friday, June 14, 2019, which closed near its +1 sigma.
DJIA ALL TIME INTRADAY HIGH = 26951 (reached on Wednesday, October 3, 2018)
DJ TRAN ALL TIME INTRADAY HIGH = 11623 (reached on Friday, September 14, 2018)
SPX ALL TIME INTRADAY HIGH = 2954 (reached on Wednesday, May 1, 2019)
NDX ALL TIME INTRADAY HIGH = 7852 (reached on Wednesday, May 1, 2019)
RUT ALL TIME INTRADAY HIGH = 1742 (reached on Friday, August 31, 2018)
Current DAILY +2 Sigma SPX = 2924 with WEEKLY +2 Sigma = 2974
Current DAILY 0 Sigma SPX = 2836 with WEEKLY 0 Sigma = 2833
Current DAILY -2 Sigma SPX = 2748 with WEEKLY -2 Sigma = 2692
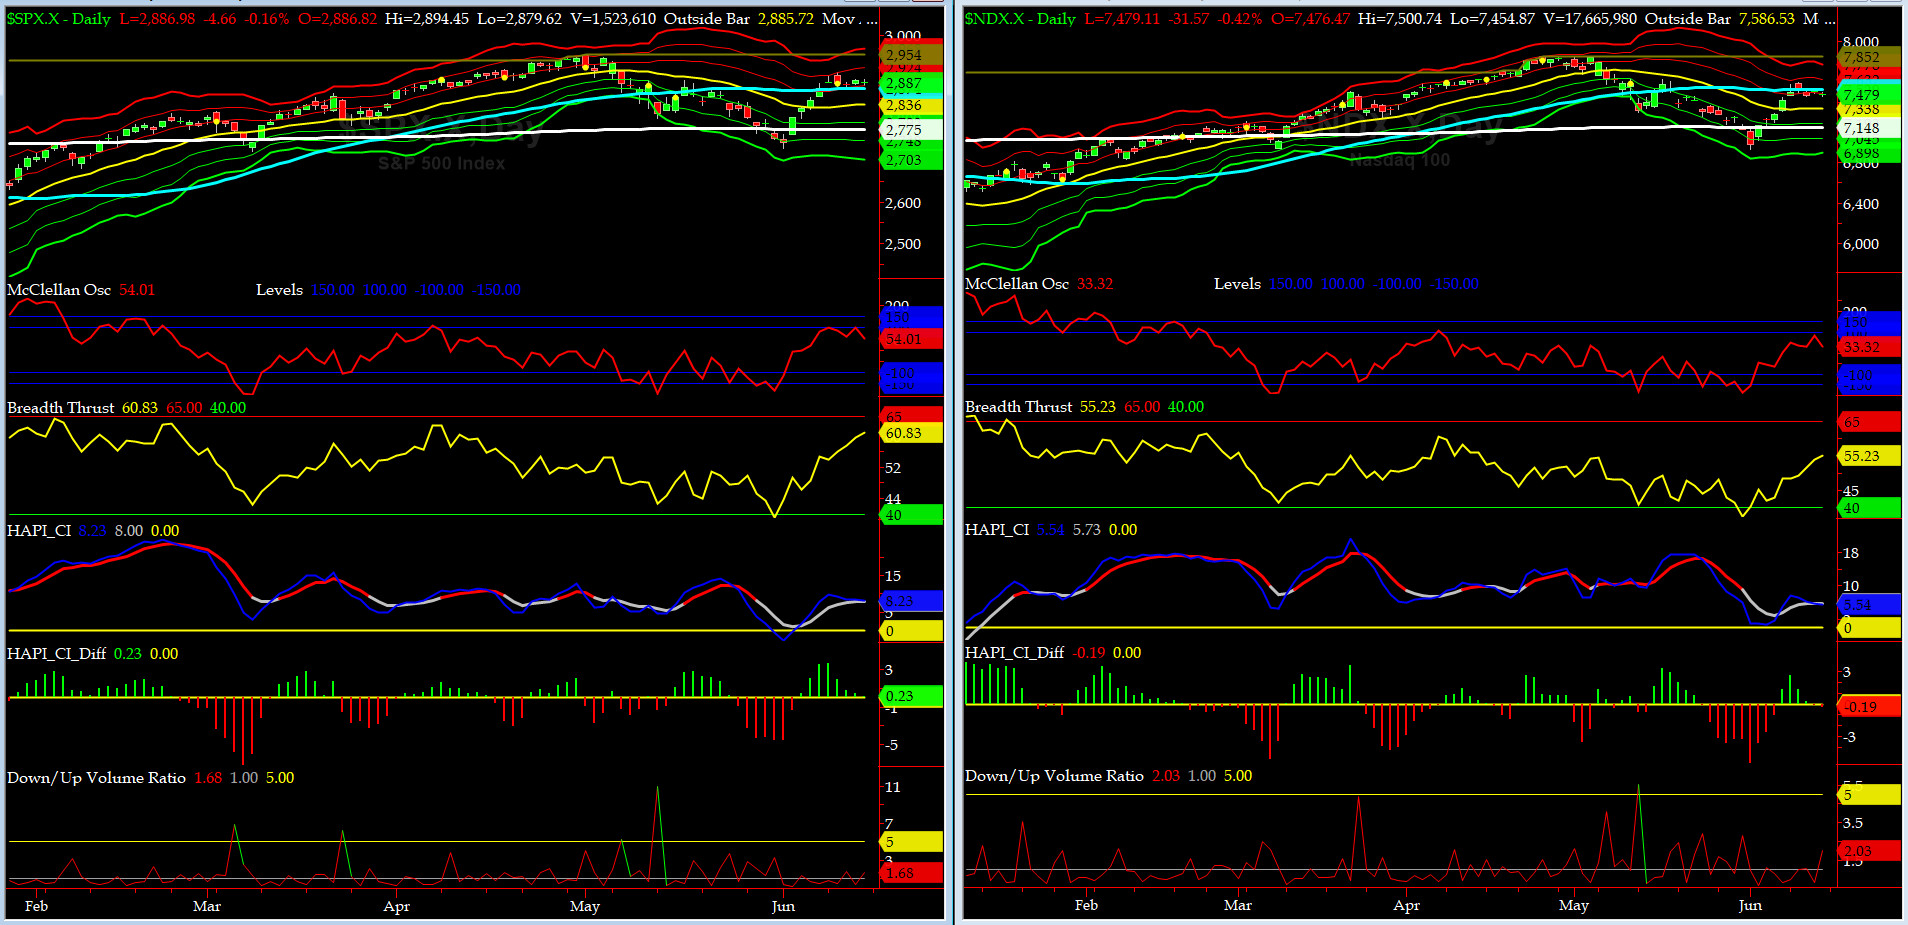
NYSE McClellan Oscillator = +54 (-150 is start of the O/S area; around -275 to -300 area or lower, we go into the �launch-pad� mode; over +150, we are in O/B area)
NYSE Breadth Thrust = 60.8 (40 is considered as oversold and 65 as overbought)
This past week, we went nowhere fast.........ROMANs were at the Gates, almost every day. Oh well.....
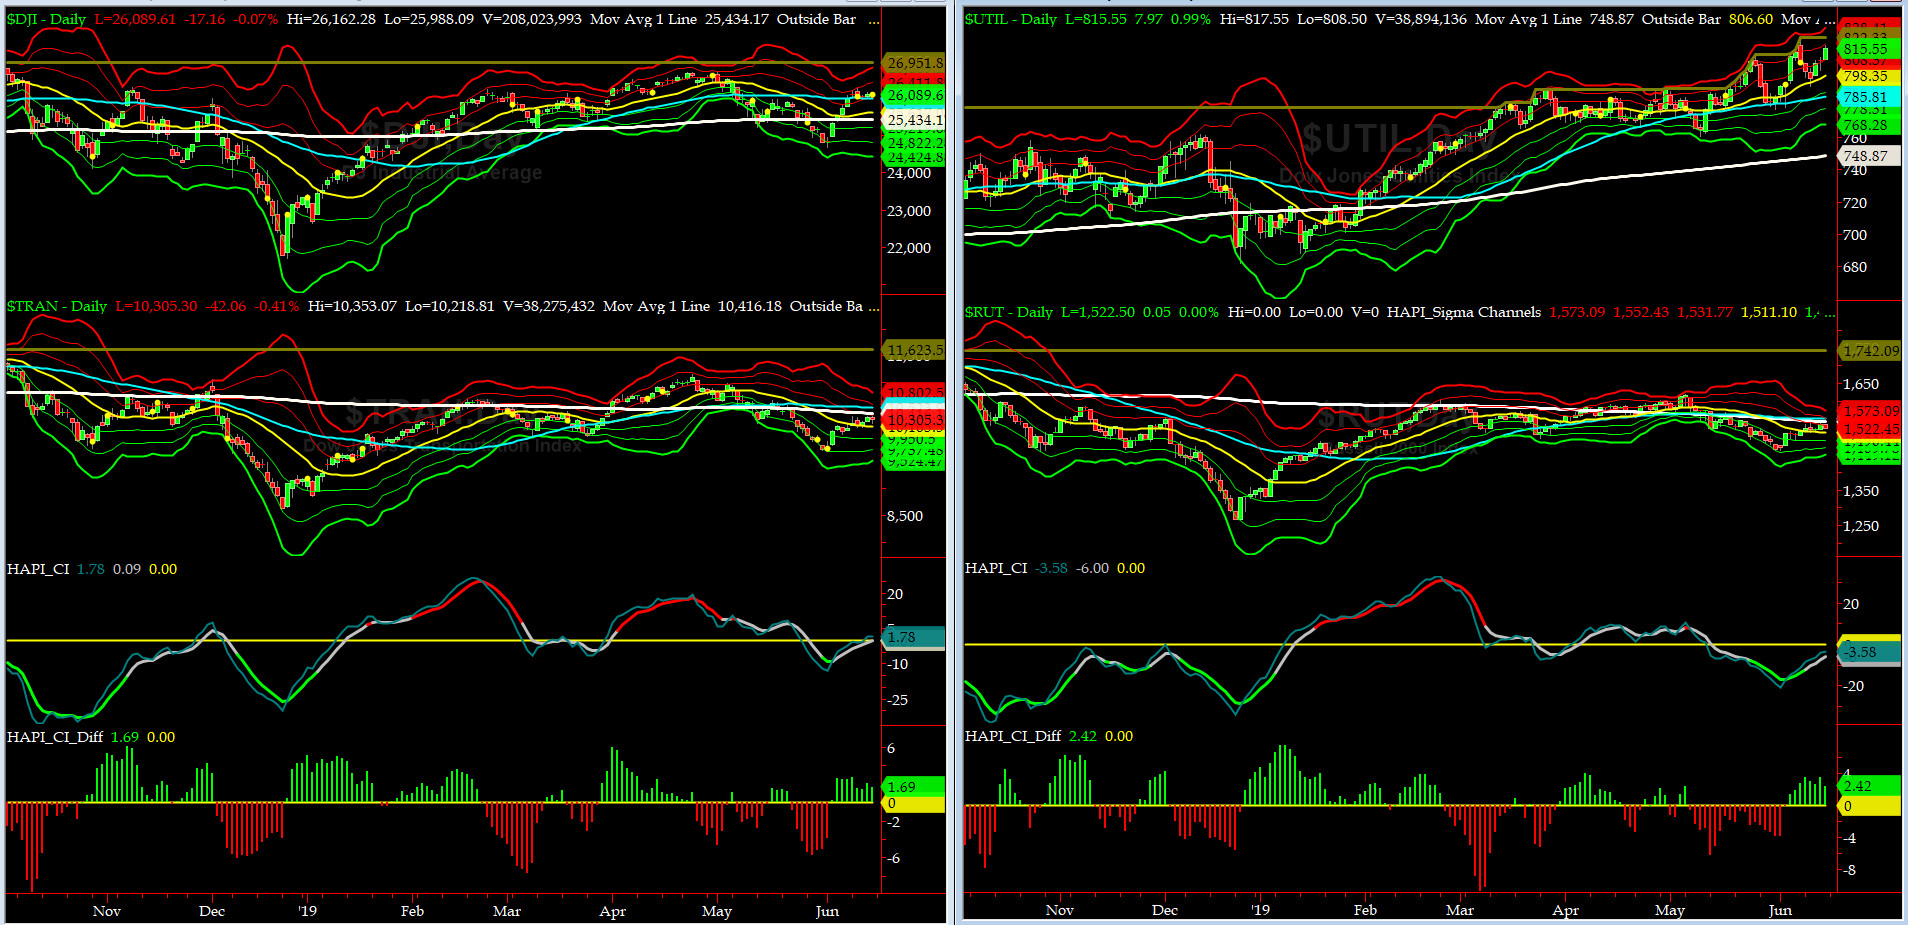
Canaries [in the Coal Mine] Chart for DJ TRAN & RUT Indices
200-Day MA DJ TRAN = 10,416 or 1.1% ABOVE DJ TRAN (max observed in last 7 yrs = 20.2%, min = -20.3%)
200-Day MA RUT = 1541 or 1.3 ABOVE RUT (max observed in last 7 yrs = 21.3%, min = -22.6%)
DJ Transportation Index (proxy for economic conditions 6 to 9 months hence) also went nowhere fast. more tea?
Russell 2000 Small Caps Index (proxy for Risk ON/OFF) same story here and yes, RISK is still OFF.....
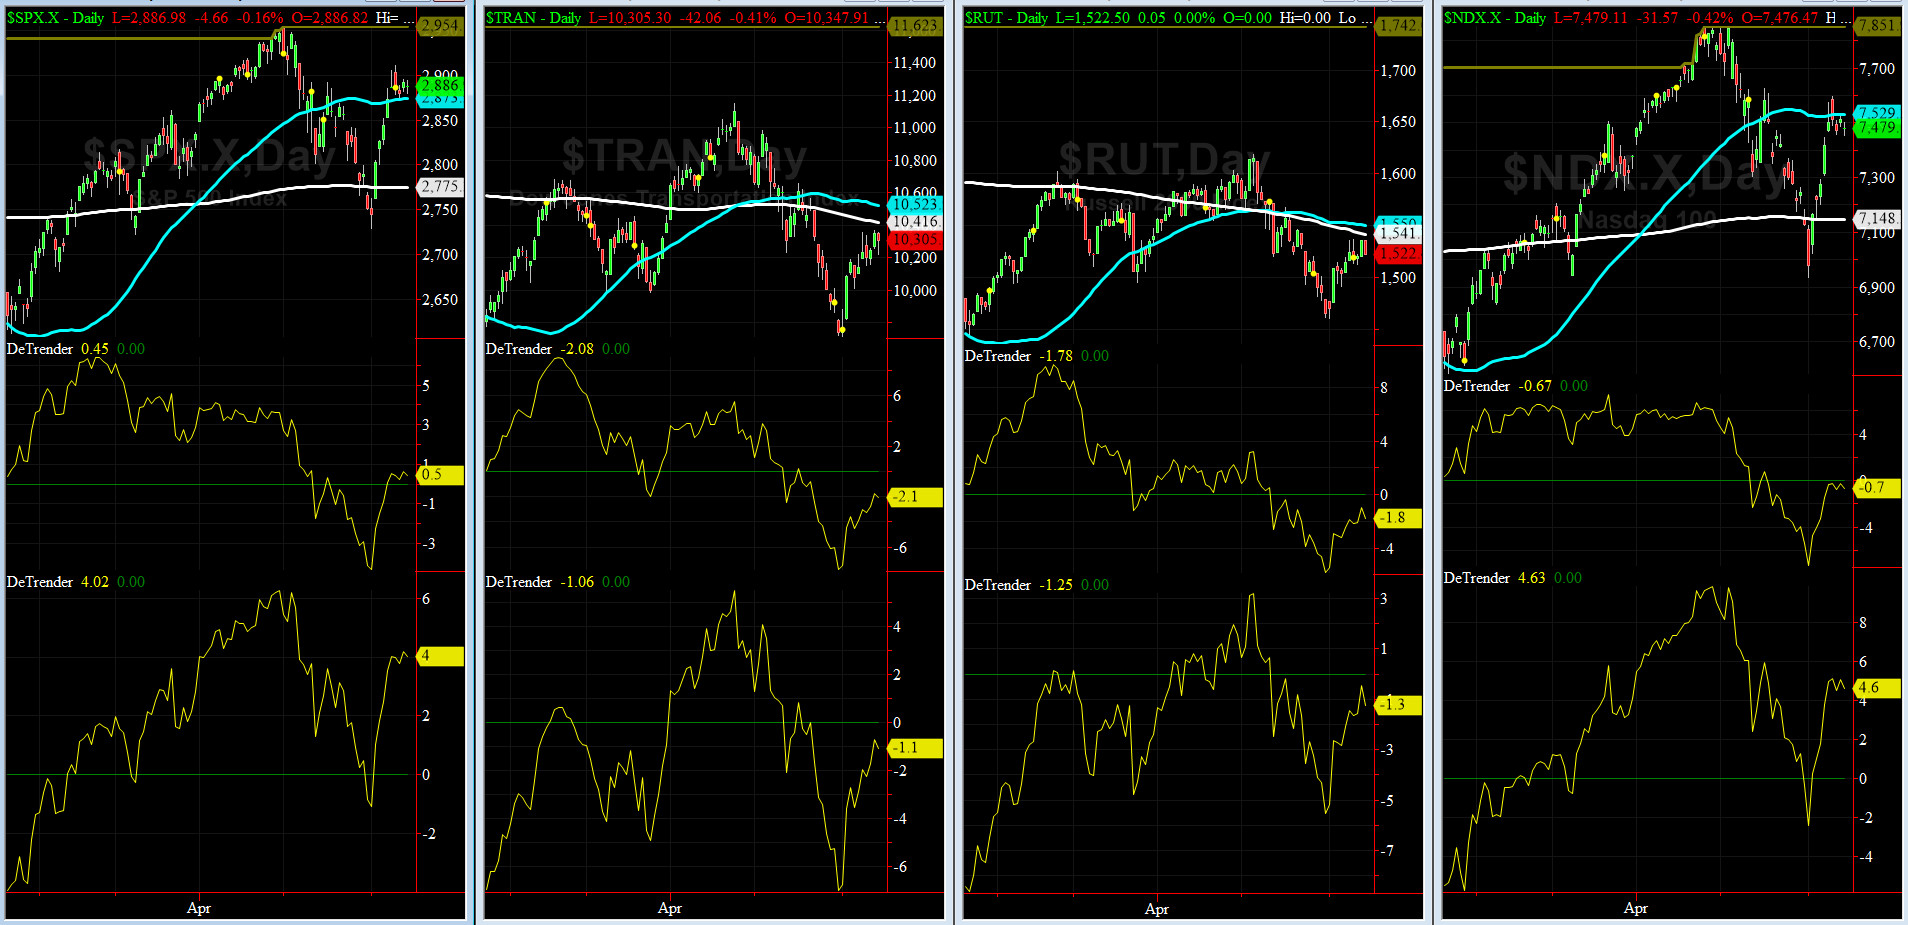
DeTrenders Charts for SPX, NDX, TRAN & RUT Indices
50-Day MA SPX = 2874 or 0.5% BELOW SPX (max observed in last 7 yrs = +8.6%, min = -9.3%)
200-Day MA SPX = 2775 or 4% BELOW SPX (max observed in last 7 yrs = 15.2%, min = -14%)
FIVE of our EIGHT DeTrenders are in the NEGATIVE territory. The DeTrenders for DJ Tran & RUT will continue to be harbingers of future price behavior in broad indices.
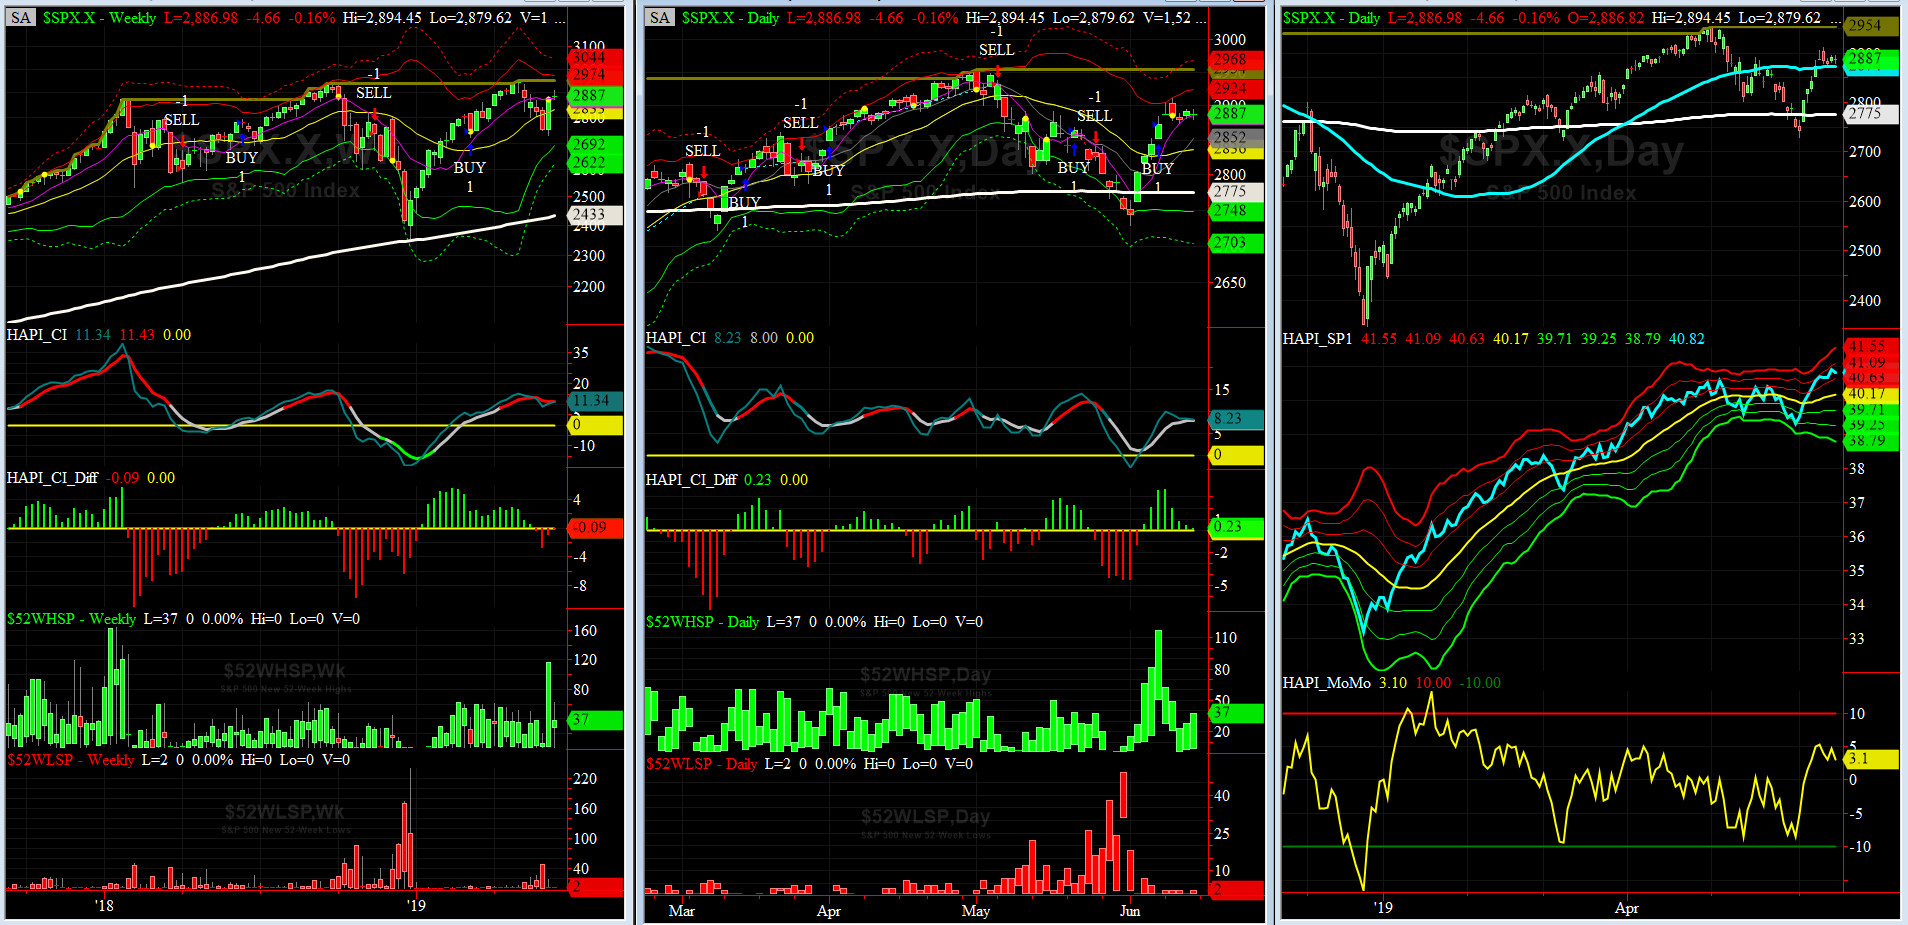
HA_SP1_Momo Chart
WEEKLY Timing Model = on a BUY Signal since Friday, March 8, 2019 CLOSE at 2743
DAILY Timing Model = on a BUY Signal since Friday, June 7, 2019 CLOSE at 2873
Max SPX 52wk-highs reading last week = 62 (over 120-140, the local maxima is in)
Max SPX 52wk-Lows reading last week = 2 (over 40-60, the local minima is in)
HA_SP1 closed near its +1.5 sigma channels
HA_Momo = +3.1 (reversals most likely occur above +10 or below -10)
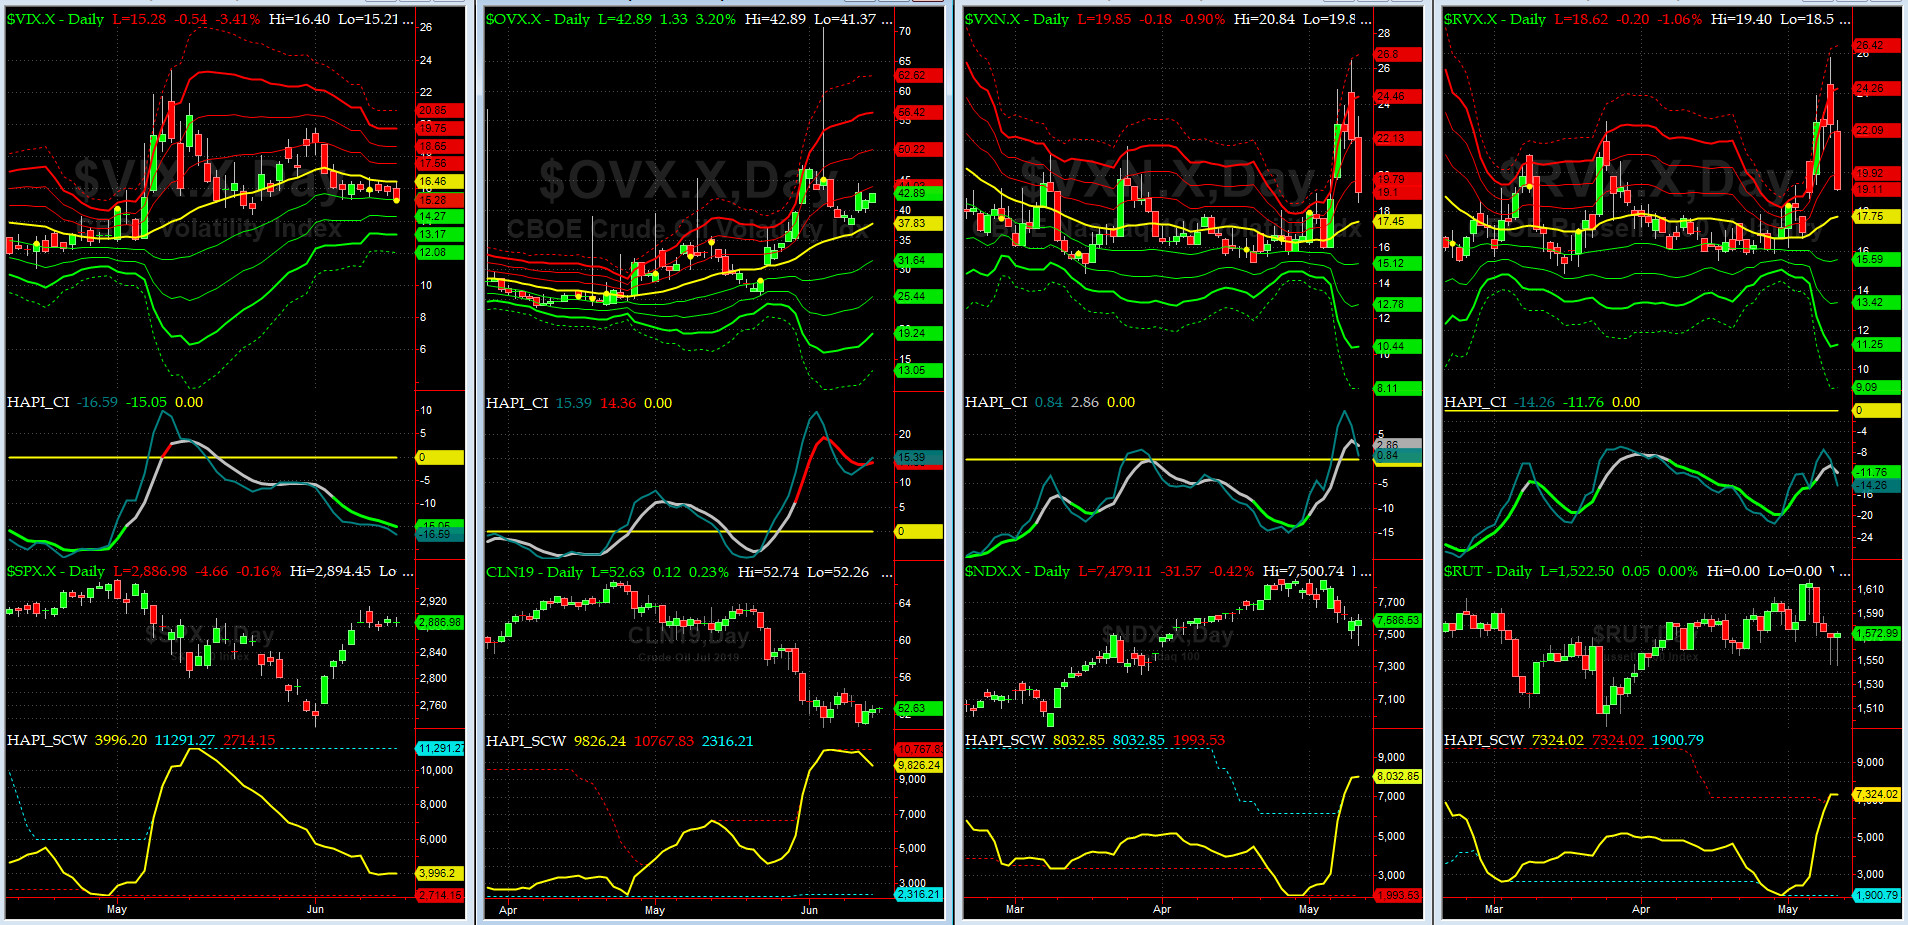
Vol of the Vols Chart
Spot VIX stood at 15.3 Friday night, at about its zero sigma (remember it's the VIX volatility pattern aka "its sigma channels" that matters, and not the level of VIX itself (this is per Dr. Robert Whaley, a great mentor and inventor of original VIX, now called VXO). VIX usually peaks around a test of its +4 sigma).
Vols of the Vols continue collapse. Keep your bet size in check. Long hot Summer days are here. Go to the Beach & switch to iced tea or mint julep.

5-day TRIN & TRINQ Charts
Both NYSE 5-day TRIN & NASDAQ 5-day TRINQ are in the NEUTRAL zone.
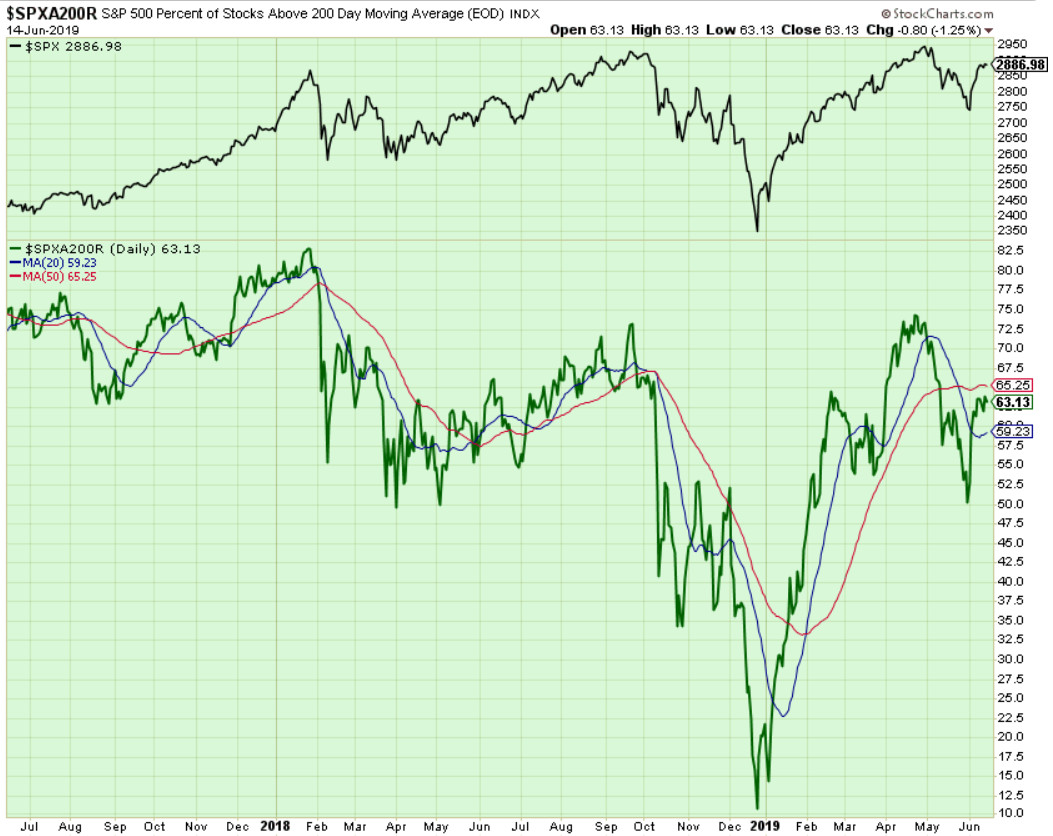
Components of SPX above their respective 200-day MA Chart
This scoring indicator stayred near 63% for most of the week. No signal here for now.
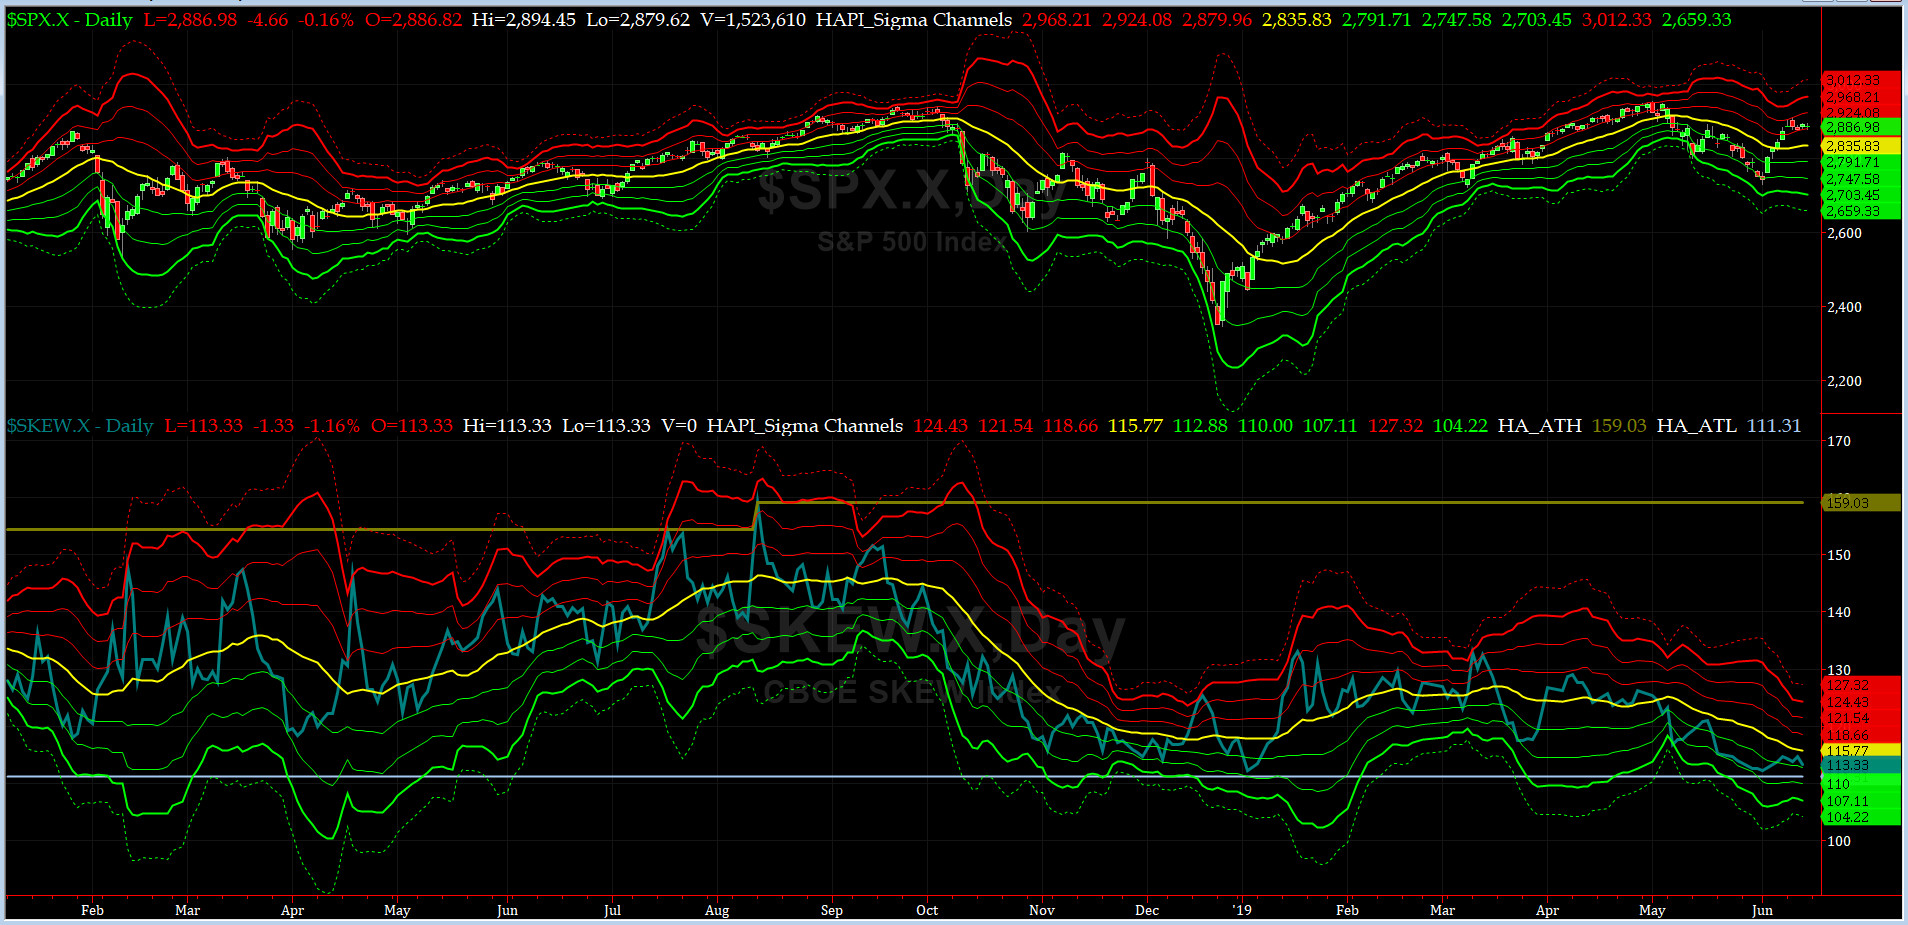
SPX SKEW (Tail Risk) Chart
On Friday, SPX SKEW (Tail Risk) closed near 113.3, now about its -1 sigma (normal = 115, range 100-150).
All quiet on the Eastern & Mid-Western Fronts? YES, this is according to our beloved HRH Capt Tiko, KCPE....
How to interpret the value of SPX SKEW? (from CBOE white paper on SKEW)

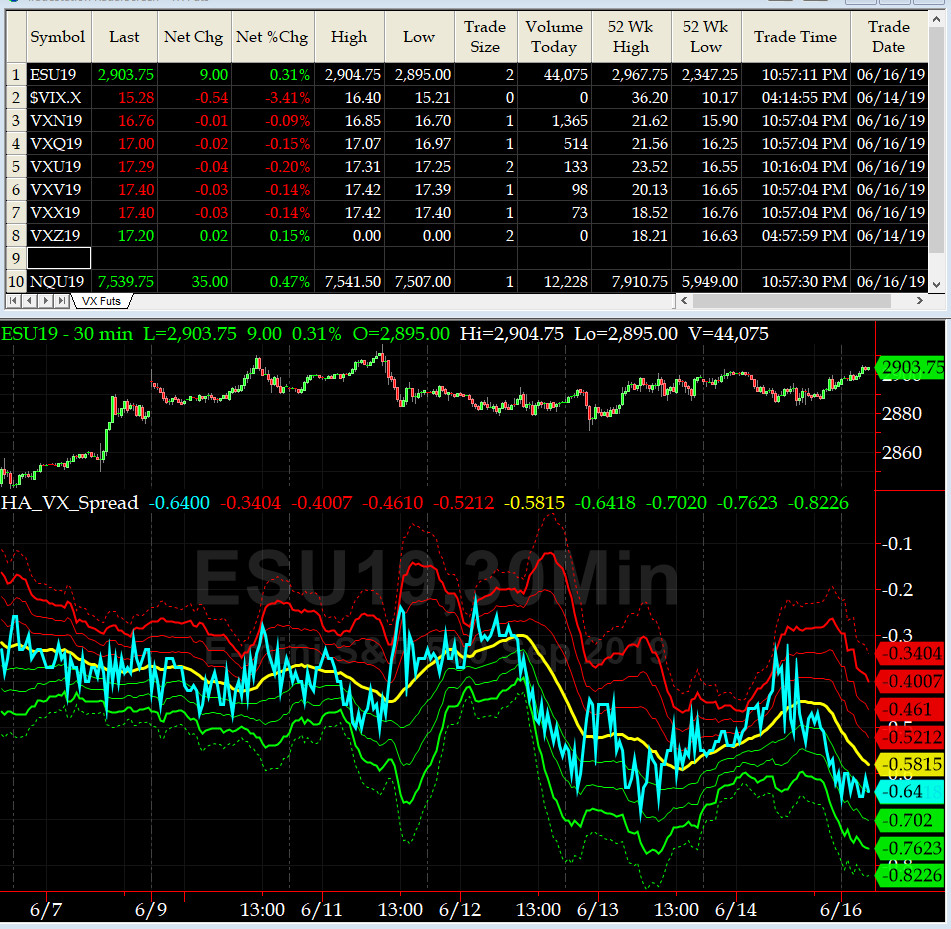
3-month VIX Futures Spread(VX) Chart
This popular timing indicator, (now long JUL19, & short OCT19 VIX Futures) hit -0.65 on Friday Close. No signal here.
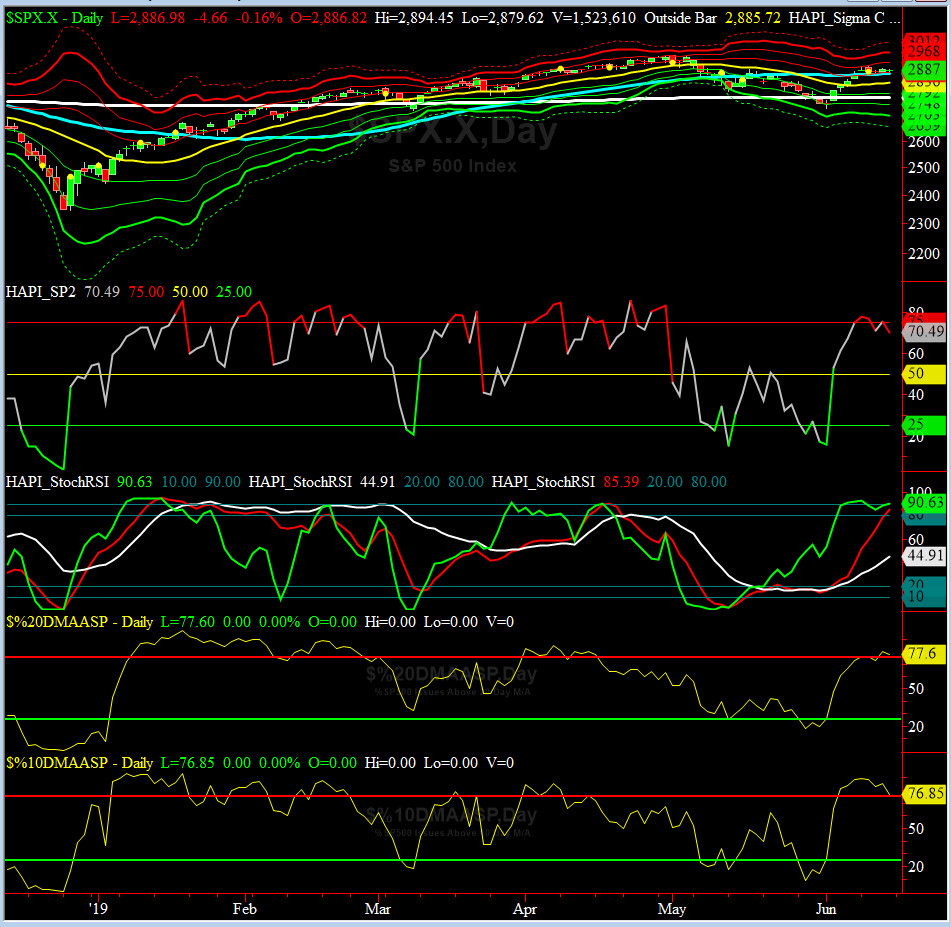
HA_SP2 Chart
HA_SP2 = 70.5 (Buy signal <= 25, Sell Signal >= 75)
Are we in a topping formation? we think so but stock up on iced tea, per HRH @Capt_Tiko.
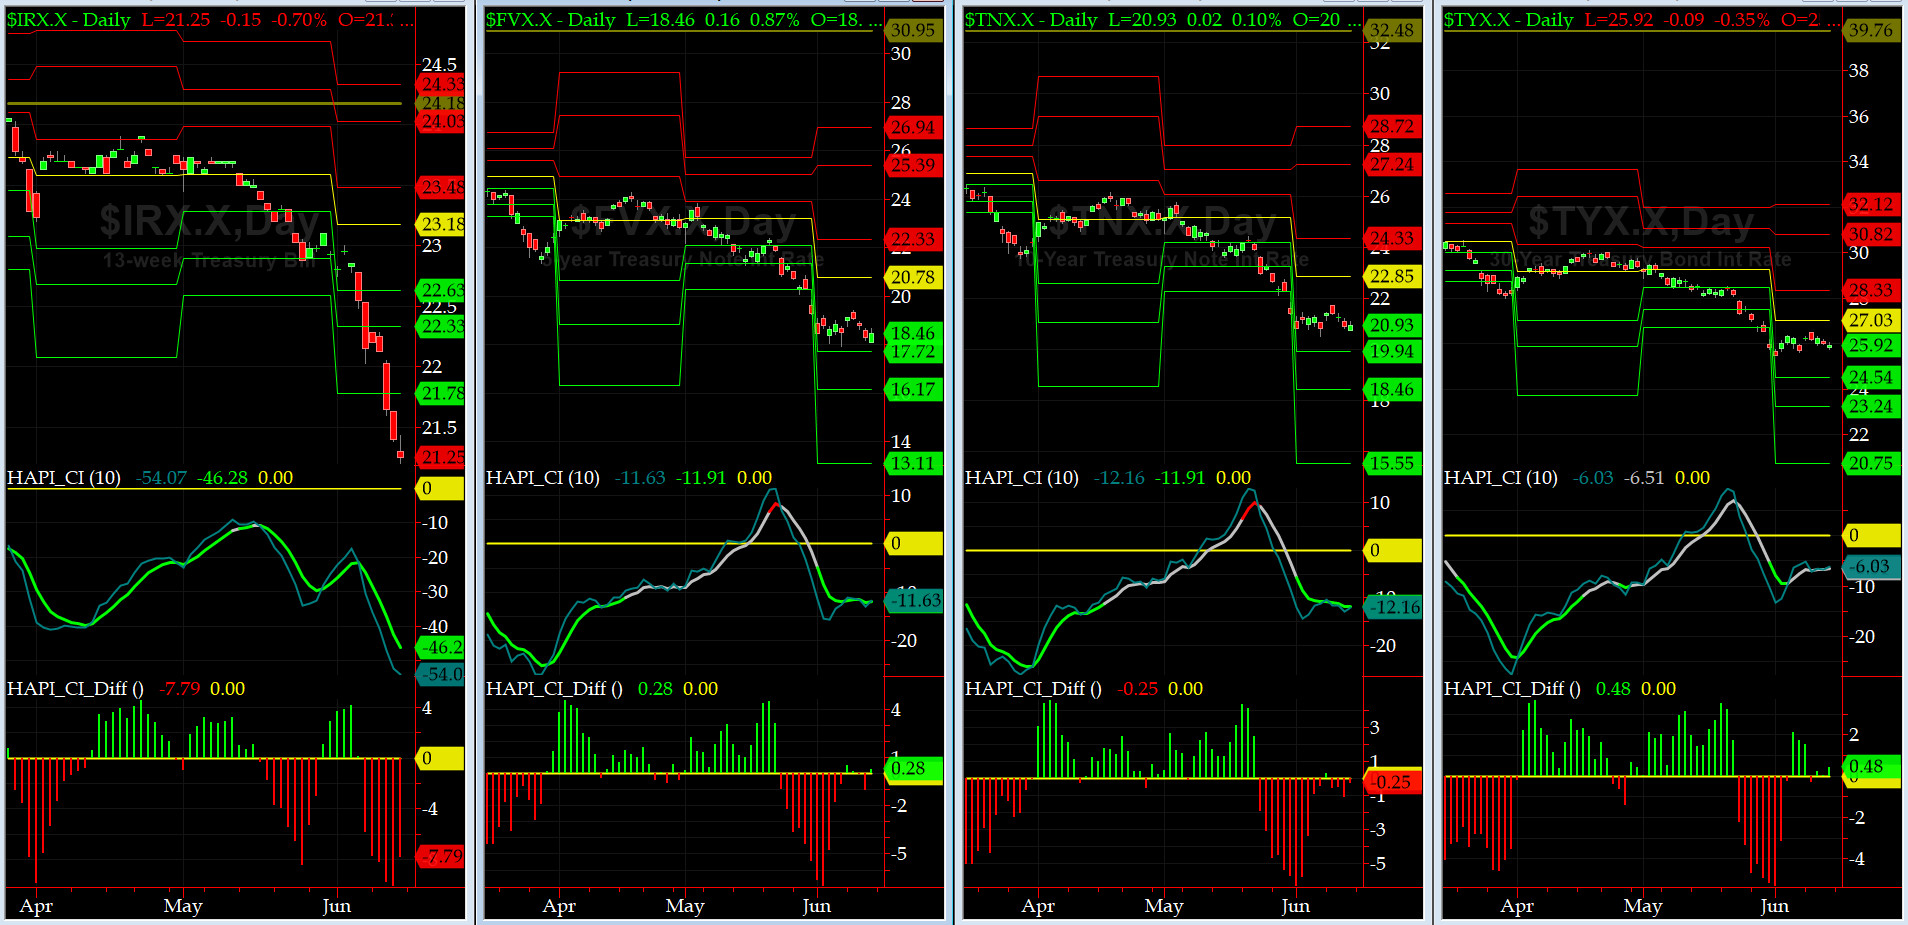
US Treasury T-Notes & T-Bonds Yields Chart
Last week the front end of yield curve again sank much faster than the long end. Maury & Grumpino (plus Trumpkins) are very upset as the rally in front end prices + decrease in crude oil prices signal a massive global economy slowdown.
Fari Hamzei
|


 Proactive Market Timing