|
Sunday, June 23, 2019, 2145ET
Market Timing Charts, Analysis & Commentary for Issue #296
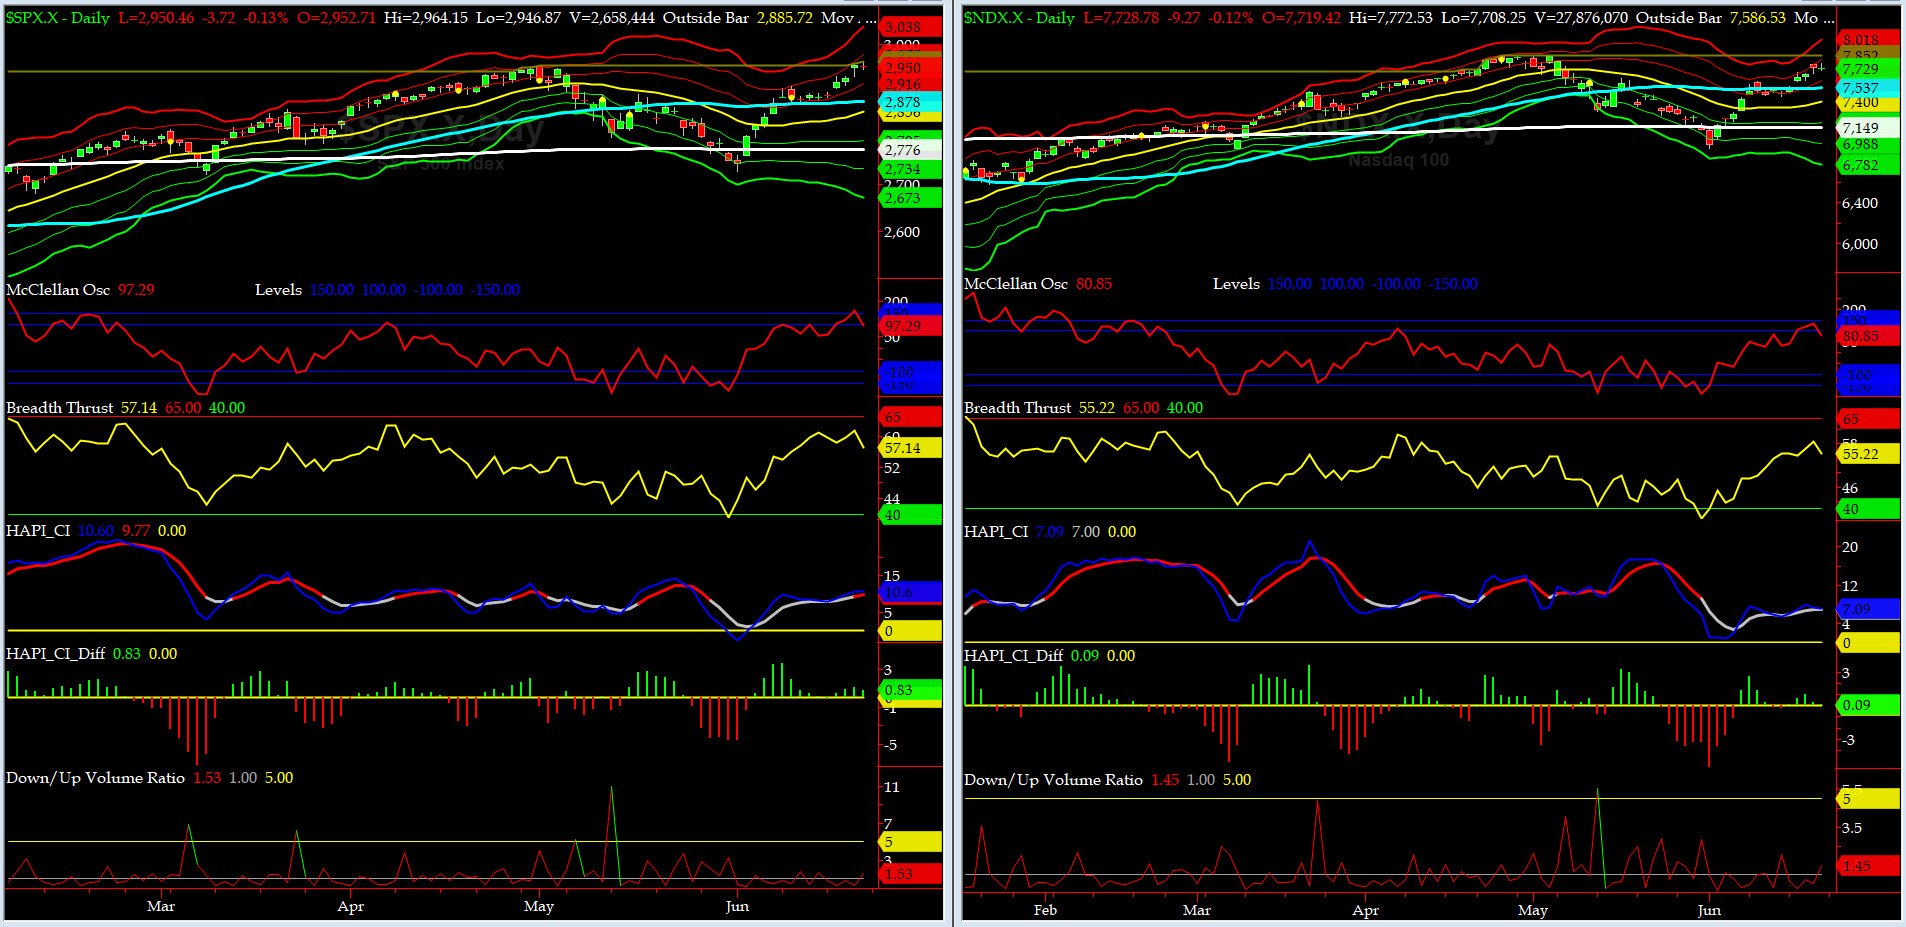
Timer Charts of S&P-500 Cash Index (SPX) + NASDAQ-100 Cash Index (NDX)
Most recent S&P-500 Cash Index (SPX): 2950 up +63 (up +2.2%) for the week ending on Friday, June 21, 2019, which closed near its +2 sigma.
DJIA ALL TIME INTRADAY HIGH = 26951 (reached on Wednesday, October 3, 2018)
DJ TRAN ALL TIME INTRADAY HIGH = 11623 (reached on Friday, September 14, 2018)
SPX ALL TIME INTRADAY HIGH = 2964 (reached on Friday, June 21, 2019)
NDX ALL TIME INTRADAY HIGH = 7852 (reached on Wednesday, May 1, 2019)
RUT ALL TIME INTRADAY HIGH = 1742 (reached on Friday, August 31, 2018)
Current DAILY +2 Sigma SPX = 2977 with WEEKLY +2 Sigma = 2982
Current DAILY 0 Sigma SPX = 2856 with WEEKLY 0 Sigma = 2845
Current DAILY -2 Sigma SPX = 2734 with WEEKLY -2 Sigma = 2708
NYSE McClellan Oscillator = +97 (-150 is start of the O/S area; around -275 to -300 area or lower, we go into the �launch-pad� mode; over +150, we are in O/B area)
NYSE Breadth Thrust = 57.1 (40 is considered as oversold and 65 as overbought)
This past week, between the news about the forthcoming meeting of Xi and Grumpnio at G-20 Osaka Summit on Tuesday, and, the FOMC Communique on Wednesday, sent the stocks into a "mini-launch mode."
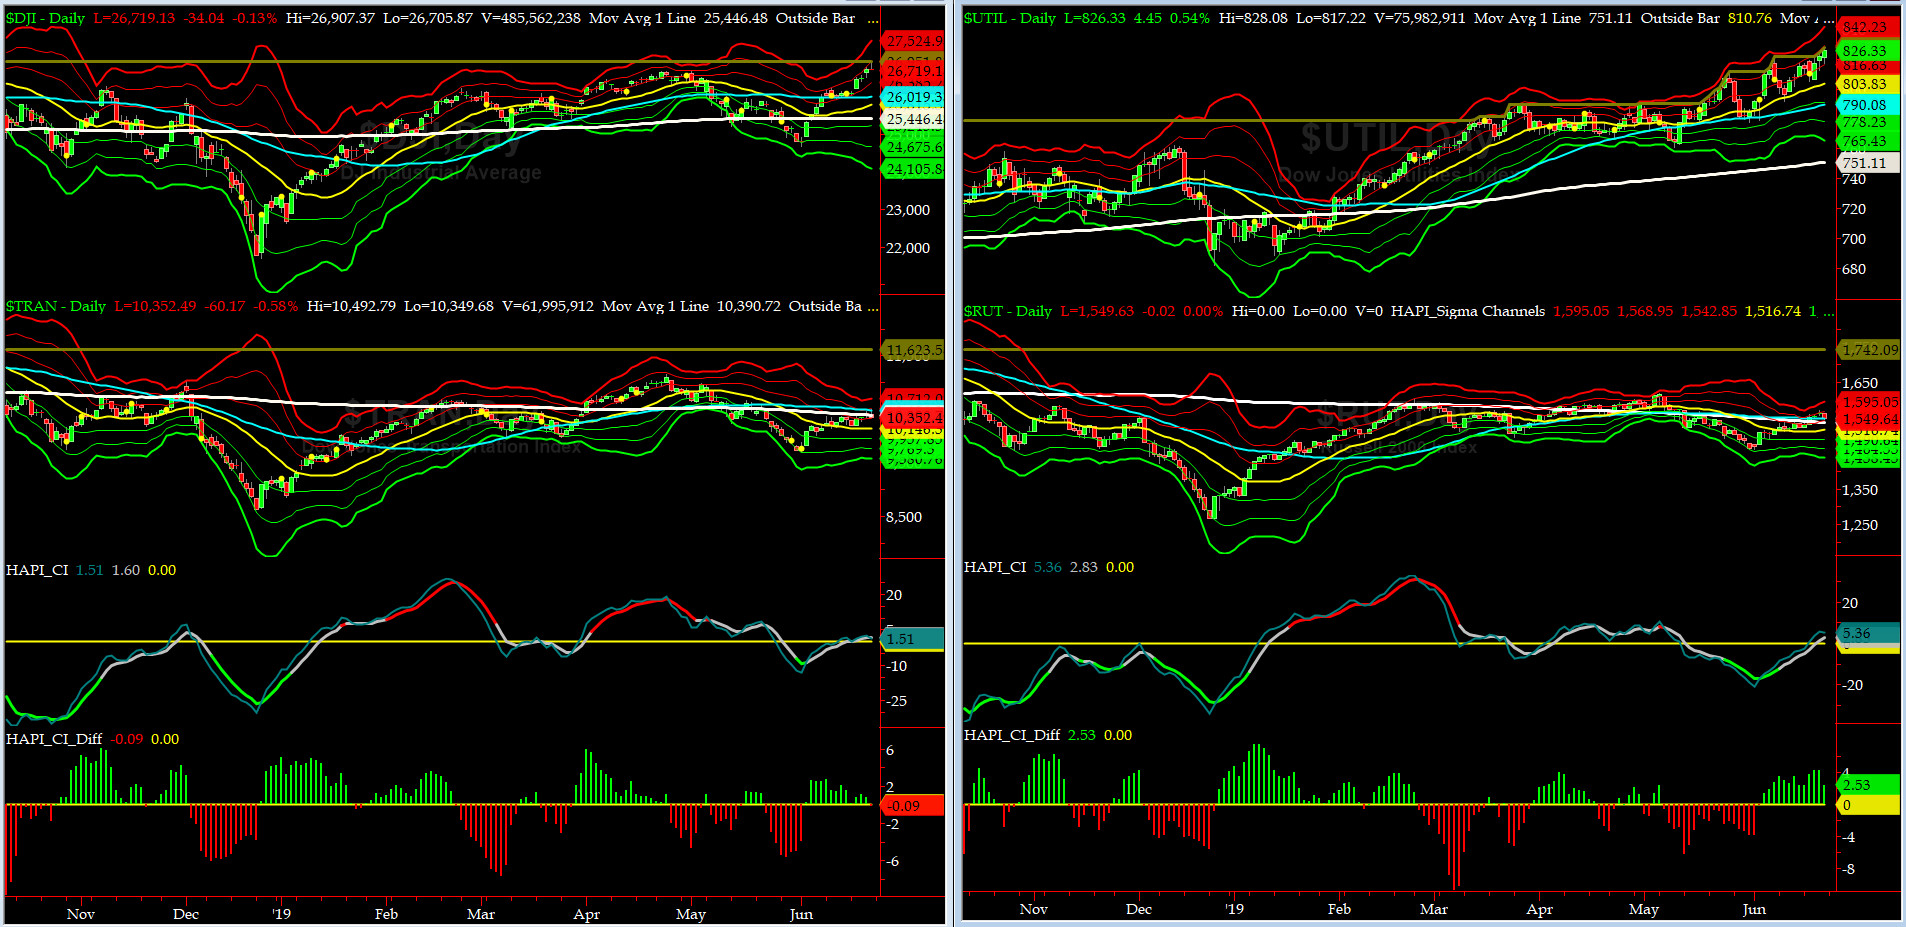
Canaries [in the Coal Mine] Chart for DJ TRAN & RUT Indices
200-Day MA DJ TRAN = 10,390 or 0.4% ABOVE DJ TRAN (max observed in last 7 yrs = 20.2%, min = -20.3%)
200-Day MA RUT = 1537 or 0.8% BELOW RUT (max observed in last 7 yrs = 21.3%, min = -22.6%)
DJ Transportation Index (proxy for economic conditions 6 to 9 months hence) had a nice rally but could NOT close above its 50-day MA.
Russell 2000 Small Caps Index (proxy for Risk ON/OFF) did a tad better but, RISK, is still OFF.....
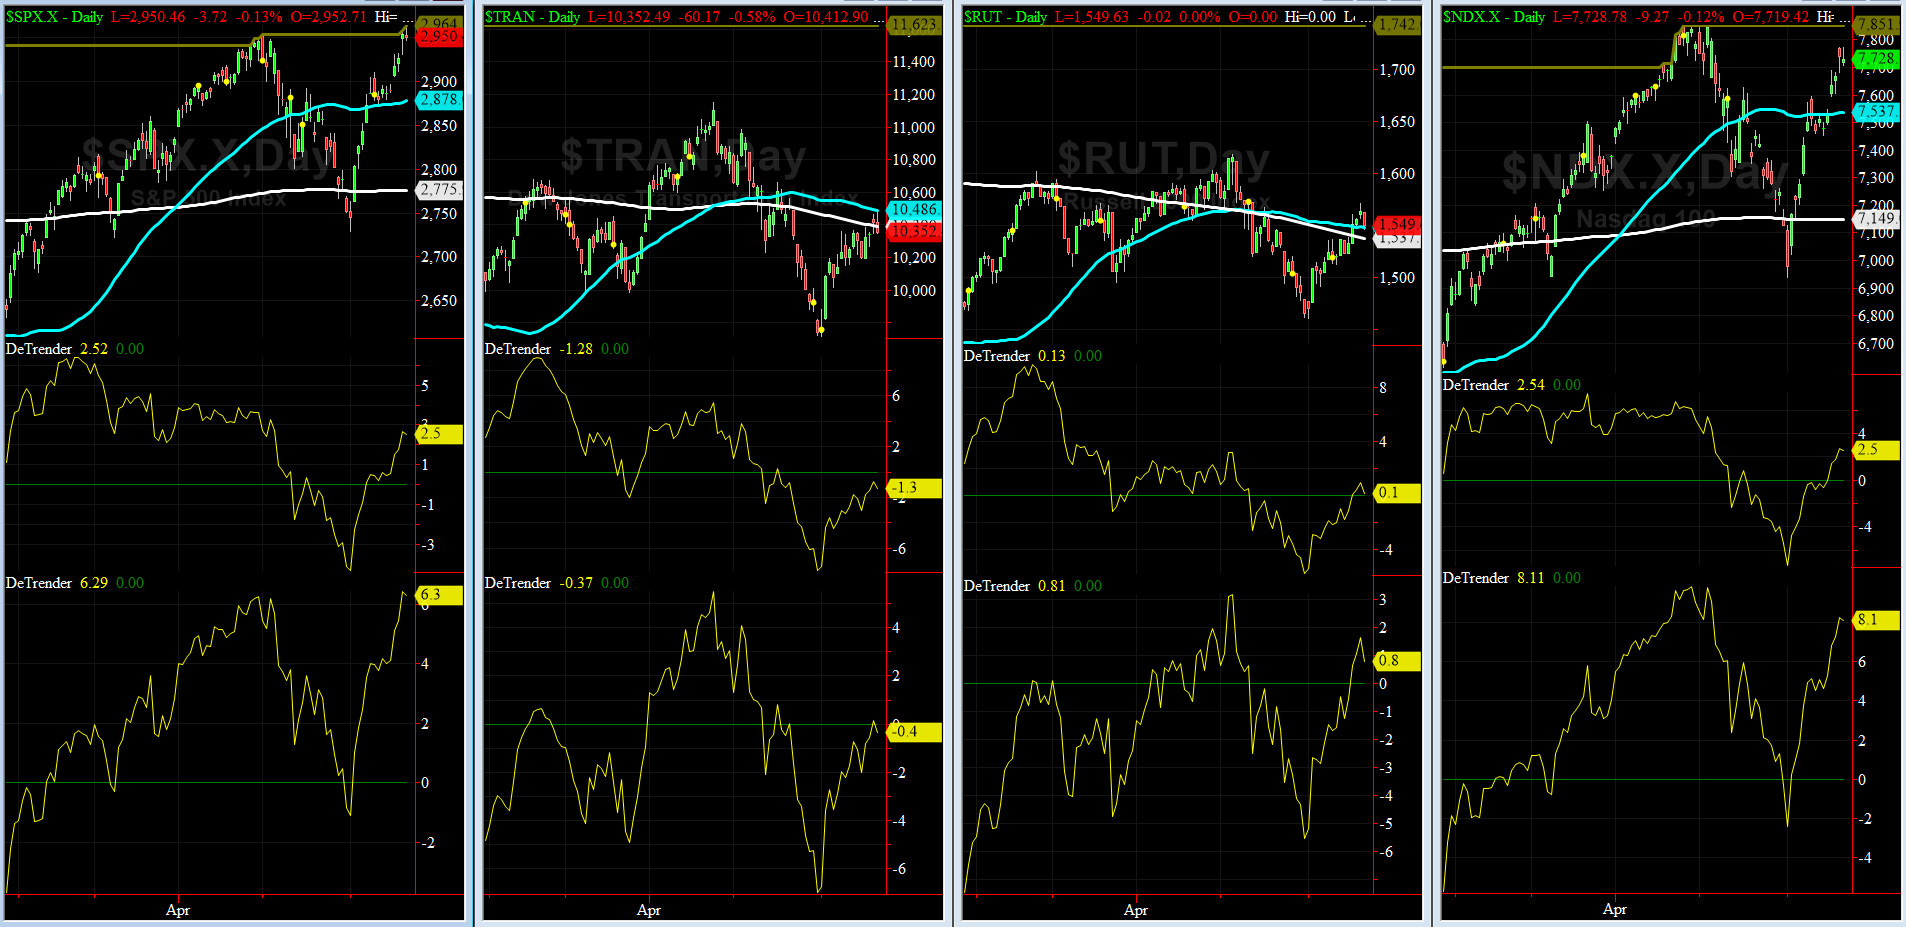
DeTrenders Charts for SPX, NDX, TRAN & RUT Indices
50-Day MA SPX = 2878 or 2.5% BELOW SPX (max observed in last 7 yrs = +8.6%, min = -9.3%)
200-Day MA SPX = 2775 or 6.3% BELOW SPX (max observed in last 7 yrs = 15.2%, min = -14%)
Only TWO of our EIGHT DeTrenders are in the NEGATIVE territory. The DeTrenders for DJ Tran & RUT will continue to be harbingers of future price behavior in broad indices.

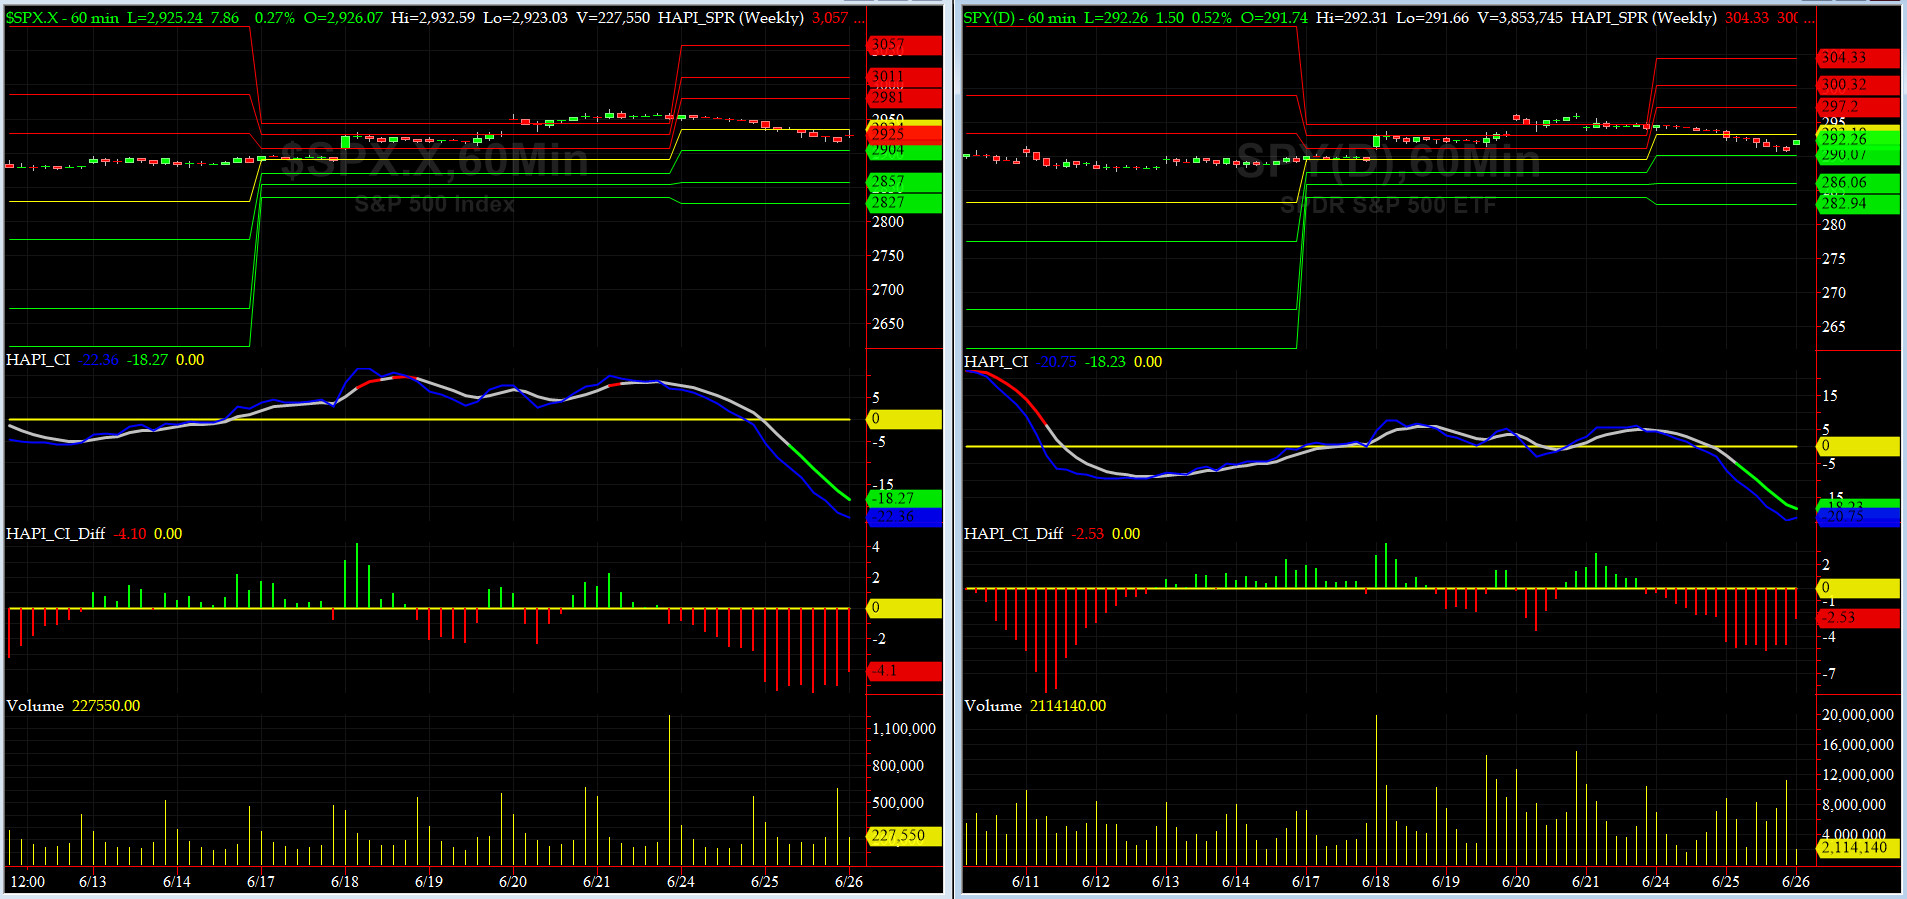
HA_SP1_Momo Chart
WEEKLY Timing Model = on a BUY Signal since Friday, March 8, 2019 CLOSE at 2743
DAILY Timing Model = on a BUY Signal since Friday, June 7, 2019 CLOSE at 2873
Max SPX 52wk-highs reading last week = 103 (over 120-140, the local maxima is in)
Max SPX 52wk-Lows reading last week = 2 (over 40-60, the local minima is in)
HA_SP1 closed near its +2 sigma channels
HA_Momo = +4.8 (reversals most likely occur above +10 or below -10)
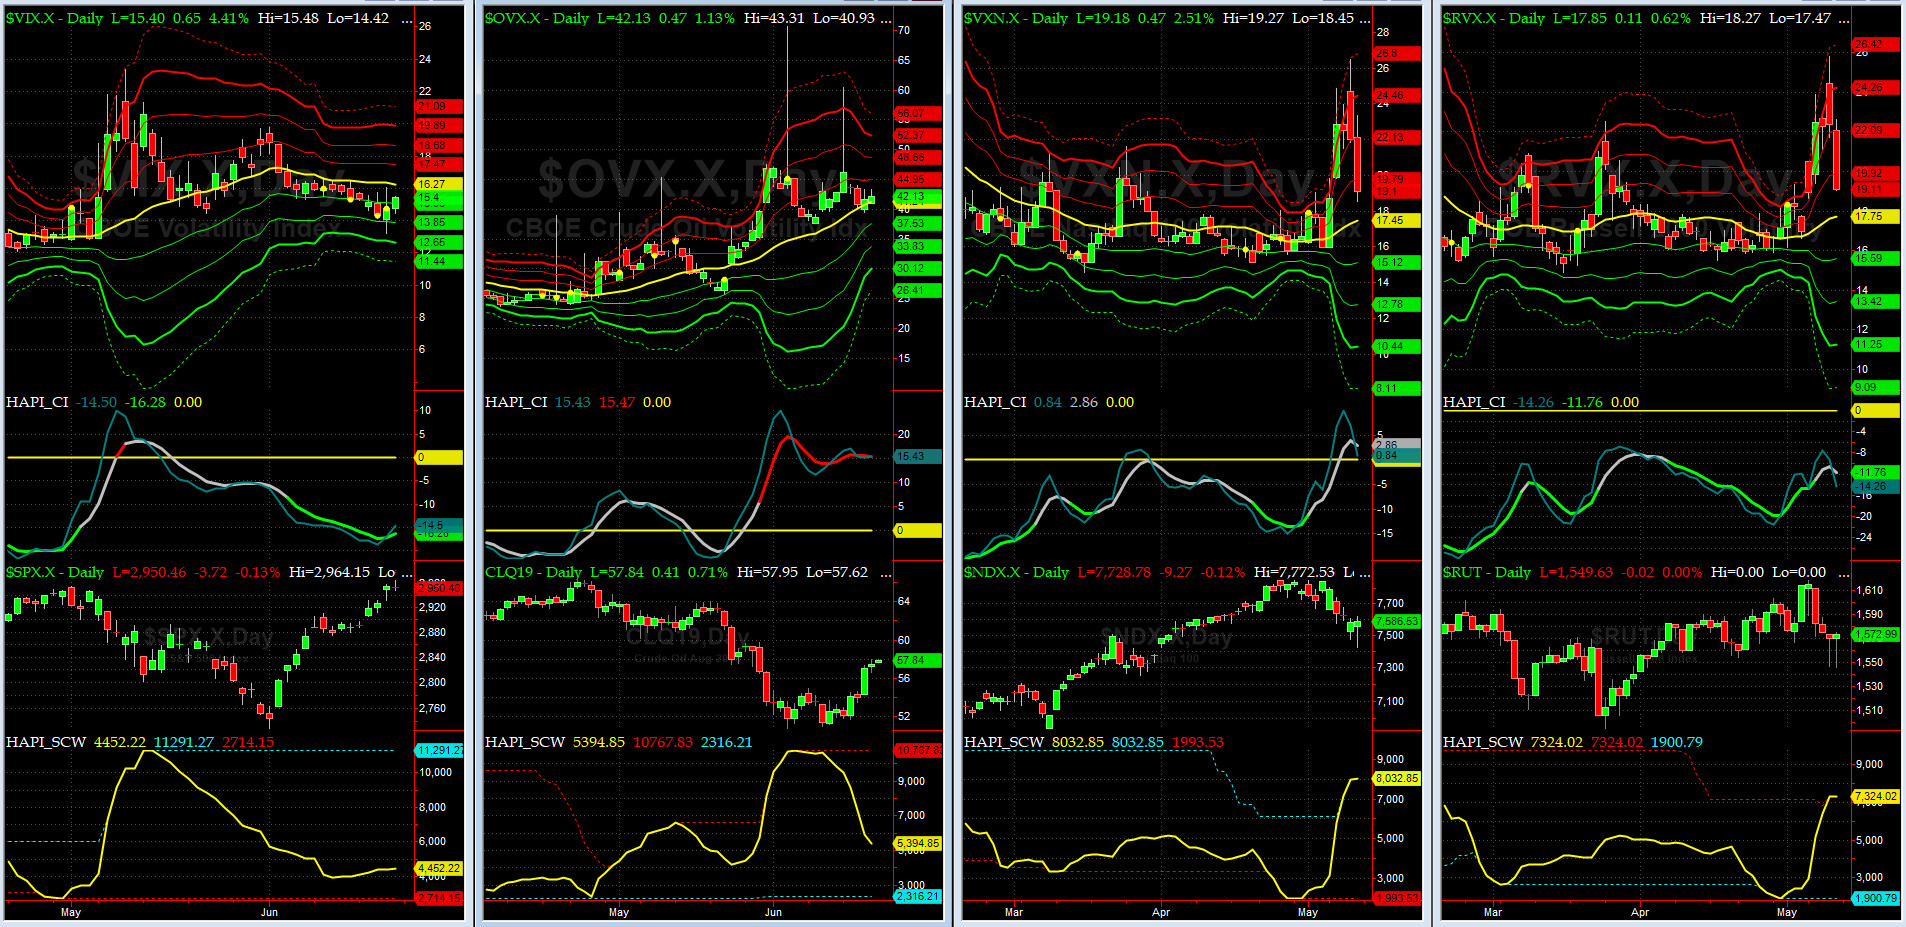
Vol of the Vols Chart
Spot VIX stood at 15.4 Friday night, at about its -1 sigma (remember it's the VIX volatility pattern aka "its sigma channels" that matters, and not the level of VIX itself (this is per Dr. Robert Whaley, a great mentor and inventor of original VIX, now called VXO). VIX usually peaks around a test of its +4 sigma).
Vols of the Vols are flat here. Long hot Summer days are here. Go to the Beach & switch to iced tea or mint julep.
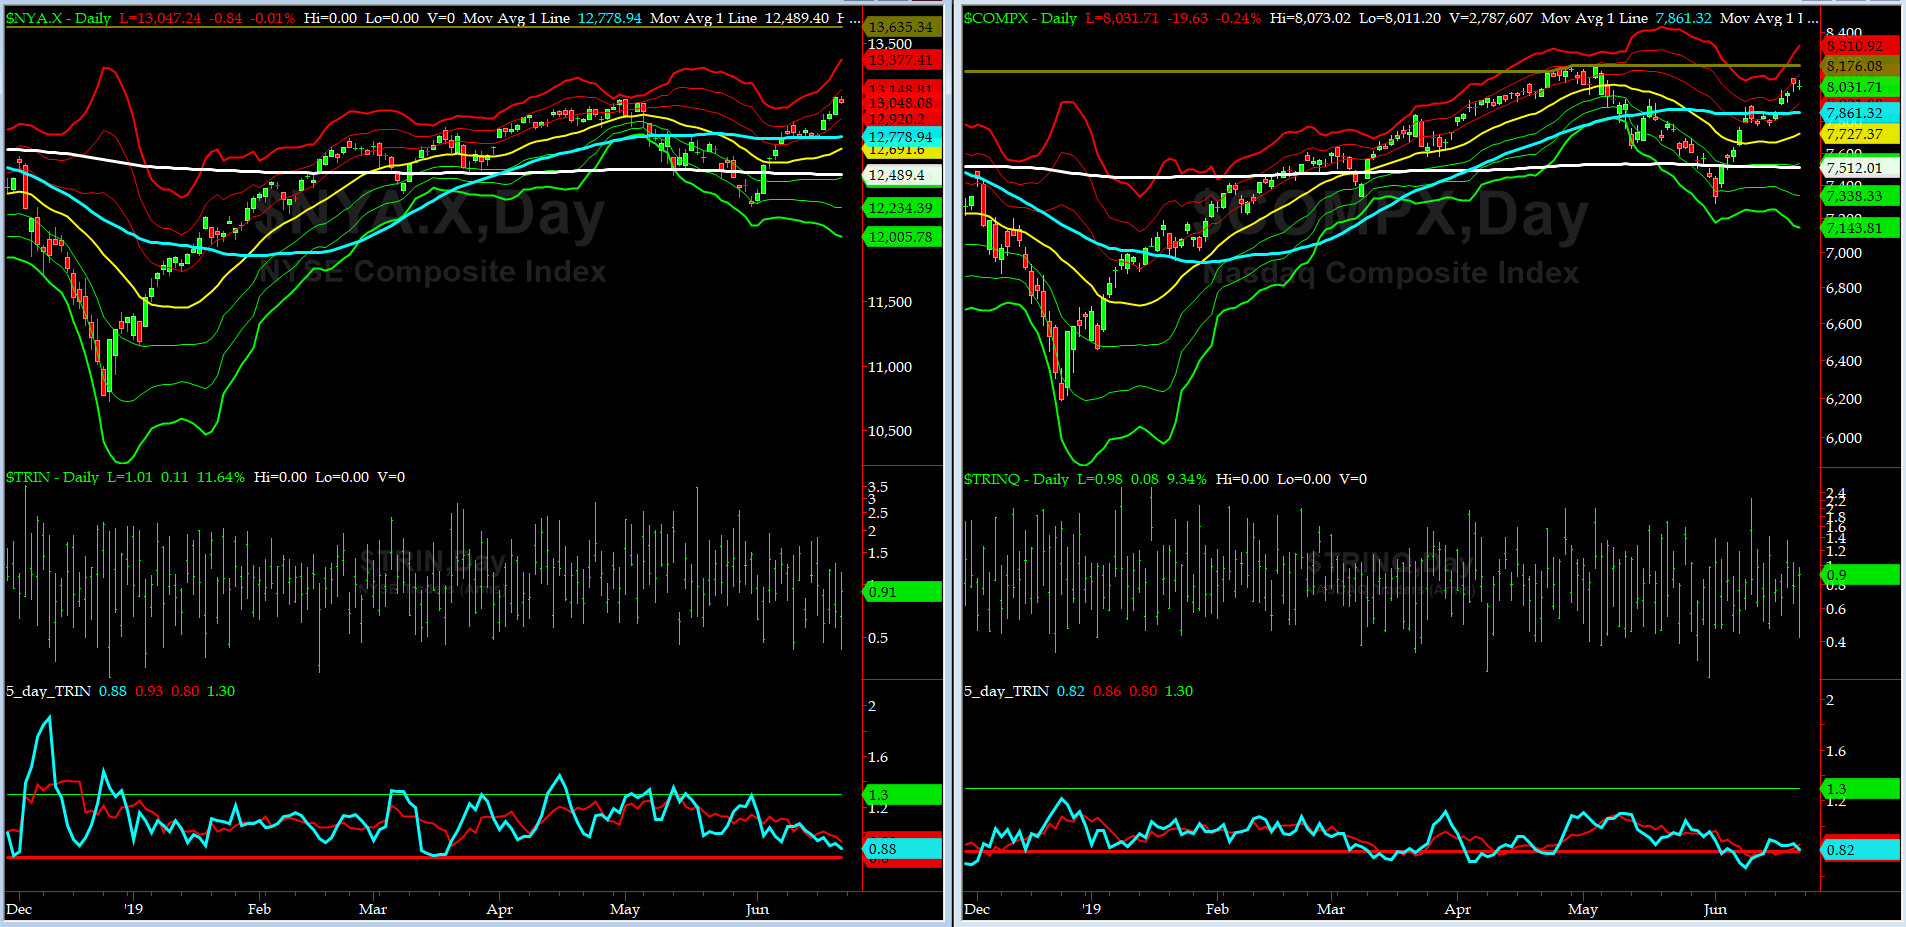
5-day TRIN & TRINQ Charts
Both NYSE 5-day TRIN & NASDAQ 5-day TRINQ are fast approaching a [big?] SELL SIGNAL very soon.
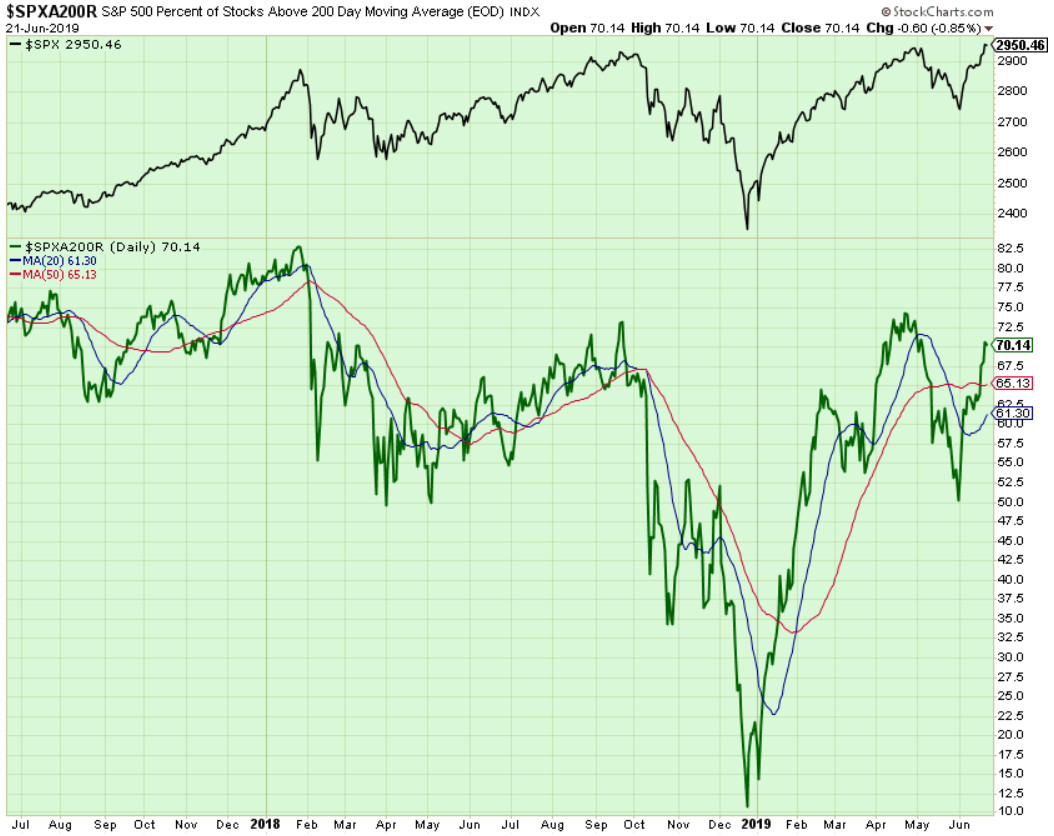
Components of SPX above their respective 200-day MA Chart
This scoring indicator rallied hard to 70% by the close of the week. This week, we need to keep an eye on this indicator. You can view it on StockCharts.com.
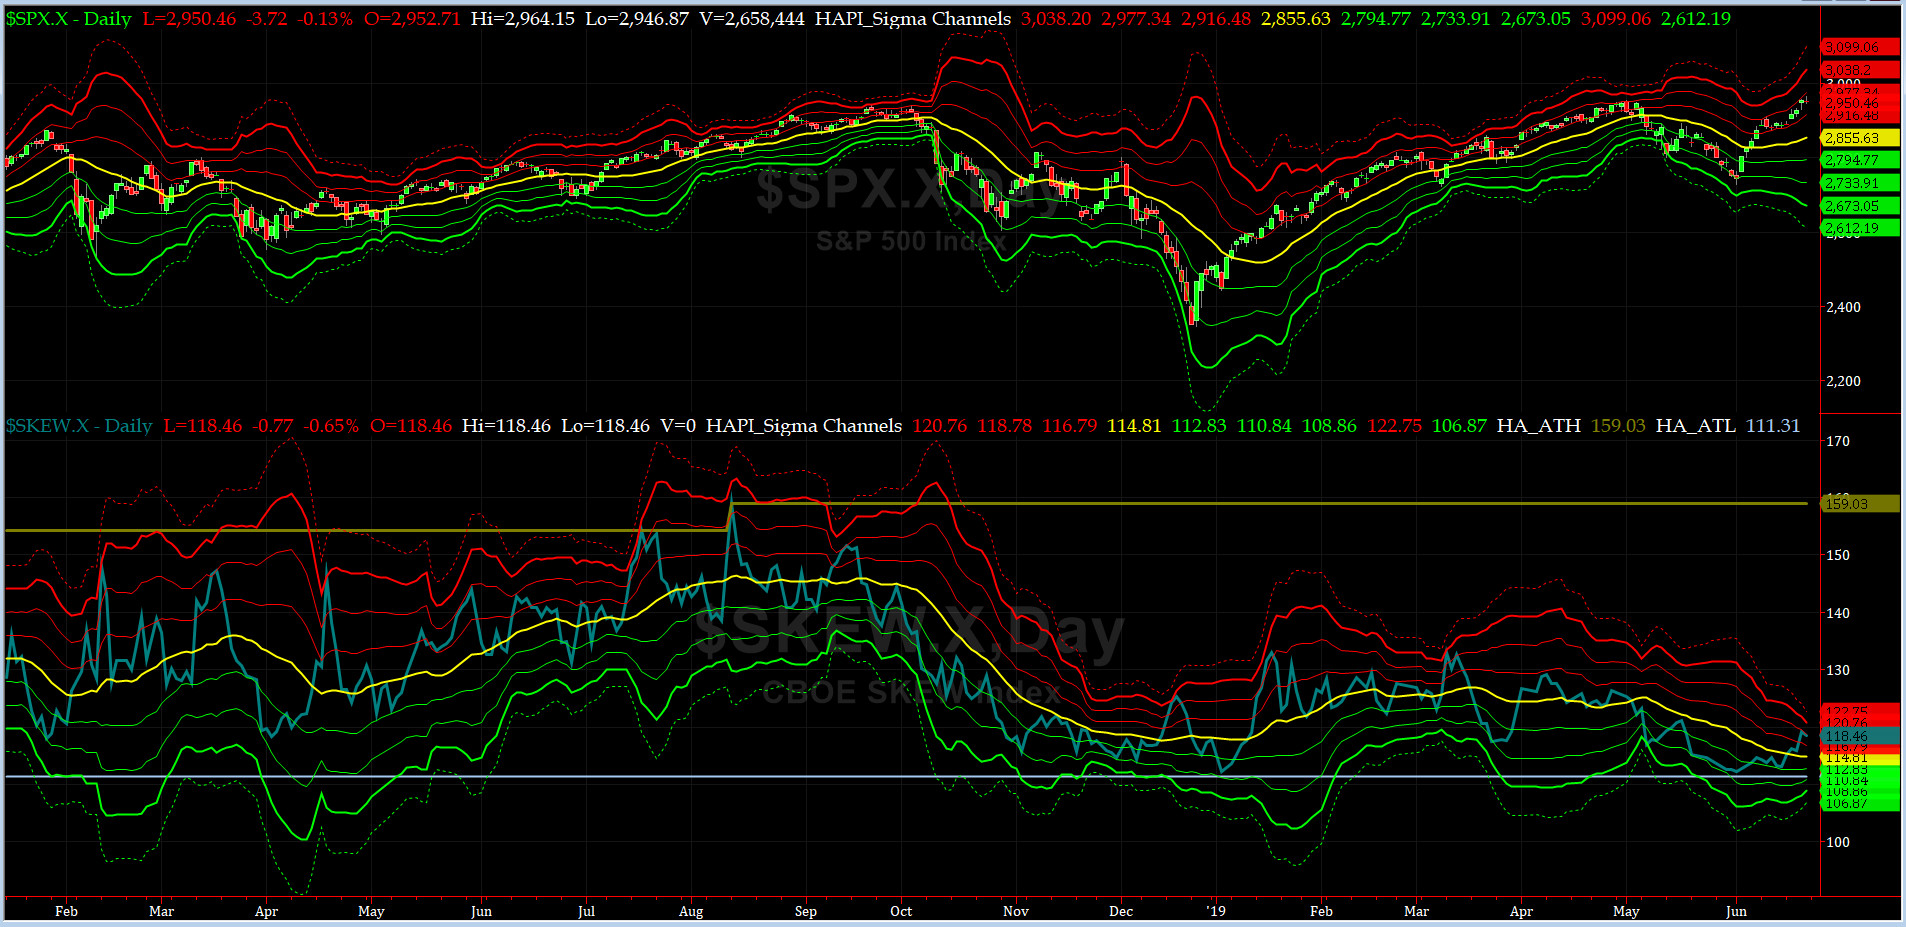
SPX SKEW (Tail Risk) Chart
On Friday, SPX SKEW (Tail Risk) closed near 118.5, now about its +2 sigma (normal = 115, range 100-150).
All quiet on the Eastern & Mid-Western Fronts? YES, INDEED....says our beloved HRH Capt Tiko, KCPE.
How to interpret the value of SPX SKEW? (from CBOE white paper on SKEW)

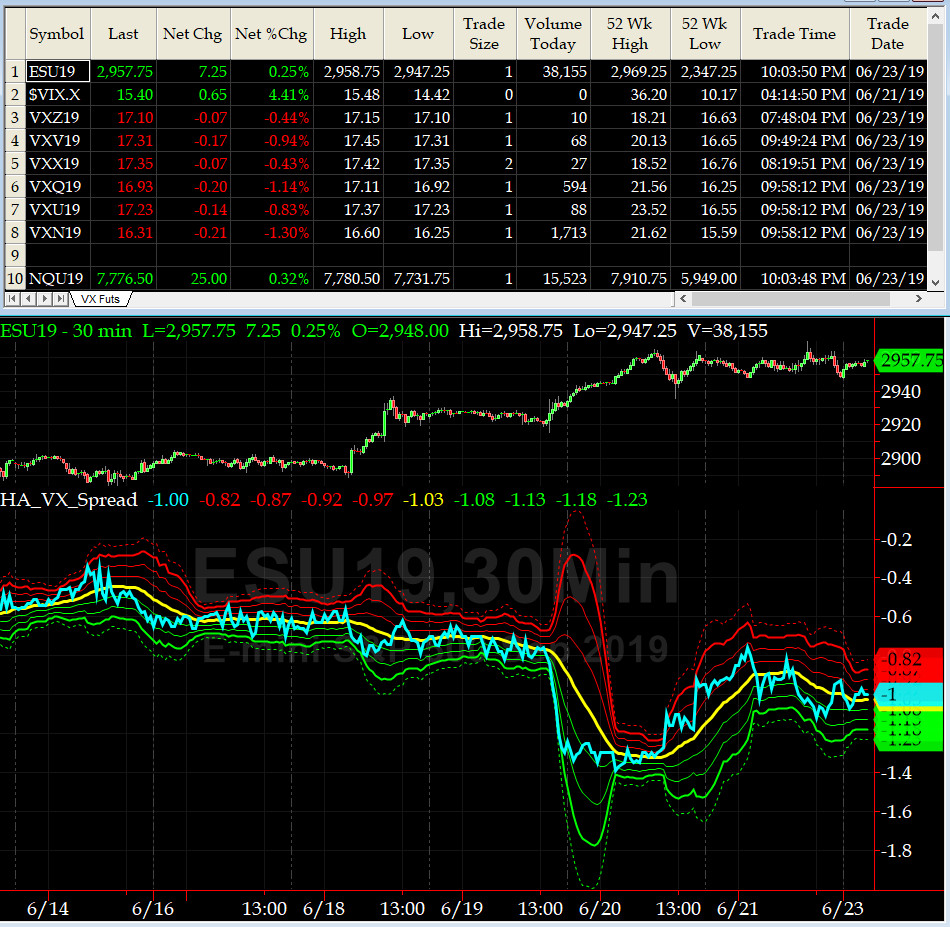
3-month VIX Futures Spread(VX) Chart
This popular timing indicator, (now long JUL19, & short OCT19 VIX Futures) hit -1.01 on Friday Close. No signal here.
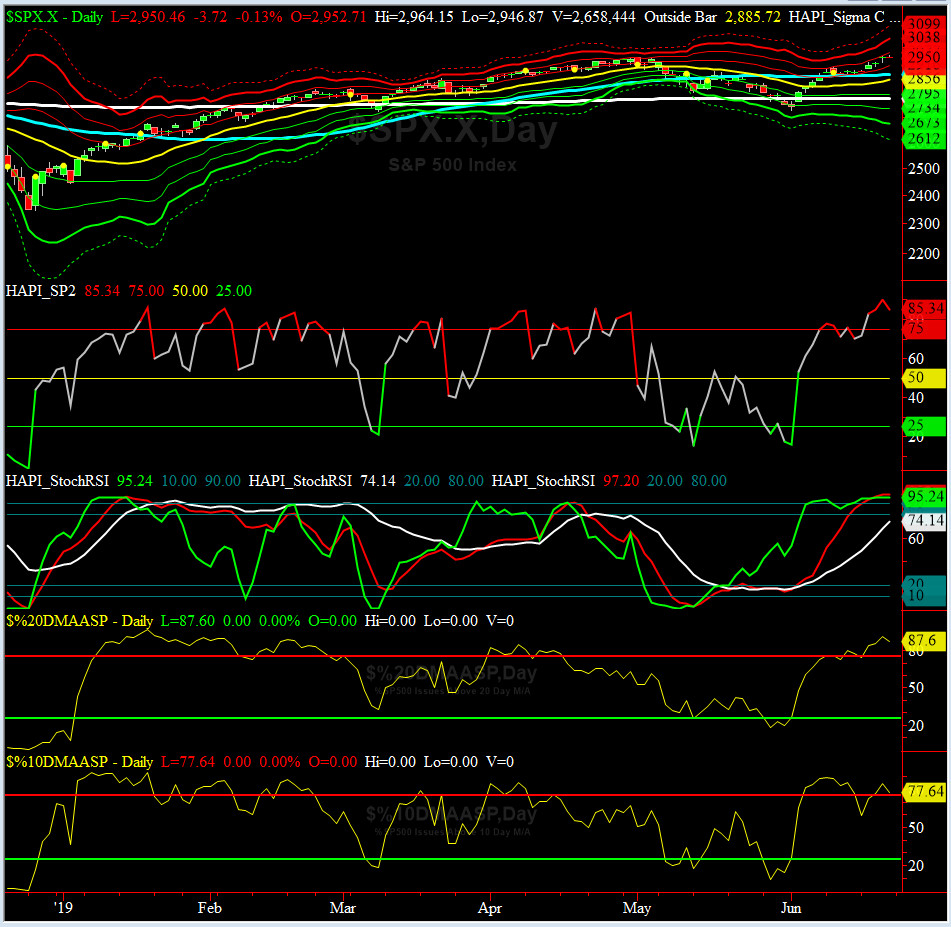
HA_SP2 Chart
HA_SP2 = 85.3 (Buy signal <= 25, Sell Signal >= 75)
Are we in a topping formation? again yes we think so but again also stock up on iced tea, per HRH @Capt_Tiko.
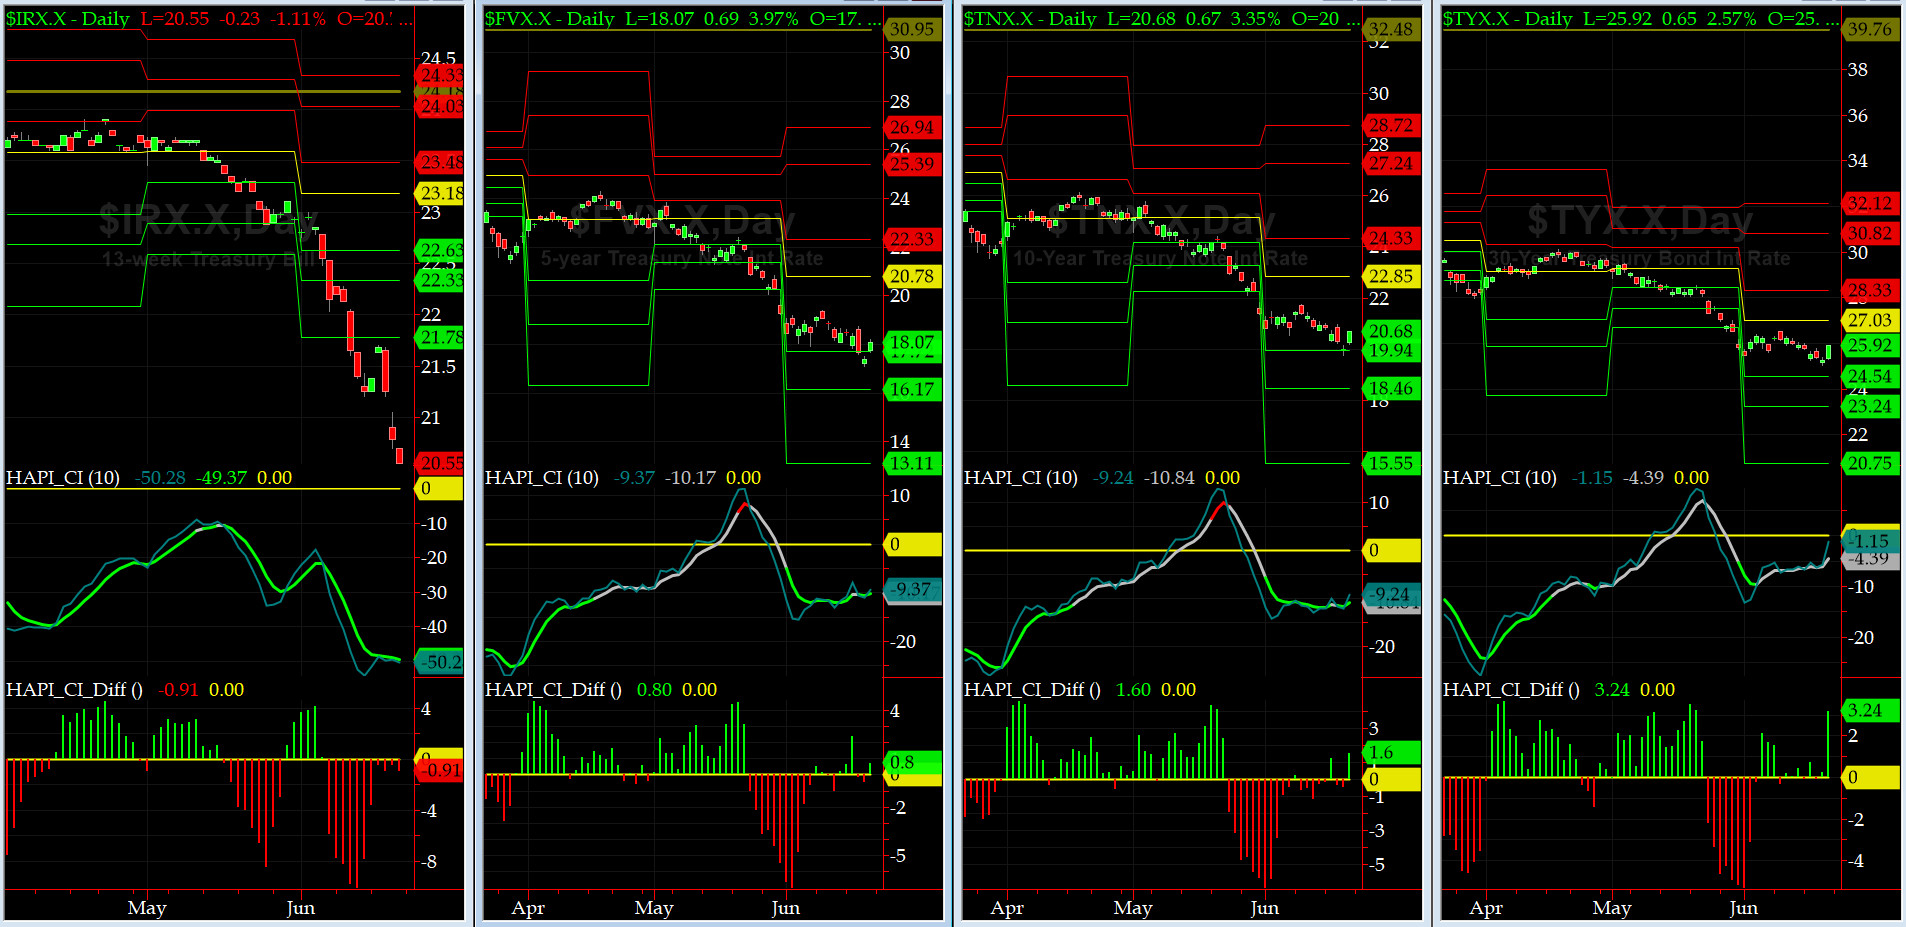
US Treasury T-Notes & T-Bonds Yields Chart
Last week the whole YTM Curve took a massive dive. History has shown us that when we have strong inverted yield curve, a [sizable?] recession is looming, may a year or two from now...... Maury & Grumpino (plus Trumpkins) are, for now, in eternal words of Pink Floyd: Comfortably Numb.
Fari Hamzei
|


 Proactive Market Timing