
|
 |
 |
 |
 |
 |
 |
 |
 |
 Proactive Market Timing Proactive Market Timing
|
|
|
Most Recent PMT vs SPX Performance Chart

|
|
|
|
Tuesday, July 9, 2019, 1020ET
Companion Chart for Market Bias Review, Issue #298

|
|
|
|
|
|
Tuesday, July 9, 2019, 1015ET
Market Bias for Issue #298
Our current Market Bias with Timer Digest is SHORT SPX as of Jul 8 at 2976
Our previous Market Bias was LONG SPX as of Jun 26 at 2942
Here are the trade parameters for this week:
SPX Money Management Stop for 100% of our position = 2990
SPX BreakEven Stop (Current Price) for last 20% of our position = 2970
SPX Primary Profit Target for first 80% of our position = 2940
SPX Secondary Profit Target for last 20% of our position = 2925
|
| Action |
Asset |
Expiration |
Strike |
Option |
| BUY |
SPY |
Friday JUL 26 |
296 |
Puts |
| SELL SHORT |
SPY |
Friday JUL 26 |
292 |
Puts |
| You need to execute both legs and hold it as a Put-Spread.
|
Note A:
Once the Primary Profit Target has been reached, traders are advised to close 80% of their position in order to lock in profits. The remaining balance can be carried over with a BreakEven STOP, based on the SPX level at the time of entry, in order to make the trade a zero-risk trade with the final position running to reach the Secondary Profit Target.
Once either Secondary Profit or Money Management (BreakEven STOP after the 80% peel-off) is hit, our Option/ETF trade for that week is over. Go to Cash and wait for the next PMT Issue.
Note B:
When we change our Market Bias with Timer Digest, You need to go FLAT asap. With PMT Pro, that is before the Close that day and with the basic PMT, at the open of the next day. The following trading day, we will issue new SPX targets and a new SPY options trade, as long our new market bias with Timer Digest is NOT flat.
Fari Hamzei
|
|
|
|
|
|
Tuesday, July 9, 2019, 0010ET
Notice of Change of Bias with Timer Digest
Dear Jim,
We wrote to our PMT Members thirty minutes before the Cash Open this morning: while we were not too thrilled to short this market, we also lack the conviction to get long for an extended play and we hope that we would have a better resolution in a day [or so]!!
Well, after reviewing the settlement data this evening, specifically our prop SP2 Indicator, TRAN DeTrenders nearing its death cross, TRINQ flashing a SELL signal and noticing the strong bearish divergence between our prop SP1 vs momo Indicators, it is our belief that our bias should shift to the downside!
Going SHORT SPX��
Fari Hamzei
|
|
|
|
|
|
Monday, July 8, 2019, 1030ET
Companion Chart for Market Bias Review, Issue #298

|
|
|
|
|
|
Monday, July 8, 2018, 1025ET
Market Bias for Issue #298
Our current Market Bias with Timer Digest is LONG SPX as of JUN 28 at 2942
Our previous Market Bias was SHORT SPX as of JUN 25 at 2917
Here are the trade parameters for this week:
SPX Secondary Profit Target for last 20% of our position = 3020
SPX Primary Profit Target for first 80% of our position = 3000
SPX BreakEven Stop (Current Price) for last 20% of our position = 2974
SPX Money Management Stop for 100% of our position = 2960
|
| Action |
Asset |
Expiration |
Strike |
Option |
| BUY |
SPY |
Friday JUL 26 |
297 |
Calls |
| SELL SHORT |
SPY |
Friday JUL 26 |
302 |
Calls |
| You need to execute both legs and hold it as a Call-Spread.
|
Note A:
Once the Primary Profit Target has been reached, traders are advised to close 80% of their position in order to lock in profits. The remaining balance can be carried over with a BreakEven STOP, based on the SPX level at the time of entry, in order to make the trade a zero-risk trade with the final position running to reach the Secondary Profit Target.
Once either Secondary Profit or Money Management (BreakEven STOP after the 80% peel-off) is hit, our Option/ETF trade for that week is over. Go to Cash and wait for the next PMT Issue.
Note B:
When we change our Market Bias with Timer Digest, You need to go FLAT asap. With PMT Pro, that is before the Close that day and with the basic PMT, at the open of the next day. The following trading day, we will issue new SPX targets and a new SPY options trade, as long our new market bias with Timer Digest is NOT flat.
Fari Hamzei
|
|
|
|
|
|
Monday, July 8, 2019, 0830ET
Market Timing Charts, Analysis & Commentary for Issue #298
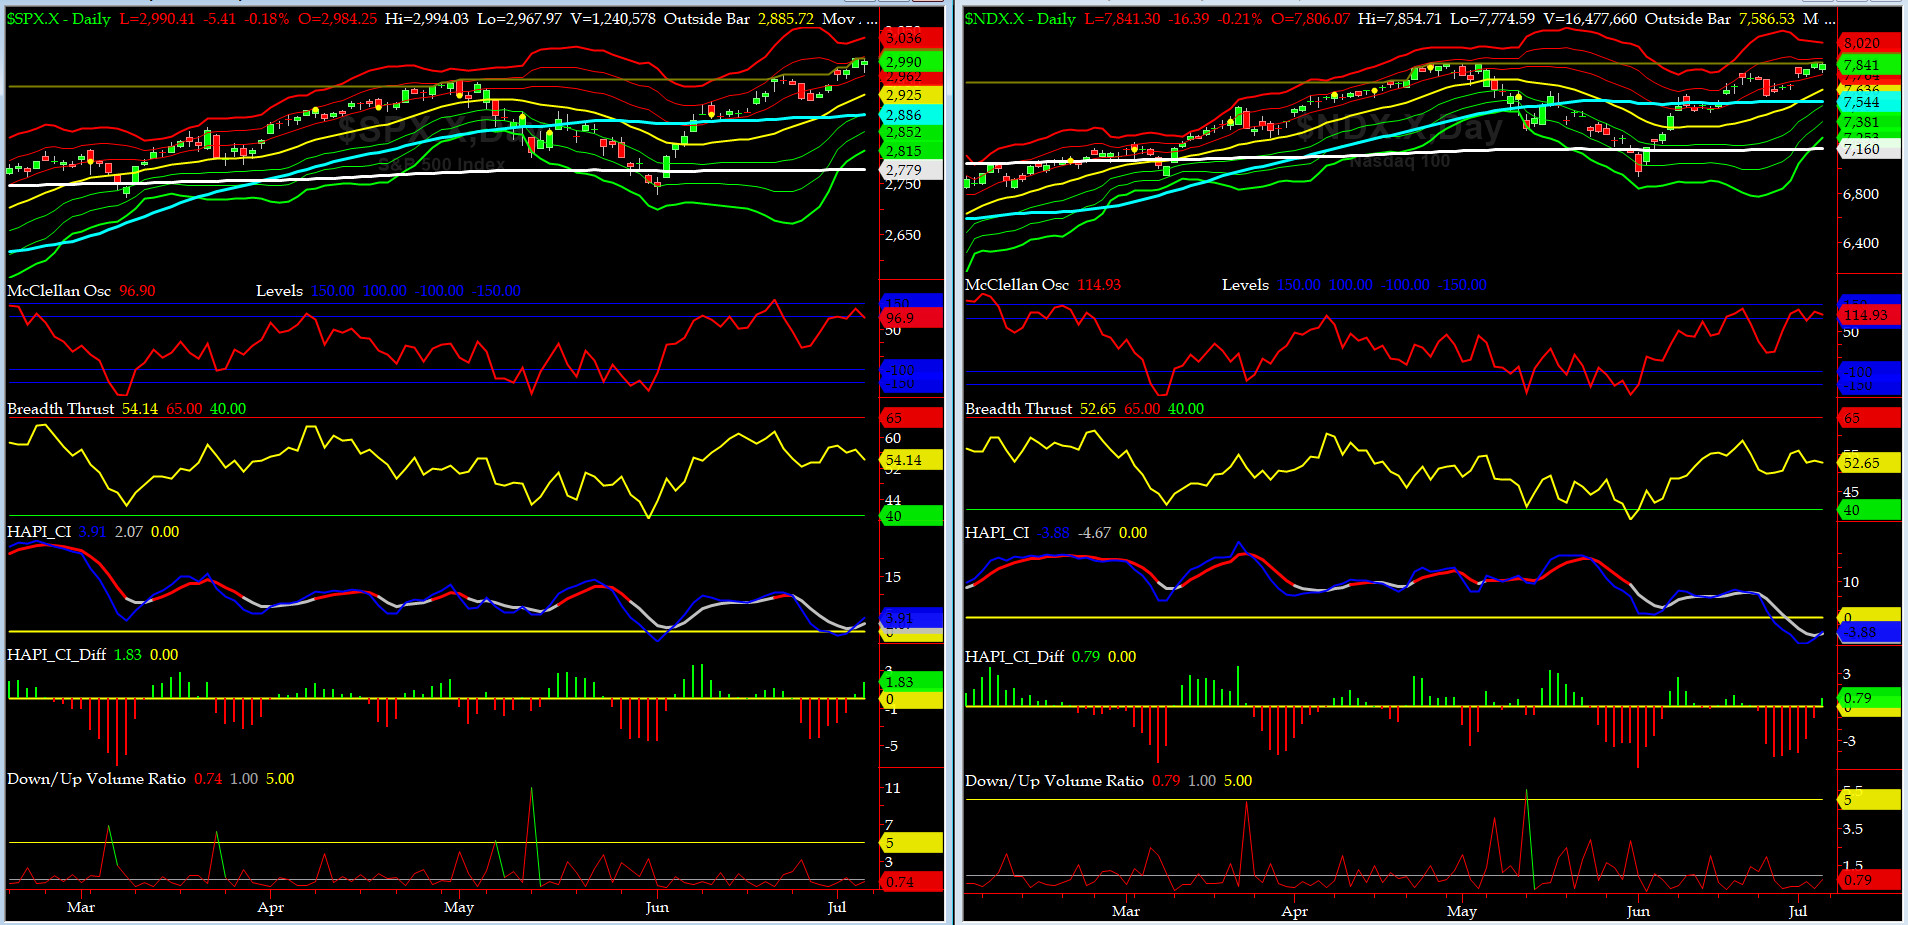
Timer Charts of S&P-500 Cash Index (SPX) + NASDAQ-100 Cash Index (NDX)
Most recent S&P-500 Cash Index (SPX): 2990 up +49 (up +1.67%) for the week ending on Friday, July 5, 2019, which closed near its +1 sigma.
DJIA ALL TIME INTRADAY HIGH = 26966 (reached on Wednesday, July 3, 2019)
DJ TRAN ALL TIME INTRADAY HIGH = 11623 (reached on Friday, September 14, 2018)
SPX ALL TIME INTRADAY HIGH = 2995 (reached on Wednesday, July 3, 2019)
NDX ALL TIME INTRADAY HIGH = 7857 (reached on Wednesday, July 3, 2019)
RUT ALL TIME INTRADAY HIGH = 1742 (reached on Friday, August 31, 2018)
Current DAILY +2 Sigma SPX = 2999 with WEEKLY +2 Sigma = 2985
Current DAILY 0 Sigma SPX = 2925 with WEEKLY 0 Sigma = 2857
Current DAILY -2 Sigma SPX = 2852 with WEEKLY -2 Sigma = 2729
NYSE McClellan Oscillator = +97 (-150 is start of the O/S area; around -275 to -300 area or lower, we go into the �launch-pad� mode; over +150, we are in O/B area)
NYSE Breadth Thrust = 54.1 (40 is considered as oversold and 65 as overbought)
Nice week for the longs (holidays usually have up bias) with SPX, NDX and yes, finally DJIA made new ATHs.
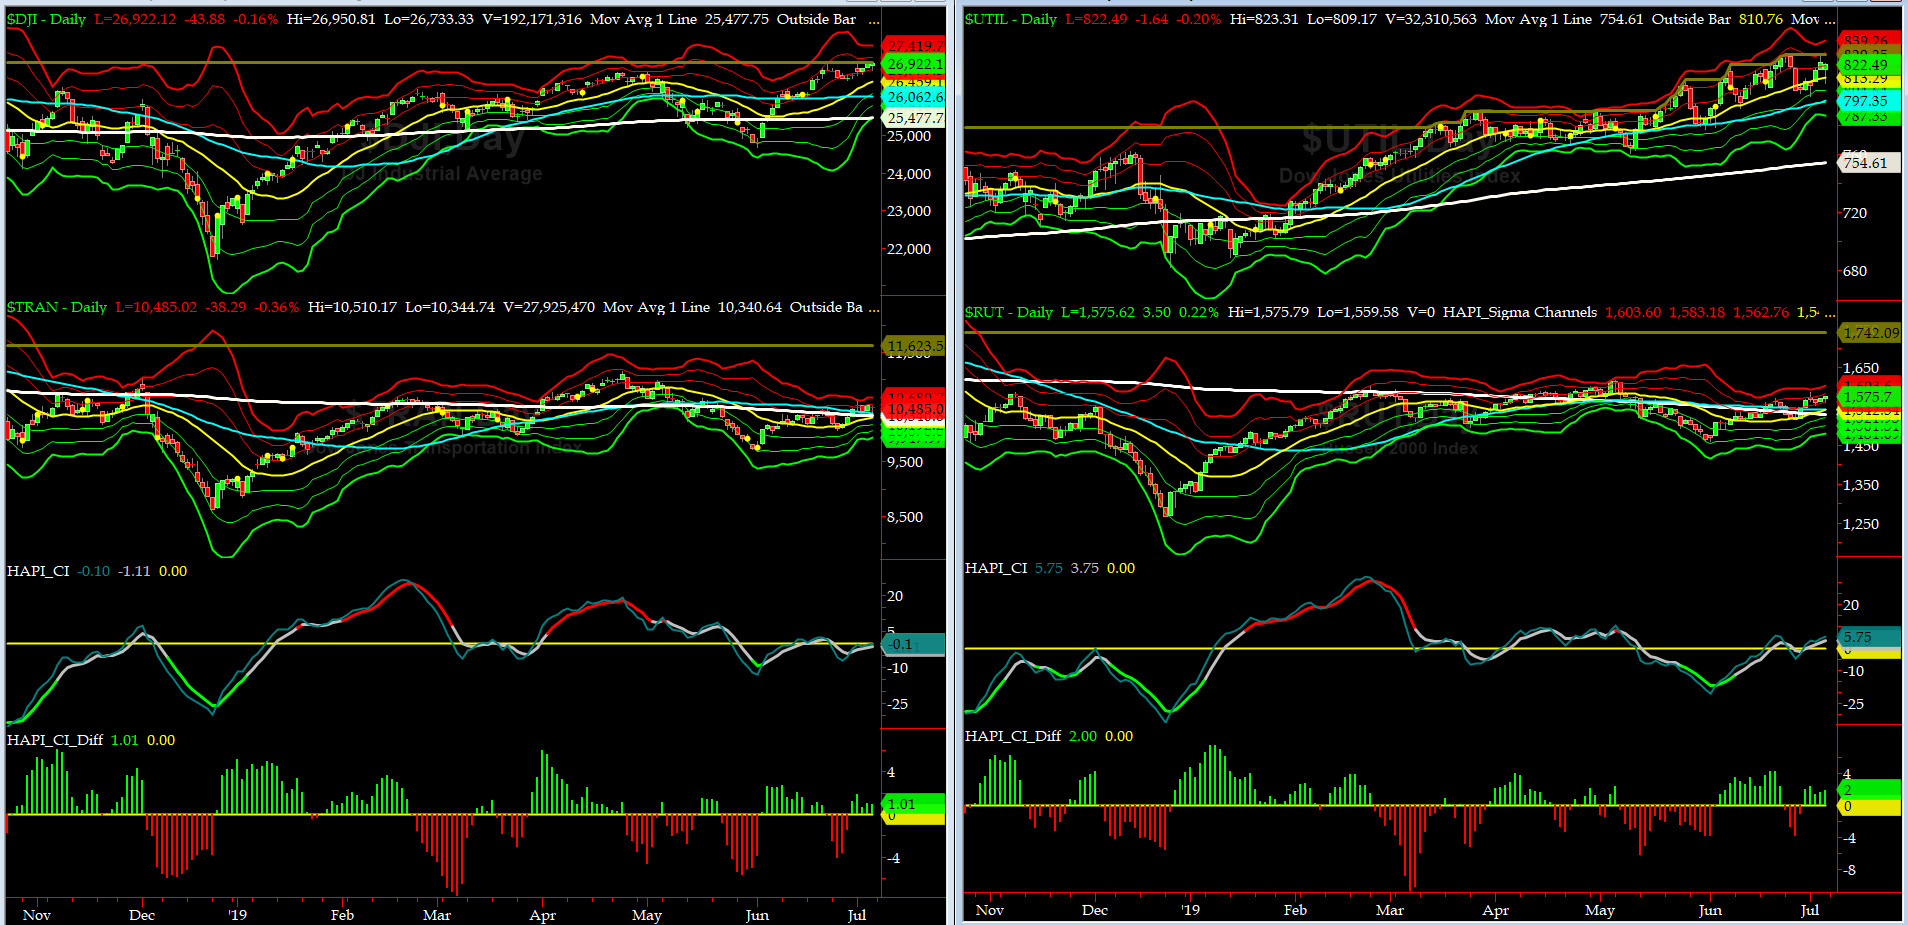
Canaries [in the Coal Mine] Chart for DJ TRAN & RUT Indices
200-Day MA DJ TRAN = 10,340 or 1.4% BELOW DJ TRAN (max observed in last 7 yrs = 20.2%, min = -20.3%)
200-Day MA RUT = 1529 or 3% BELOW RUT (max observed in last 7 yrs = 21.3%, min = -22.6%)
DJ Transportation Index (proxy for economic conditions 6 to 9 months hence) had a rough week, breaking out on Monday and then giving it all back by Friday's close.
Russell 2000 Small Caps Index (proxy for Risk ON/OFF) faired a tad better and RISK ON may show up shortly.....
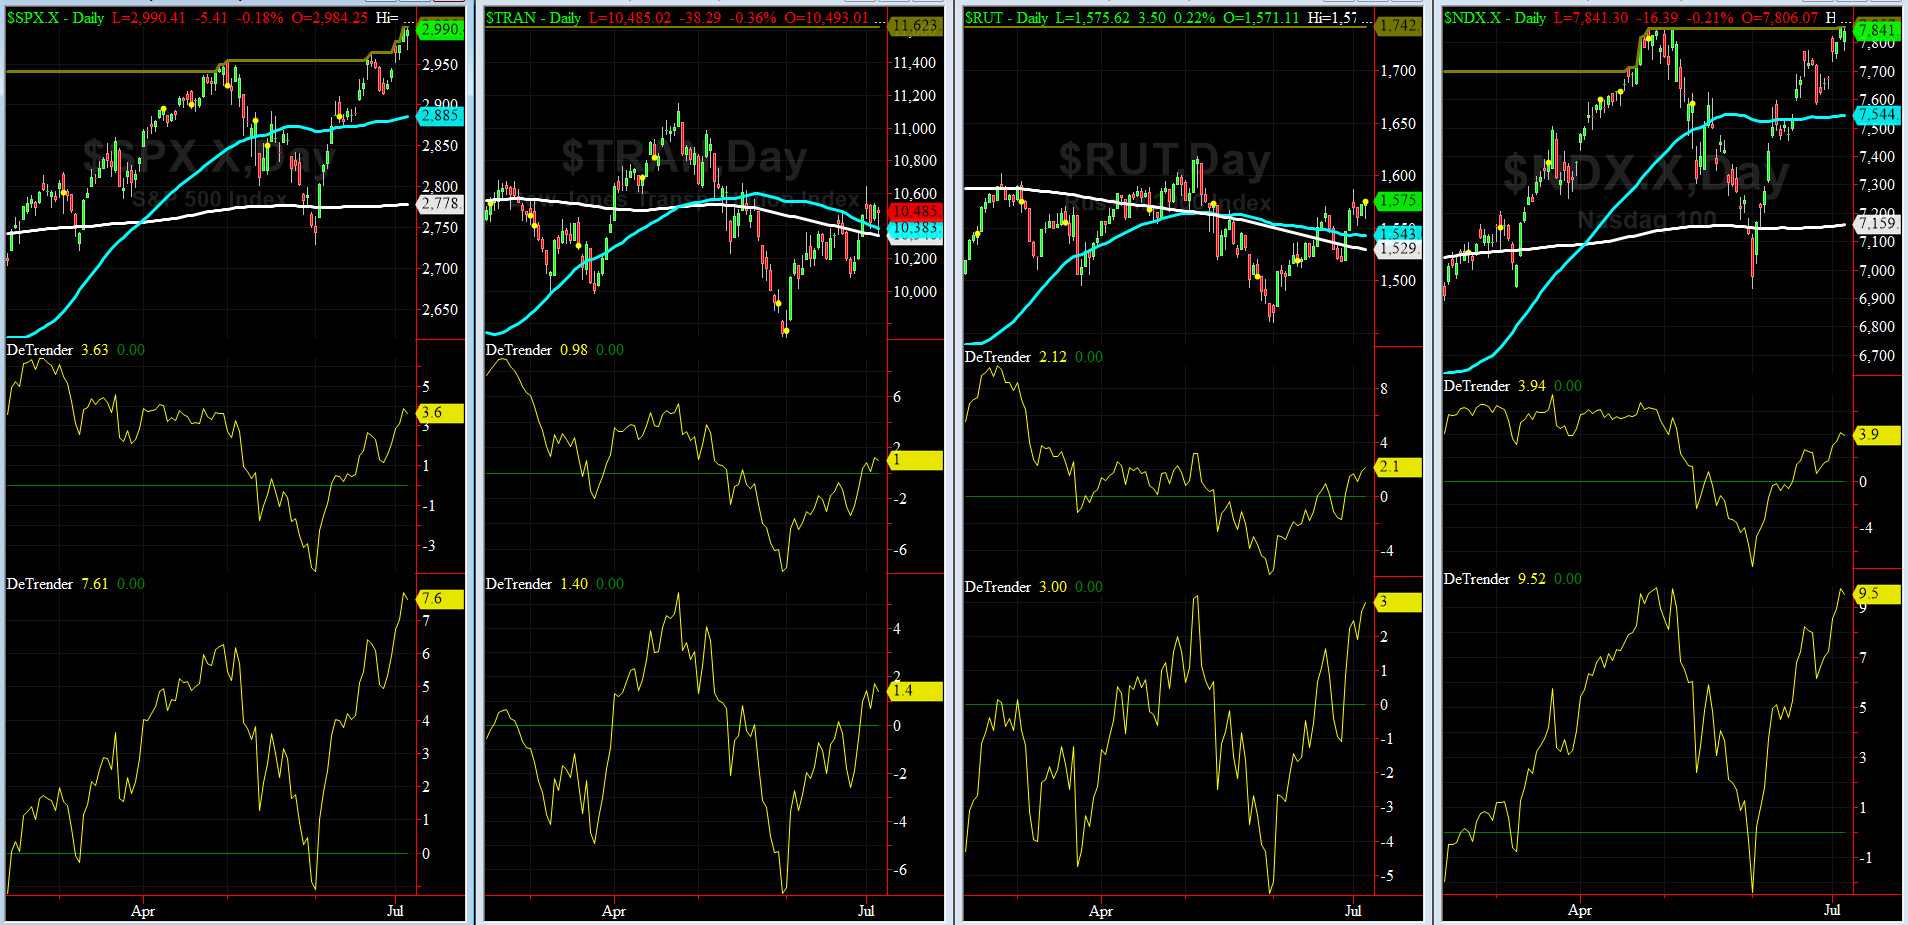
DeTrenders Charts for SPX, NDX, TRAN & RUT Indices
50-Day MA SPX = 2885 or 3.6% BELOW SPX (max observed in last 7 yrs = +8.6%, min = -9.3%)
200-Day MA SPX = 2778 or 7.6% BELOW SPX (max observed in last 7 yrs = 15.2%, min = -14%)
ALL of our EIGHT DeTrenders are in the POSITIVE territory. The DeTrenders for DJ Tran & RUT will continue to be harbingers of future price behavior in broad indices.

HA_SP1_Momo Chart
WEEKLY Timing Model = on a BUY Signal since Friday, March 8, 2019 CLOSE at 2743
DAILY Timing Model = on a BUY Signal since Tuesday, July 2, 2019 CLOSE at 2873
Max SPX 52wk-highs reading last week = 82 (over 120-140, the local maxima is in)
Max SPX 52wk-Lows reading last week = 2 (over 40-60, the local minima is in)
HA_SP1 closed near its +2 sigma channels
HA_Momo = +3.7 (reversals most likely occur above +10 or below -10)
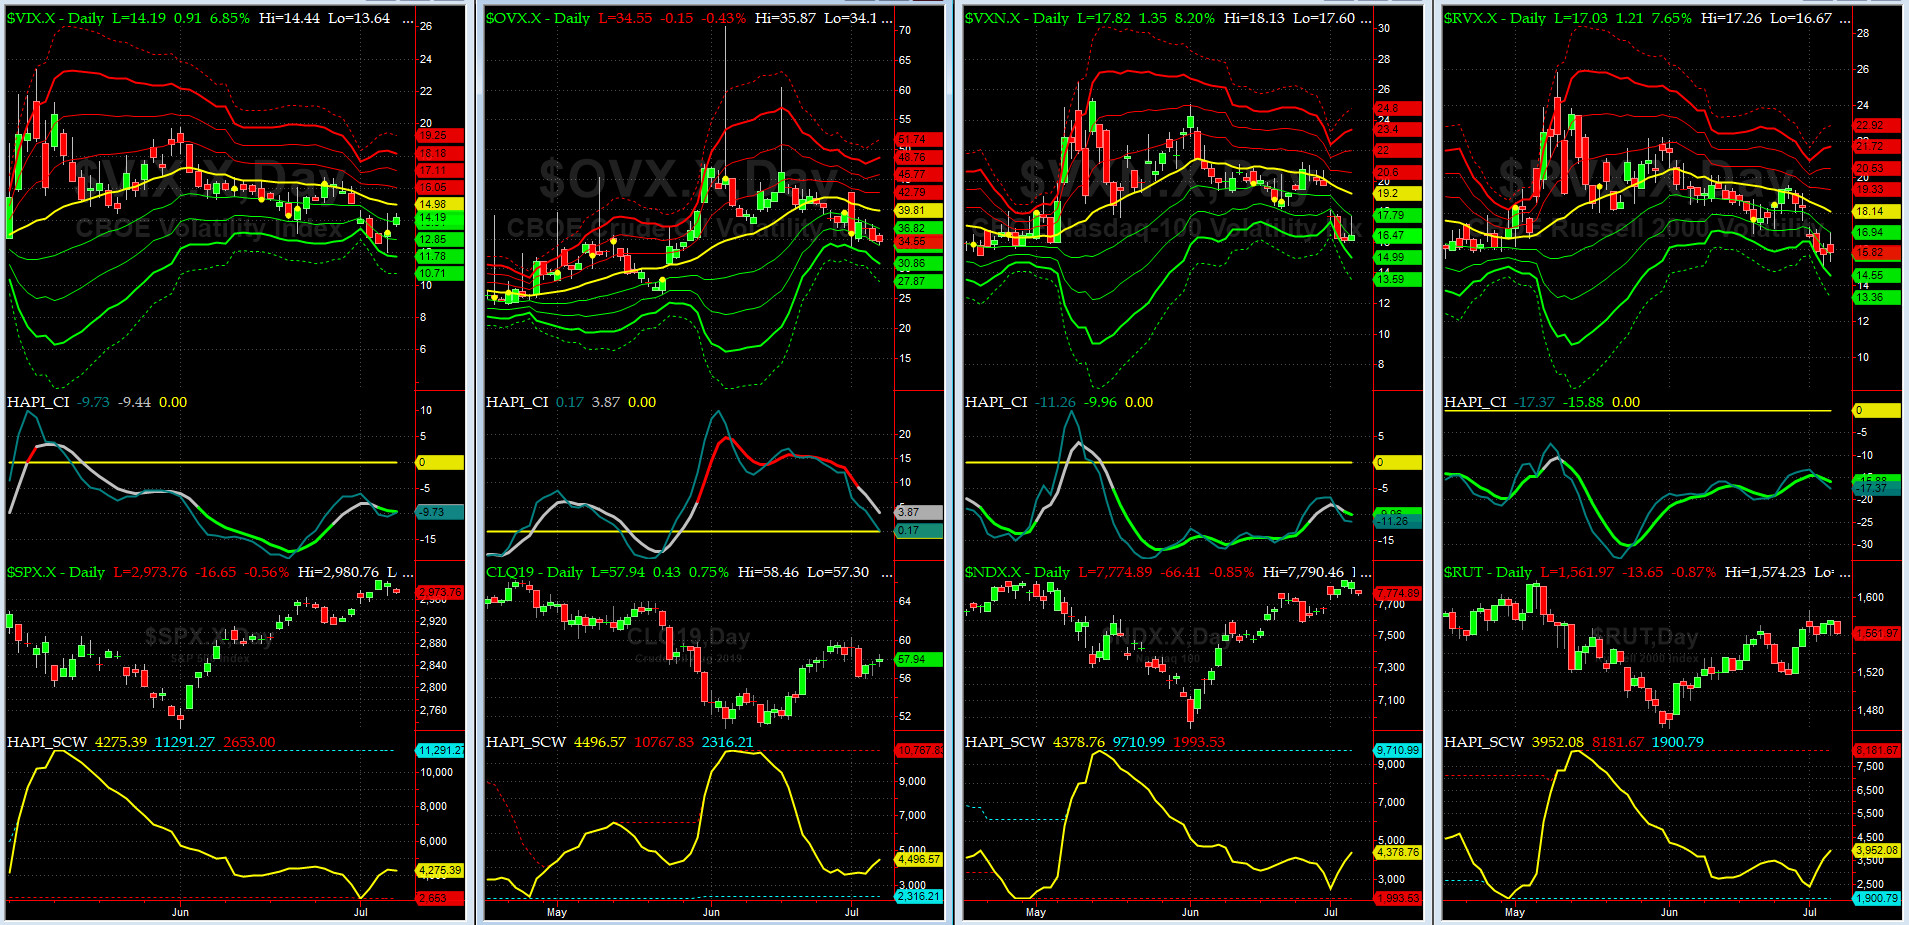
Vol of the Vols Chart
Spot VIX stood at 13.99 Friday night, at about its -1 sigma (remember it's the VIX volatility pattern aka "its sigma channels" that matters, and not the level of VIX itself (this is per Dr. Robert Whaley, a great mentor and inventor of original VIX, now called VXO). VIX usually peaks around a test of its +4 sigma).
Vols dropped dramatically (all the way down to -3 sigma) last Monday and Tuesday. Summer trading days are here again.
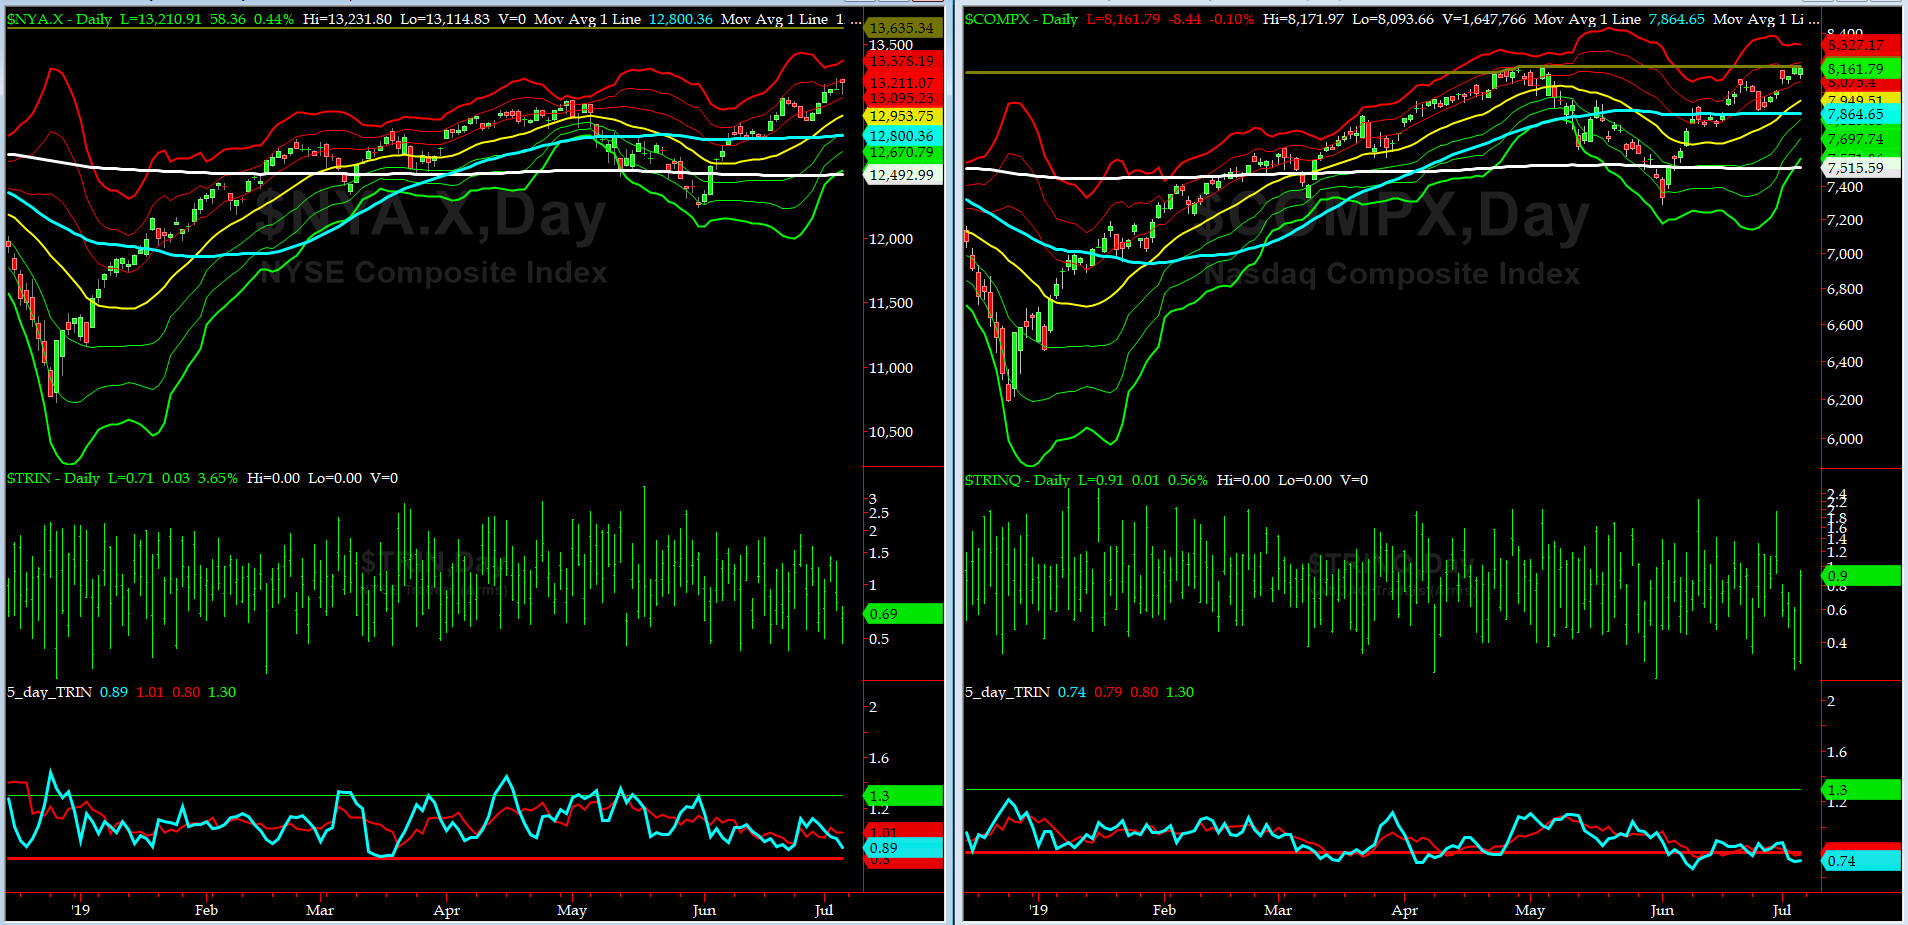
5-day TRIN & TRINQ Charts
Both NYSE & NASDAQ 5-day TRINs at or heading to the SELL zone.
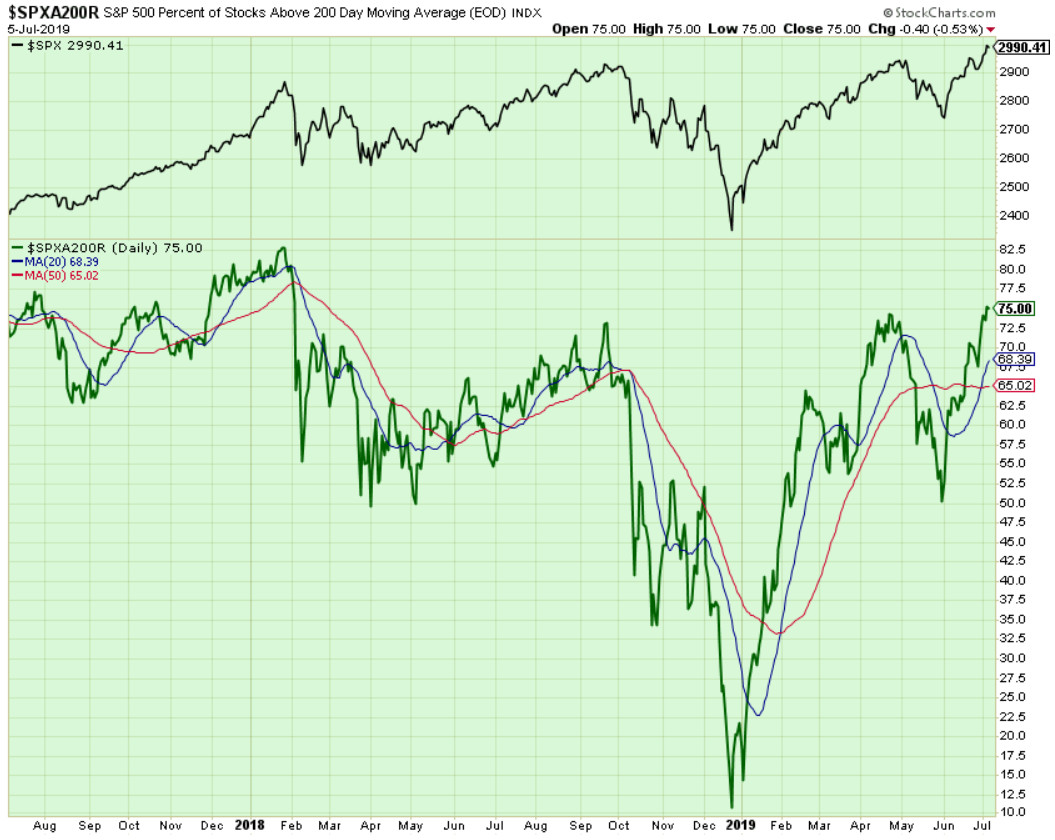
Components of SPX above their respective 200-day MA Chart
This scoring indicator went to our target of 75%. If we do not pull back, next target is 80%.
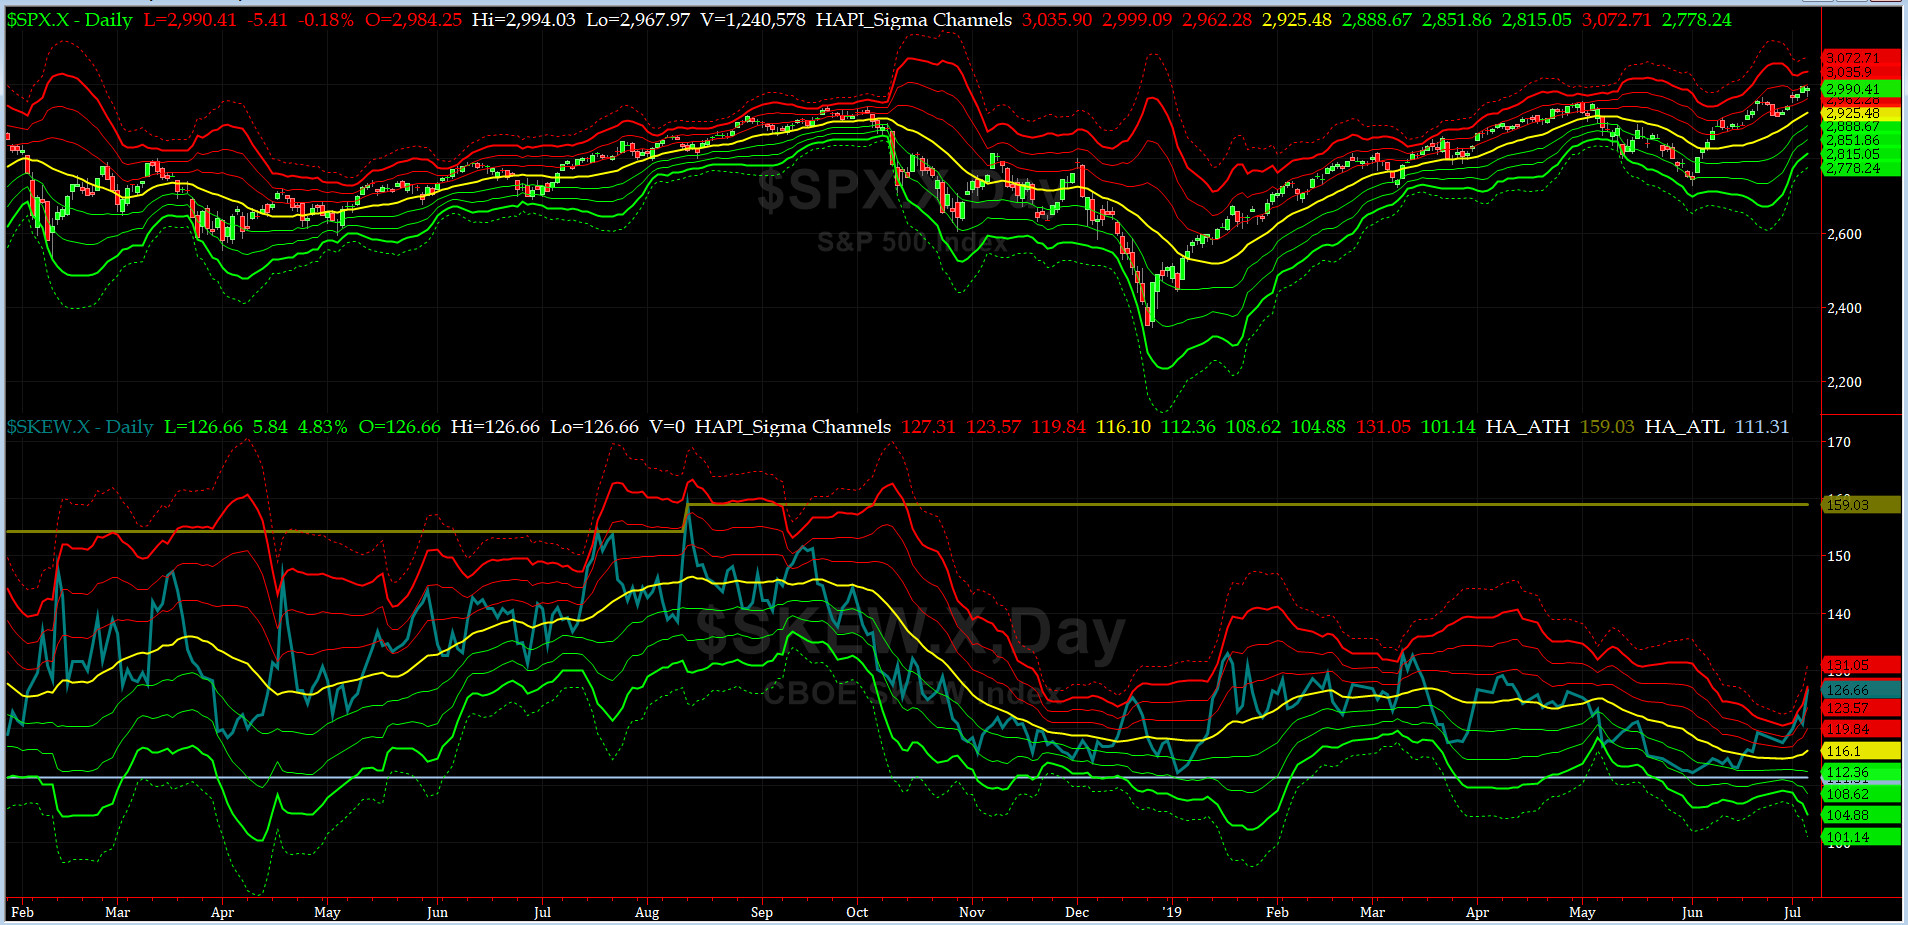
SPX SKEW (Tail Risk) Chart
On Friday, SPX SKEW (Tail Risk) rose pretty sharply to 126.7, now about its +3 sigma (normal = 115, range 100-150).
All quiet on the Eastern & Mid-Western Fronts? well, our beloved HRH Capt. Tiko, KCPE, smells some rock 'n roll ahead.
How to interpret the value of SPX SKEW? (from CBOE white paper on SKEW)


3-month VIX Futures Spread(VX) Chart
This popular timing indicator for identifying tradable bottoms, (now long JUL19, & short OCT19 VIX Futures) hit -2.02 on Friday Close. No signal here.
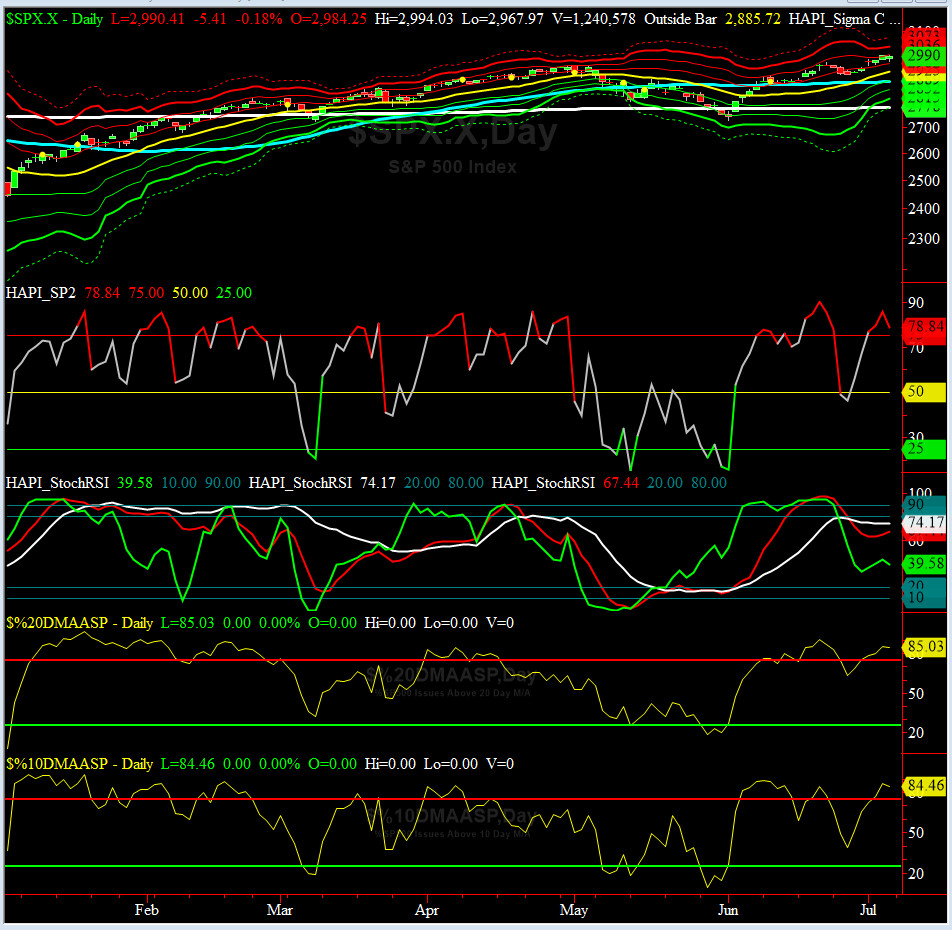
HA_SP2 Chart
HA_SP2 = 78.8 (Buy signal <= 25, Sell Signal >= 75)
Are we still in a topping formation? we think so + make sure you have plenty of iced tea on hand, per HRH @Capt_Tiko.
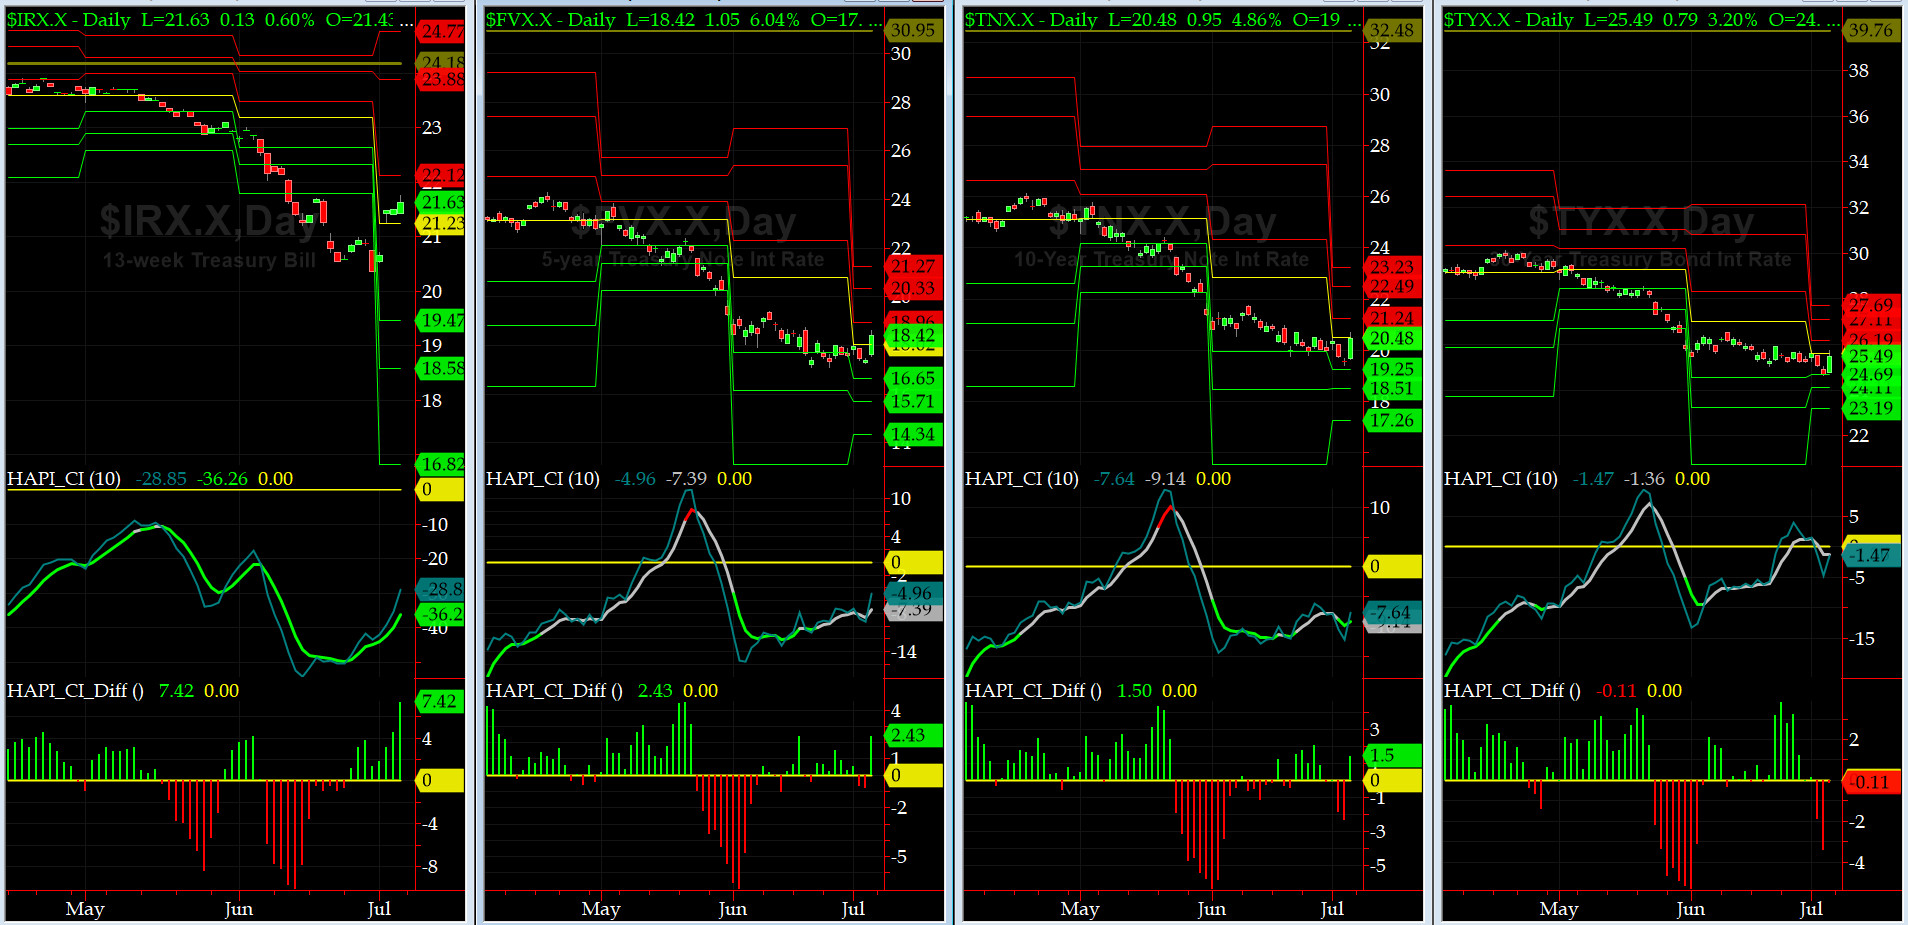
US Treasury T-Notes & T-Bonds Yields Chart
For the first time in many moons, the whole YTM Curve shifted up and yes at least Maury is smiling while Grumpino wants to jawbone Fed Chair Powell.
Fari Hamzei
|
|
|
|
|
|
Customer Care:
|
|
|
|
|
|
|
 |
 |
|
 |
|
 |
 |
 |
HA YouTube Channel ::: HA Blog ::: Testimonials ::: Tutorials & FAQs ::: Privacy Policy
|
Trading Derivatives (Options & Futures) contains substantial risk and is not for every investor. An investor could potentially lose all or more than his/her initial investment.
Only risk capital should be used for trading and only those with sufficient risk capital should consider trading derivatives. Past performance is not
necessarily indicative of future results. Testimonials appearing on this website may not be representative of other clients or customers
and are not a guarantee of future performance or success.
|
| (c) 1998-2025, Hamzei Analytics, LLC.® All Rights Reserved. |
|
|