|
Monday, August 5, 2019, 2230ET
Market Timing Charts, Analysis & Commentary for Issue #301
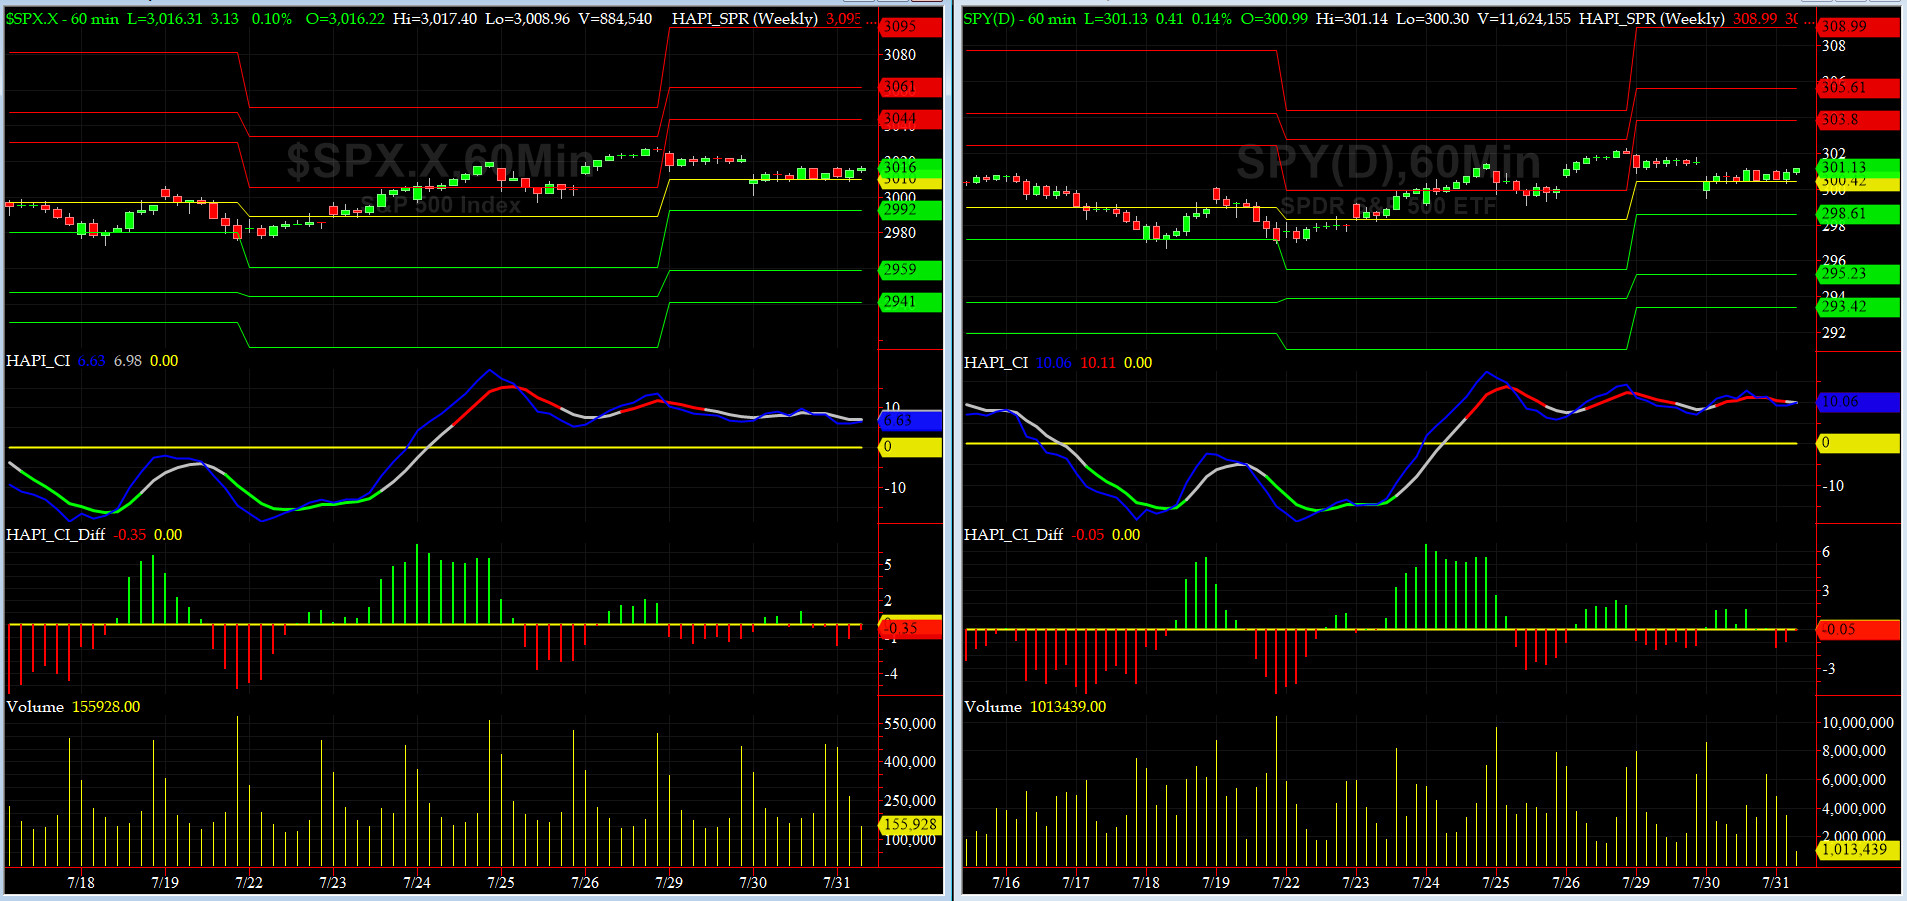
Timer Charts of S&P-500 Cash Index (SPX) + NASDAQ-100 Cash Index (NDX)
Most recent S&P-500 Cash Index (SPX) Close: 2845 down -168 (down -5.6%) for the six days ending on Monday, August 5, 2019, which closed near its -4 sigma.
DJIA ALL TIME INTRADAY HIGH = 27398 (reached on Tuesday, July 16, 2019)
DJT ALL TIME INTRADAY HIGH = 11623 (reached on Friday, September 14, 2018)
SPX ALL TIME INTRADAY HIGH = 3028 (reached on Friday, July 26, 2019)
NDX ALL TIME INTRADAY HIGH = 8027 (reached on Friday, July 26, 2019)
RUT ALL TIME INTRADAY HIGH = 1742 (reached on Friday, August 31, 2018)
Current DAILY +2 Sigma SPX = 3067 with WEEKLY +2 Sigma = 3042
Current DAILY 0 Sigma SPX = 2987 with WEEKLY 0 Sigma = 2909
Current DAILY -2 Sigma SPX = 2908 with WEEKLY -2 Sigma = 2776
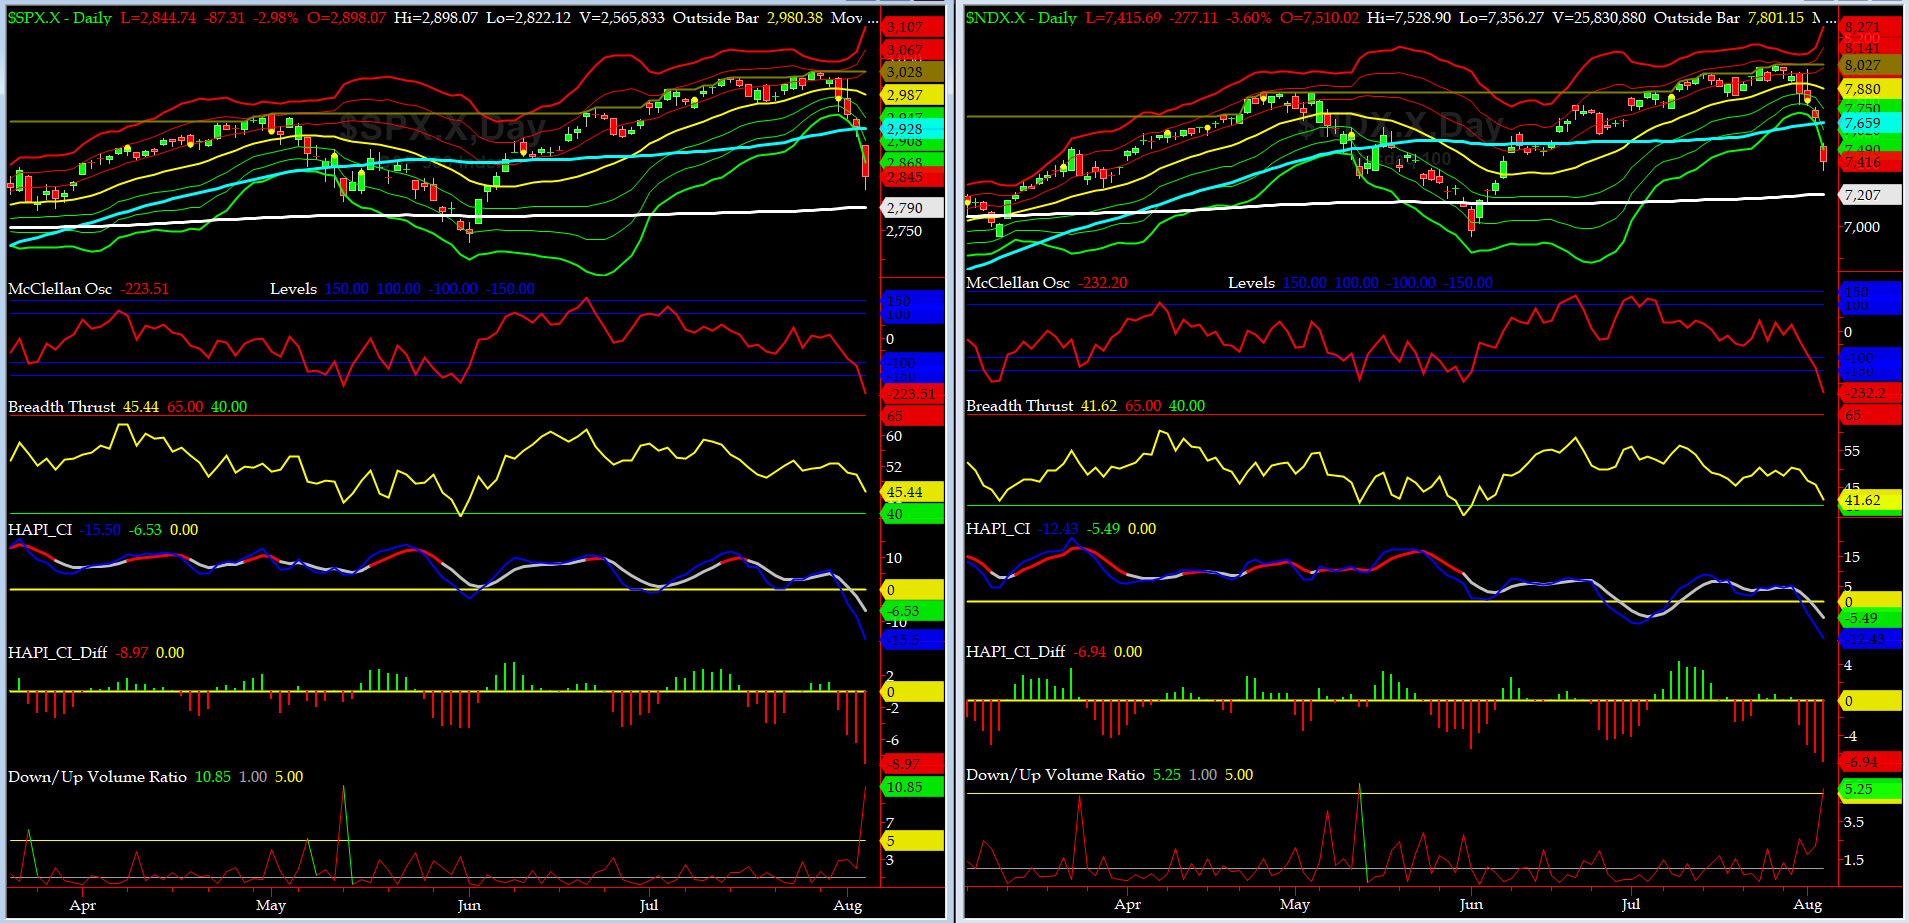
NYSE McClellan Oscillator = -223 (-150 is start of the O/S area; around -275 to -300 area or lower, we go into the �launch-pad� mode; over +150, we are in O/B area)
NYSE Breadth Thrust = 45.4 (40 is considered as oversold and 65 as overbought)
Well, Grumpino had to mess it up, otherwise..... not sure where he learned Econ 101 but he has put us on a wild ride.
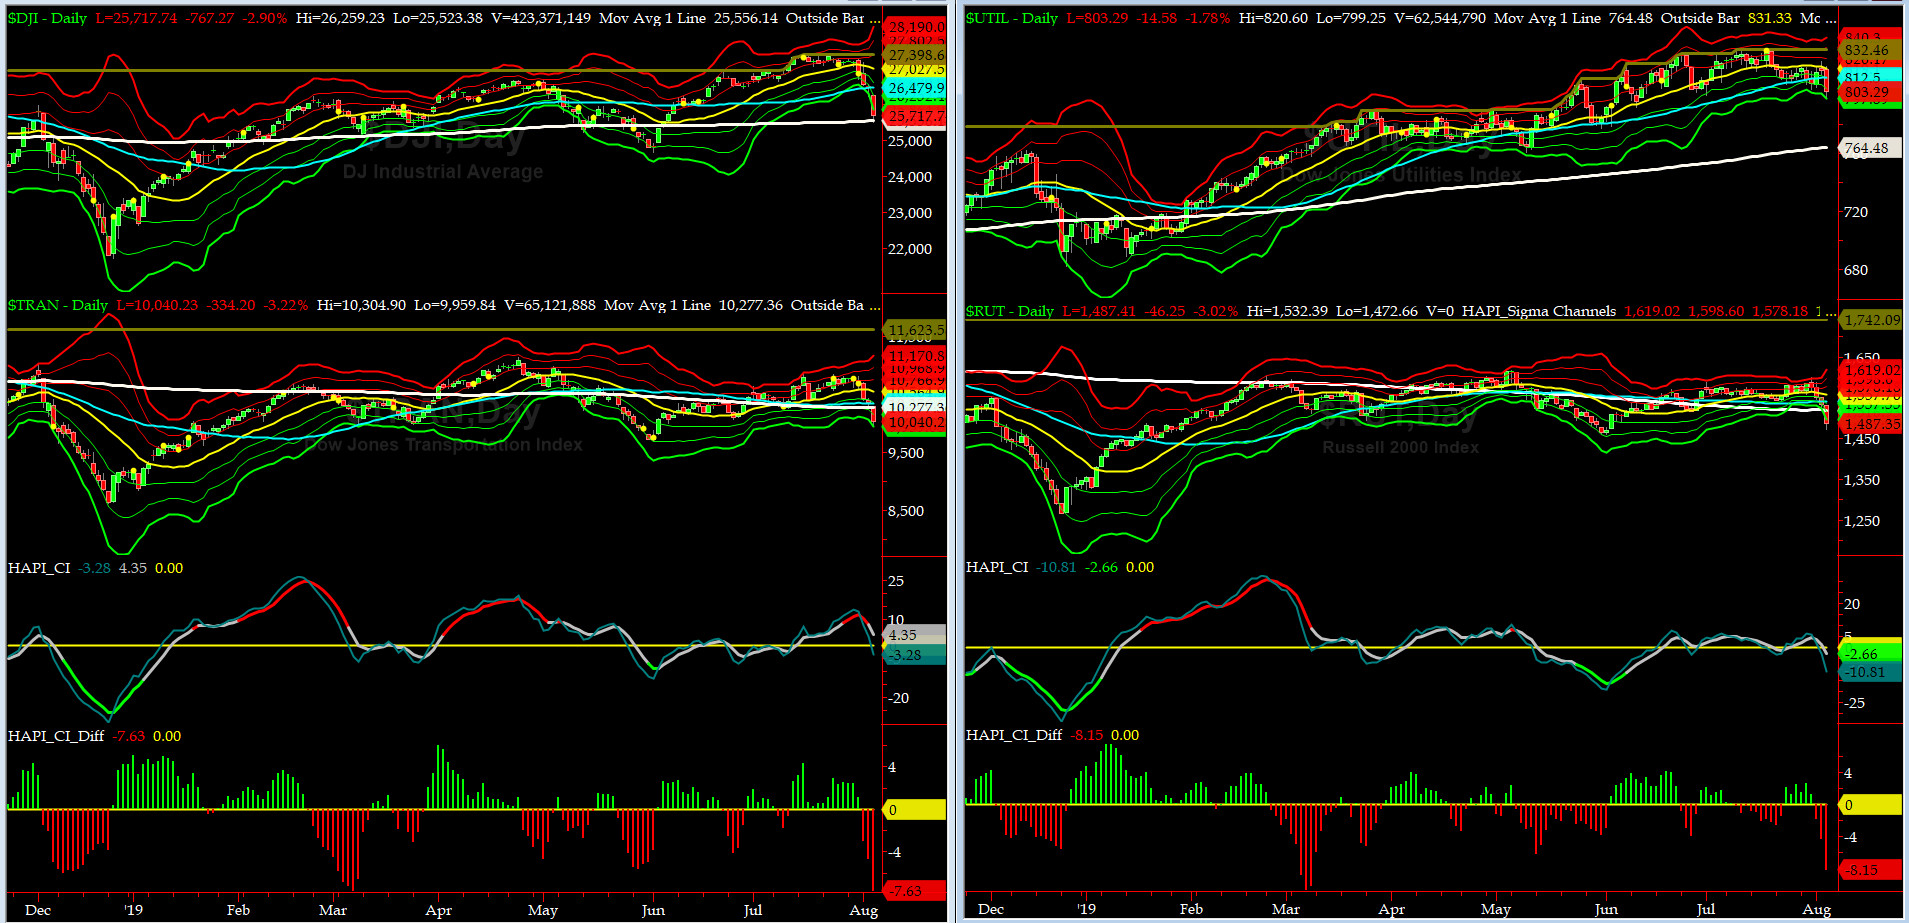
Canaries [in the Coal Mine] Chart for DJ TRAN & RUT Indices
200-Day MA DJ TRAN = 10,277 or 2.3% ABOVE DJ TRAN (max observed in last 7 yrs = 20.2%, min = -20.3%)
200-Day MA RUT = 1519 or 2.1% BELOW RUT (max observed in last 7 yrs = 21.3%, min = -22.6%)
DJ Transportation Index (proxy for economic conditions 6 to 9 months hence) has had a very rough four sessions since FOMC. Of interest to us, is where we see a death cross in DJ TRAN.
Russell 2000 Small Caps Index (proxy for Risk ON/OFF) ditto here. RISK is OFF.
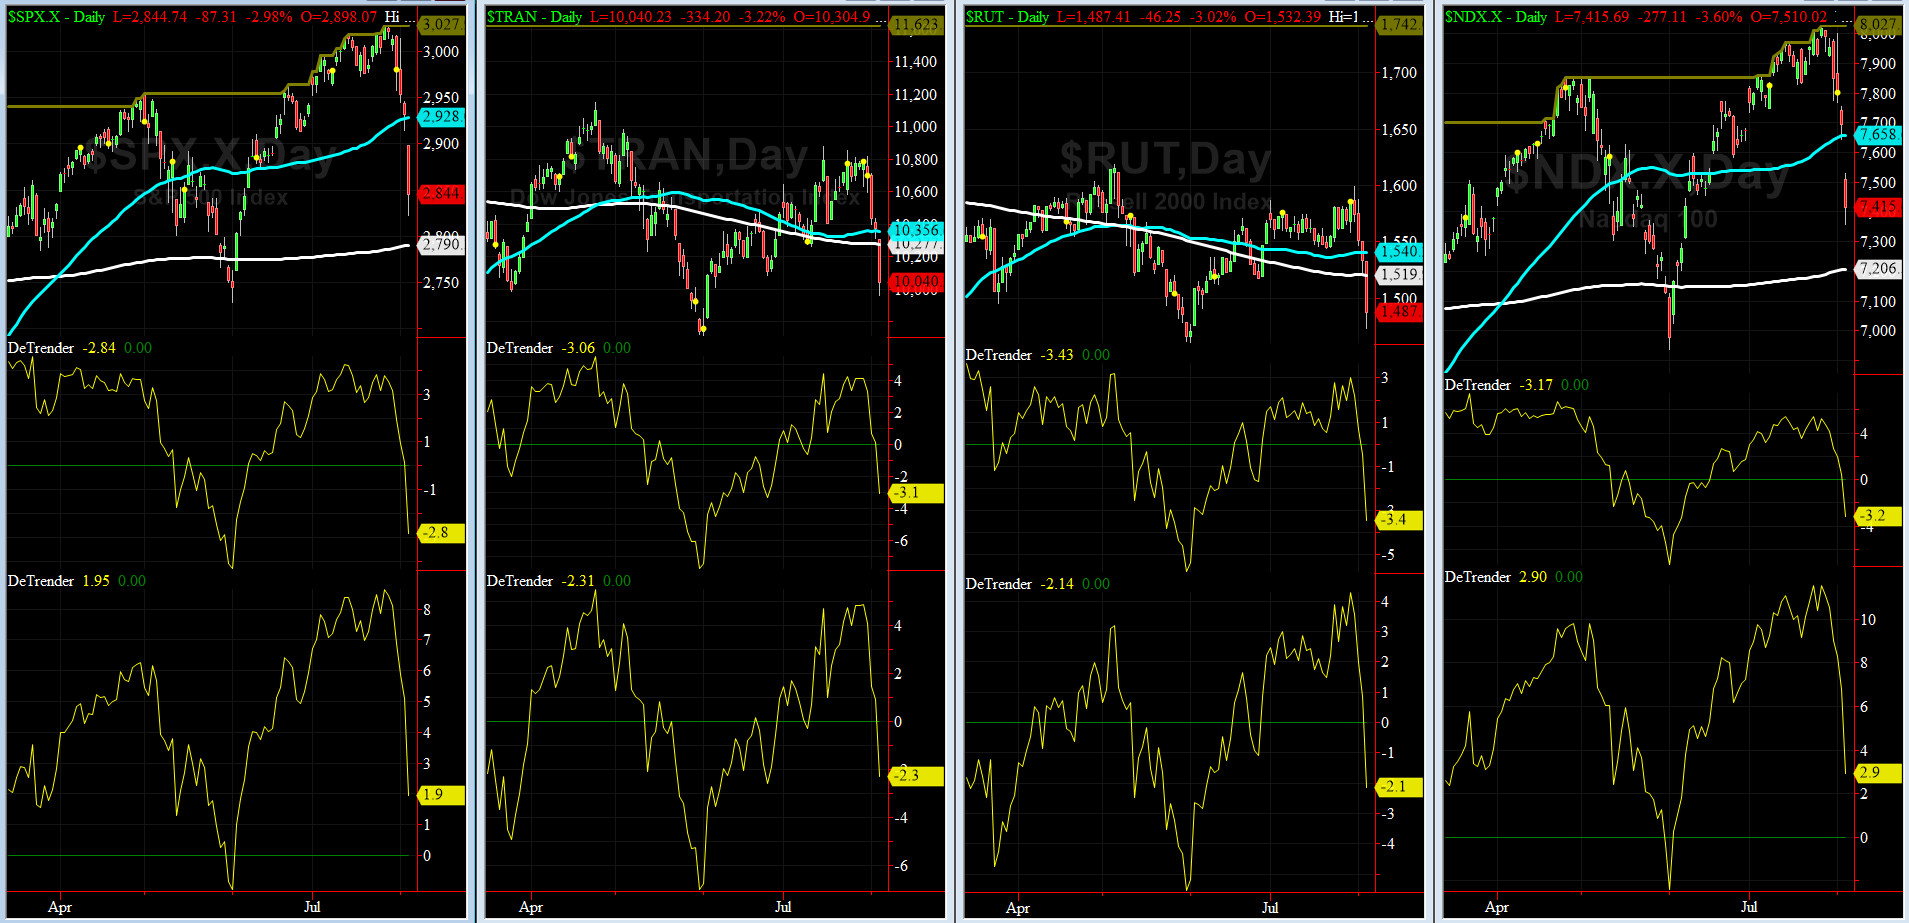
DeTrenders Charts for SPX, NDX, TRAN & RUT Indices
50-Day MA SPX = 2928 or 2.8% ABOVE SPX (max observed in last 7 yrs = +8.6%, min = -9.3%)
200-Day MA SPX = 2790 or 1.9% BELOW SPX (max observed in last 7 yrs = 15.2%, min = -14%)
SIX of our EIGHT DeTrenders are in the NEGATIVE territory. The DeTrenders for DJ Tran & RUT will continue to be harbingers of future price behavior in broad indices.
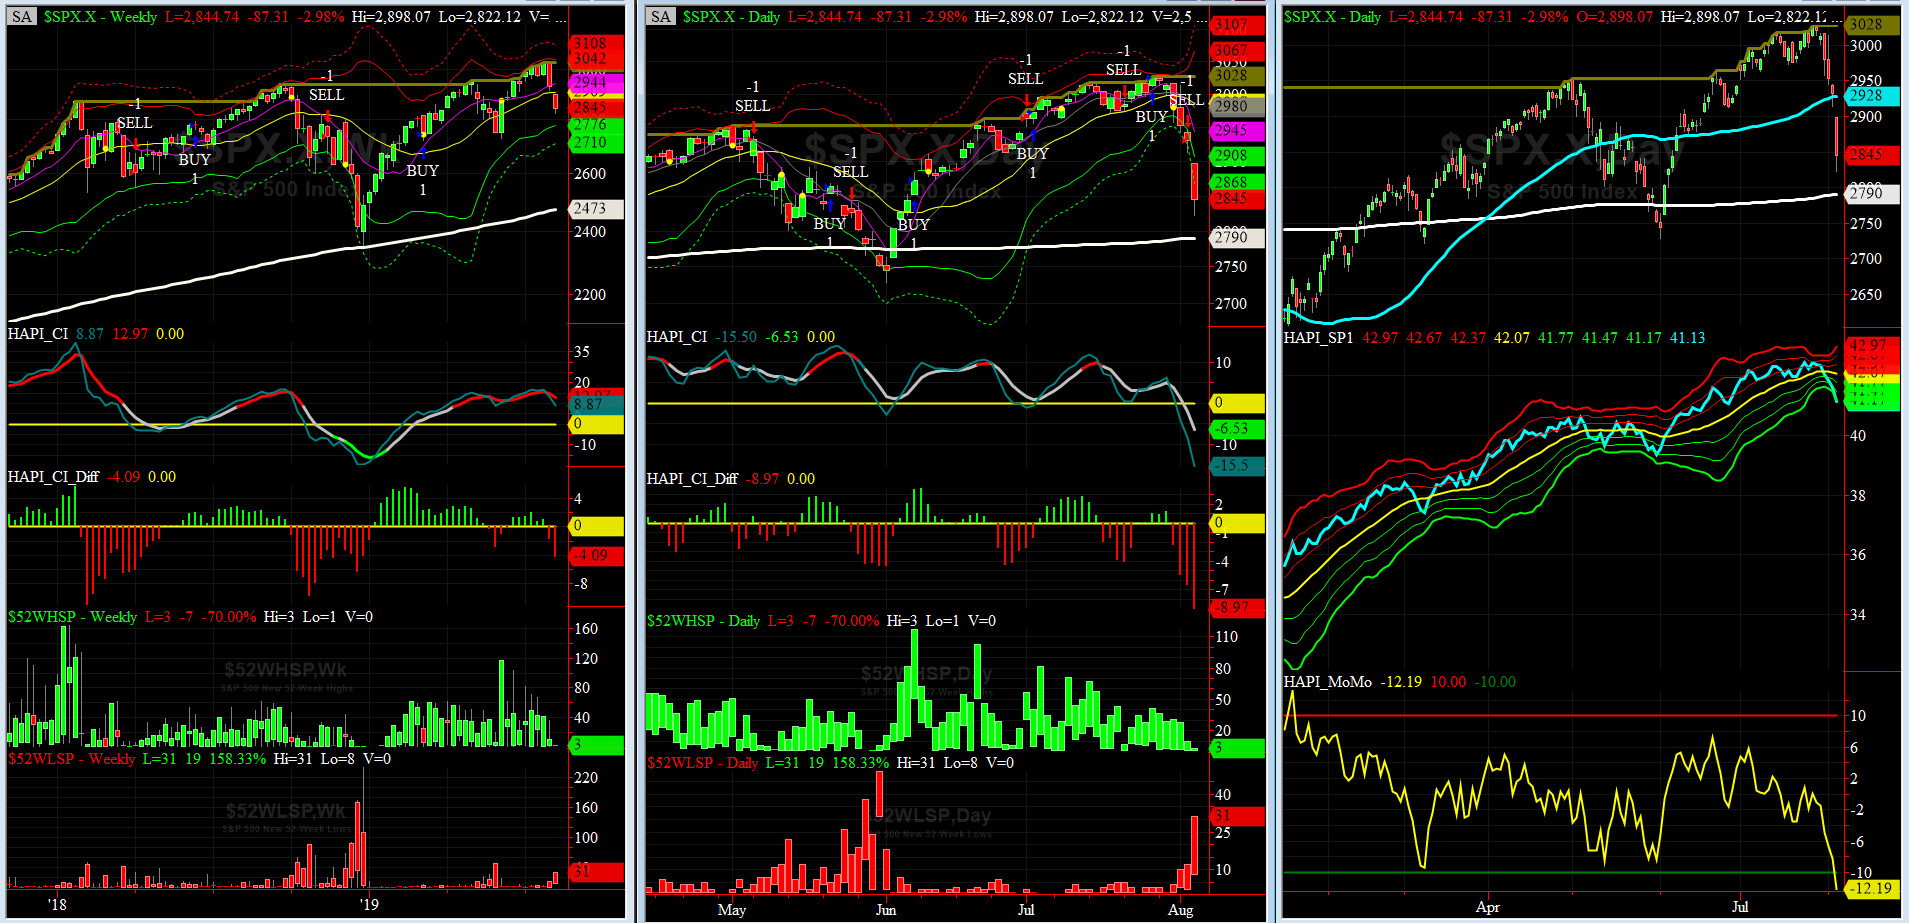
HA_SP1_Momo Chart
WEEKLY Timing Model = on a BUY Signal since Friday, March 8, 2019 CLOSE at 2743
DAILY Timing Model = on a SELL Signal since Friday, August 2, 2019 CLOSE at 2932
Max SPX 52wk-highs reading last week = 36 (over 120-140, the local maxima is in)
Max SPX 52wk-Lows reading last week = 31 (over 40-60, the local minima is in)
HA_SP1 closed near its -3 sigma channels
HA_Momo = -12 (reversals most likely occur above +10 or below -10)

Vol of the Vols Chart
Spot VIX stood at 24.6 on Monday night, at about its +4 sigma (remember it's the VIX volatility pattern aka "its sigma channels" that matters, and not the level of VIX itself (this is per Dr. Robert Whaley, a great mentor and inventor of original VIX, now called VXO). VIX usually peaks around a test of its +4 sigma).
This should be a local minima. Now we need to see a confirmation that this shockwave recedes.
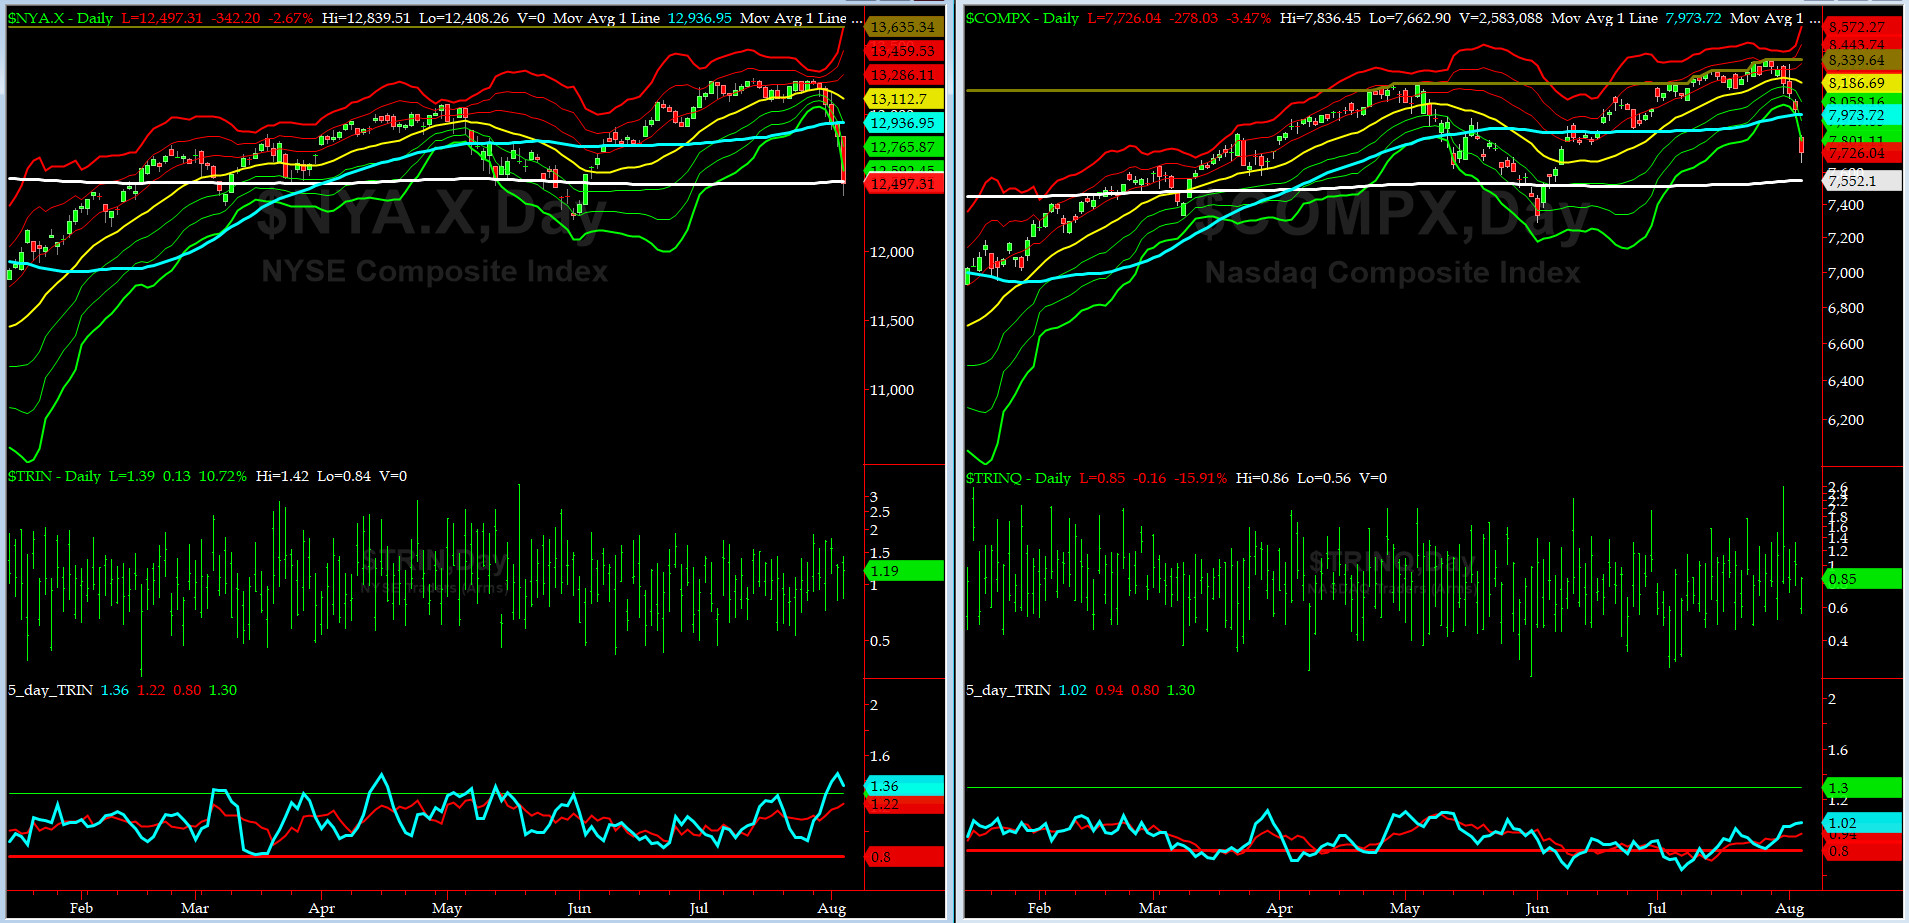
5-day TRIN & TRINQ Charts
NYSE 5-day TRIN is in a BUY zone while NASDAQ 5-day TRINQ is in NEUTRAL zone.
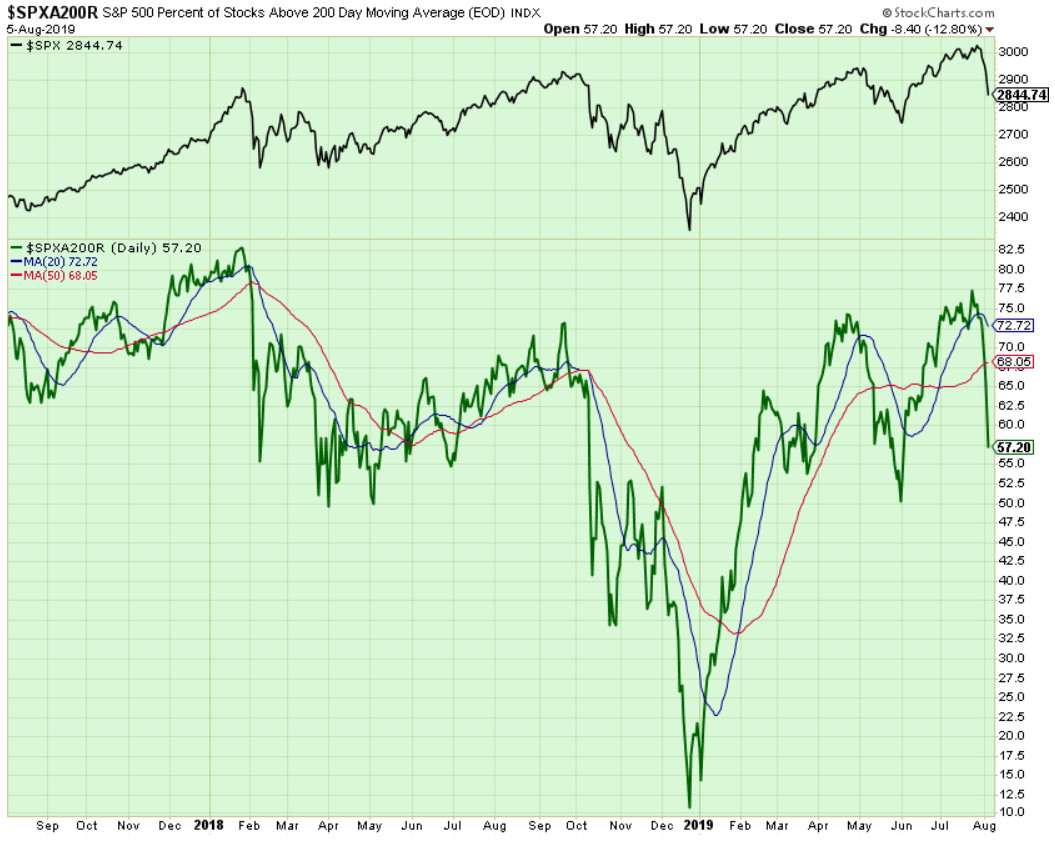
Components of SPX above their respective 200-day MA Chart
This scoring indicator got double-flushed to about 57%......very nice indeed.
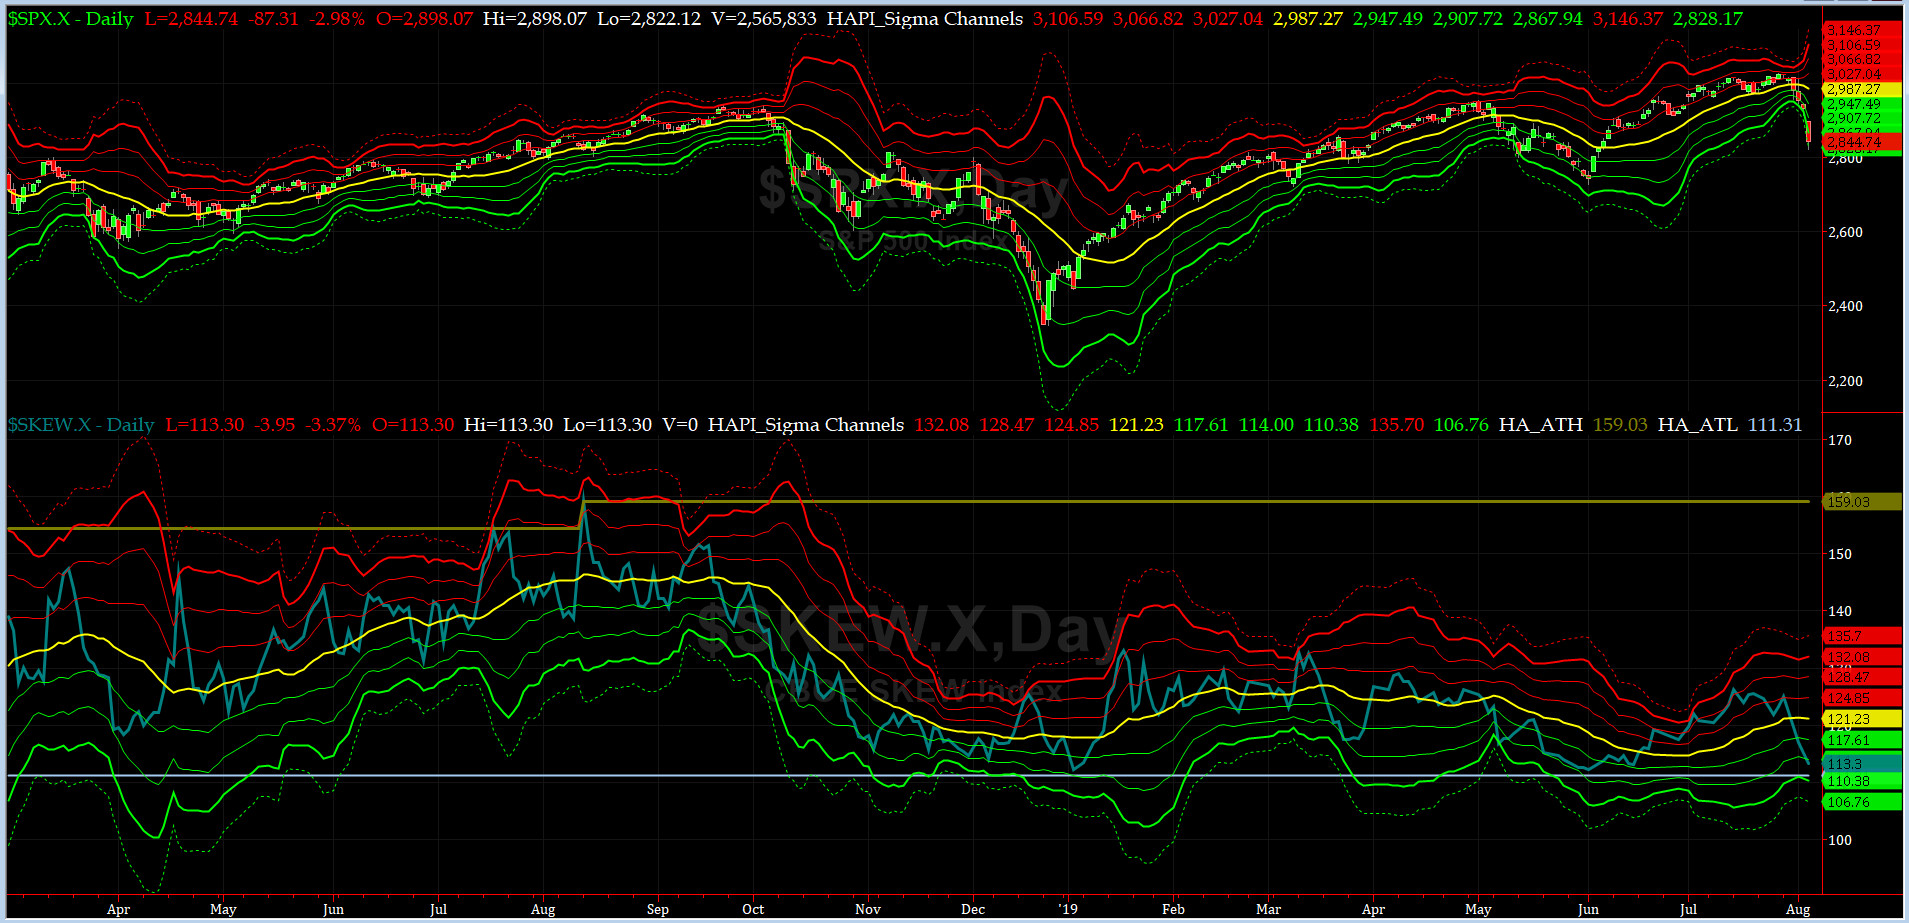
SPX SKEW (Tail Risk) Chart
On Friday, SPX SKEW (Tail Risk) rose pretty sharply to 113.3, now about its -2 sigma (normal = 115, range 100-150).
All quiet on the Eastern & Mid-Western Fronts? heck no.... as HRH Capt. Tiko, KCPE, warns us some 2-3 weeks, here comes some rock 'n roll.... ENJOY the elevated Vols
How to interpret the value of SPX SKEW? (from CBOE white paper on SKEW)

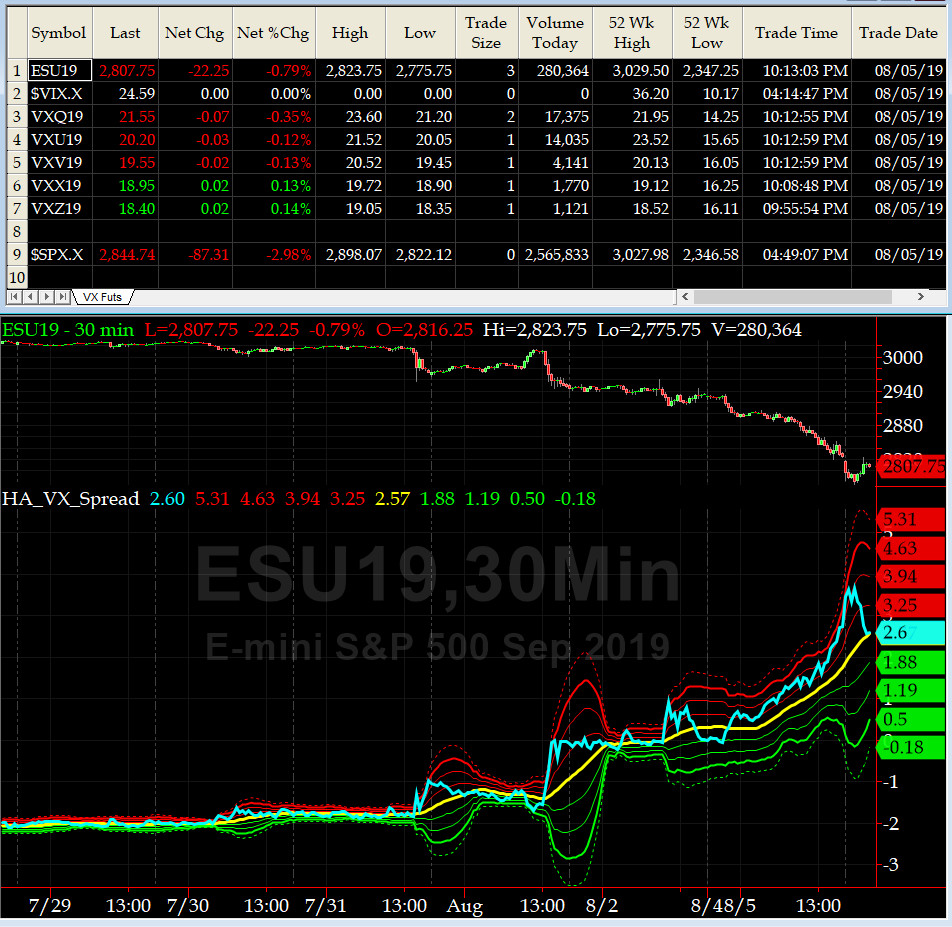
3-month VIX Futures Spread(VX) Chart
This popular timing indicator for identifying tradable bottoms, (now long AUG19, & short NOV19 VIX Futures) hit +2.73 on Monday Close. That is a BUY signal.
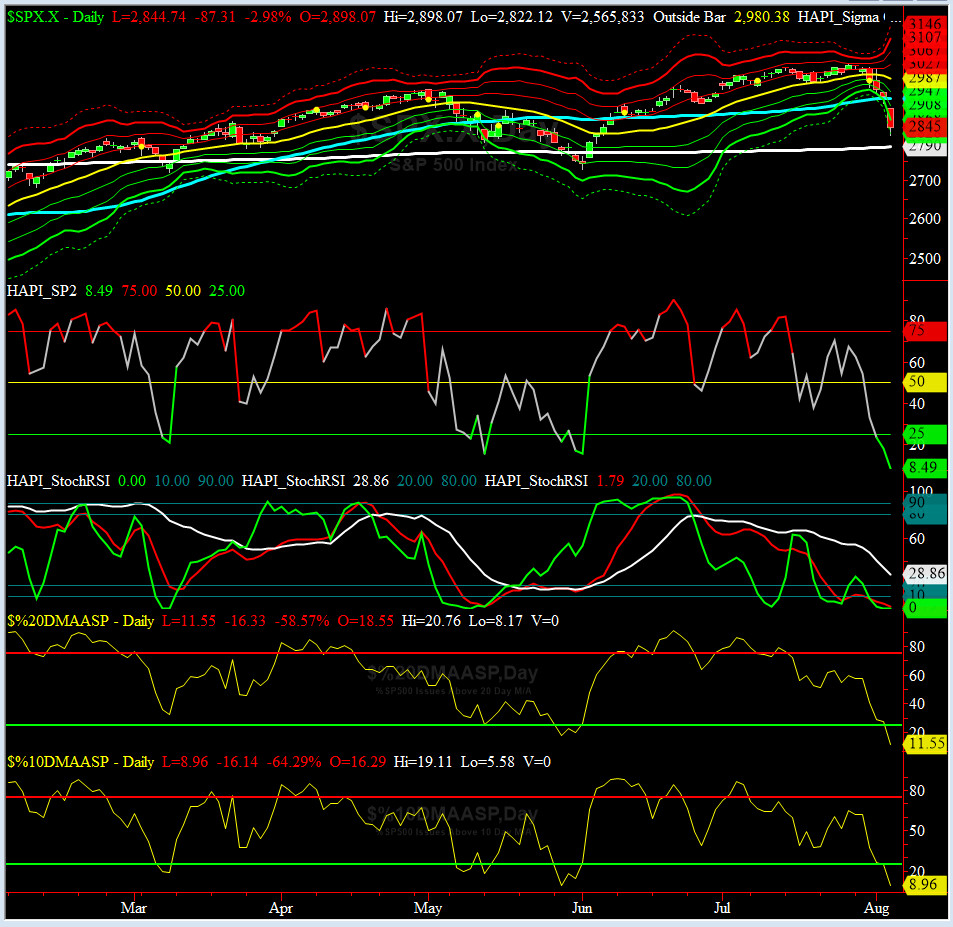
HA_SP2 Chart
HA_SP2 = 8.5 (Buy signal <= 25, Sell Signal >= 75)
Close your eyes, cover your nose and BUY BUY BUY. sailor, that's an order from our XO, HRH @Capt_Tiko, KCPE.
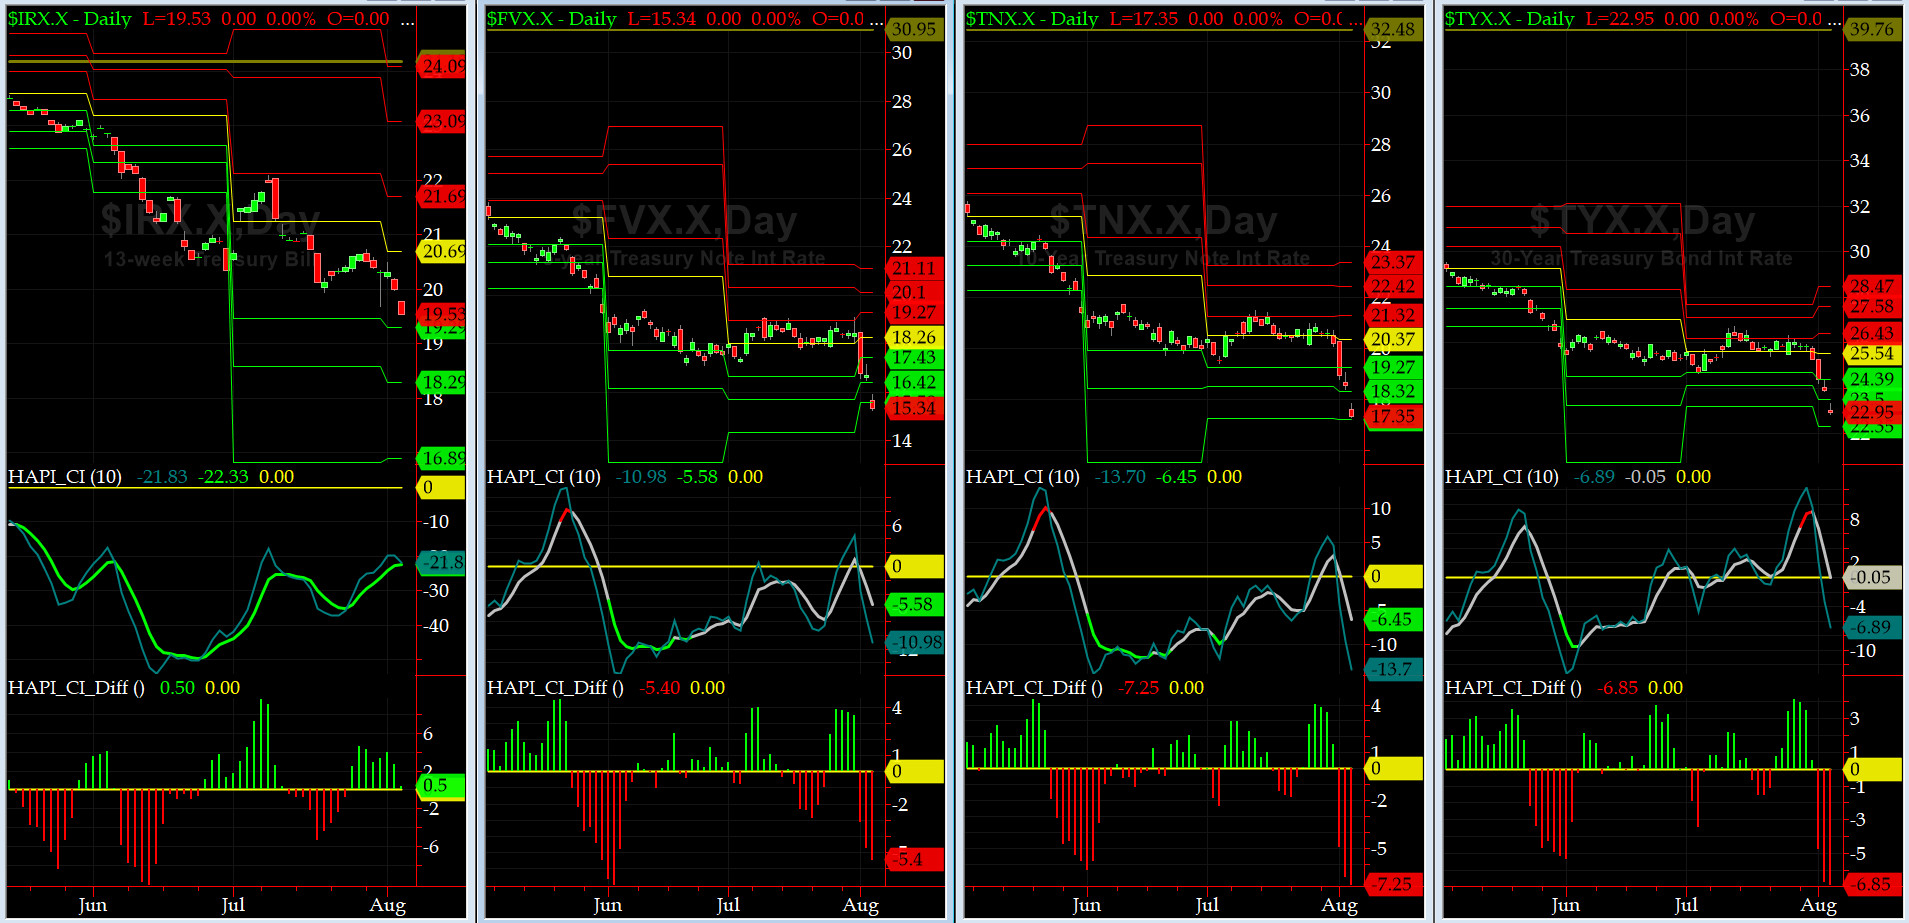
US Treasury T-Notes & T-Bonds Yields Chart
Well, here we go.....this week, our YTMs got a courtesy-flush (in Seinfeld lingo) and our beloved Maury finally got kicked out of his own house (no mortgage) in BH Flats. So now, he has to rough it at the pool side of BH Waldorf-Astoria.
Fari Hamzei
|


 Proactive Market Timing