|
Sunday, August 11, 2019, 2245ET
Market Timing Charts, Analysis & Commentary for Issue #302
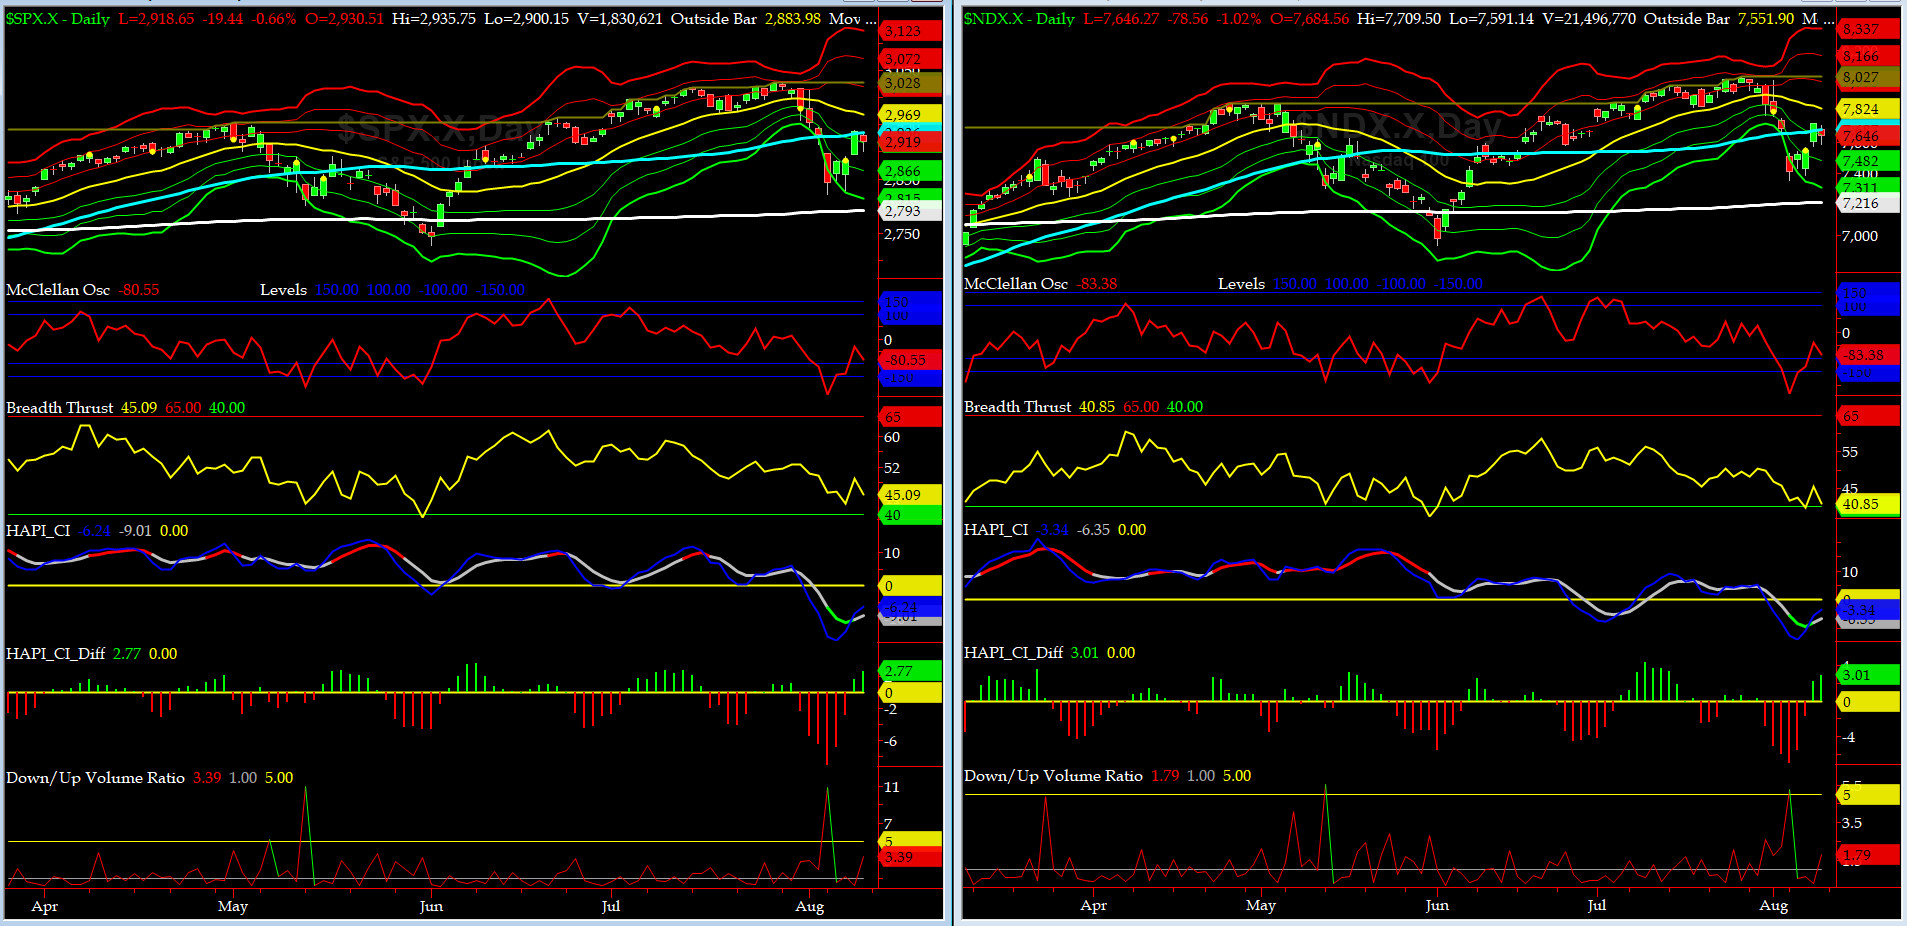
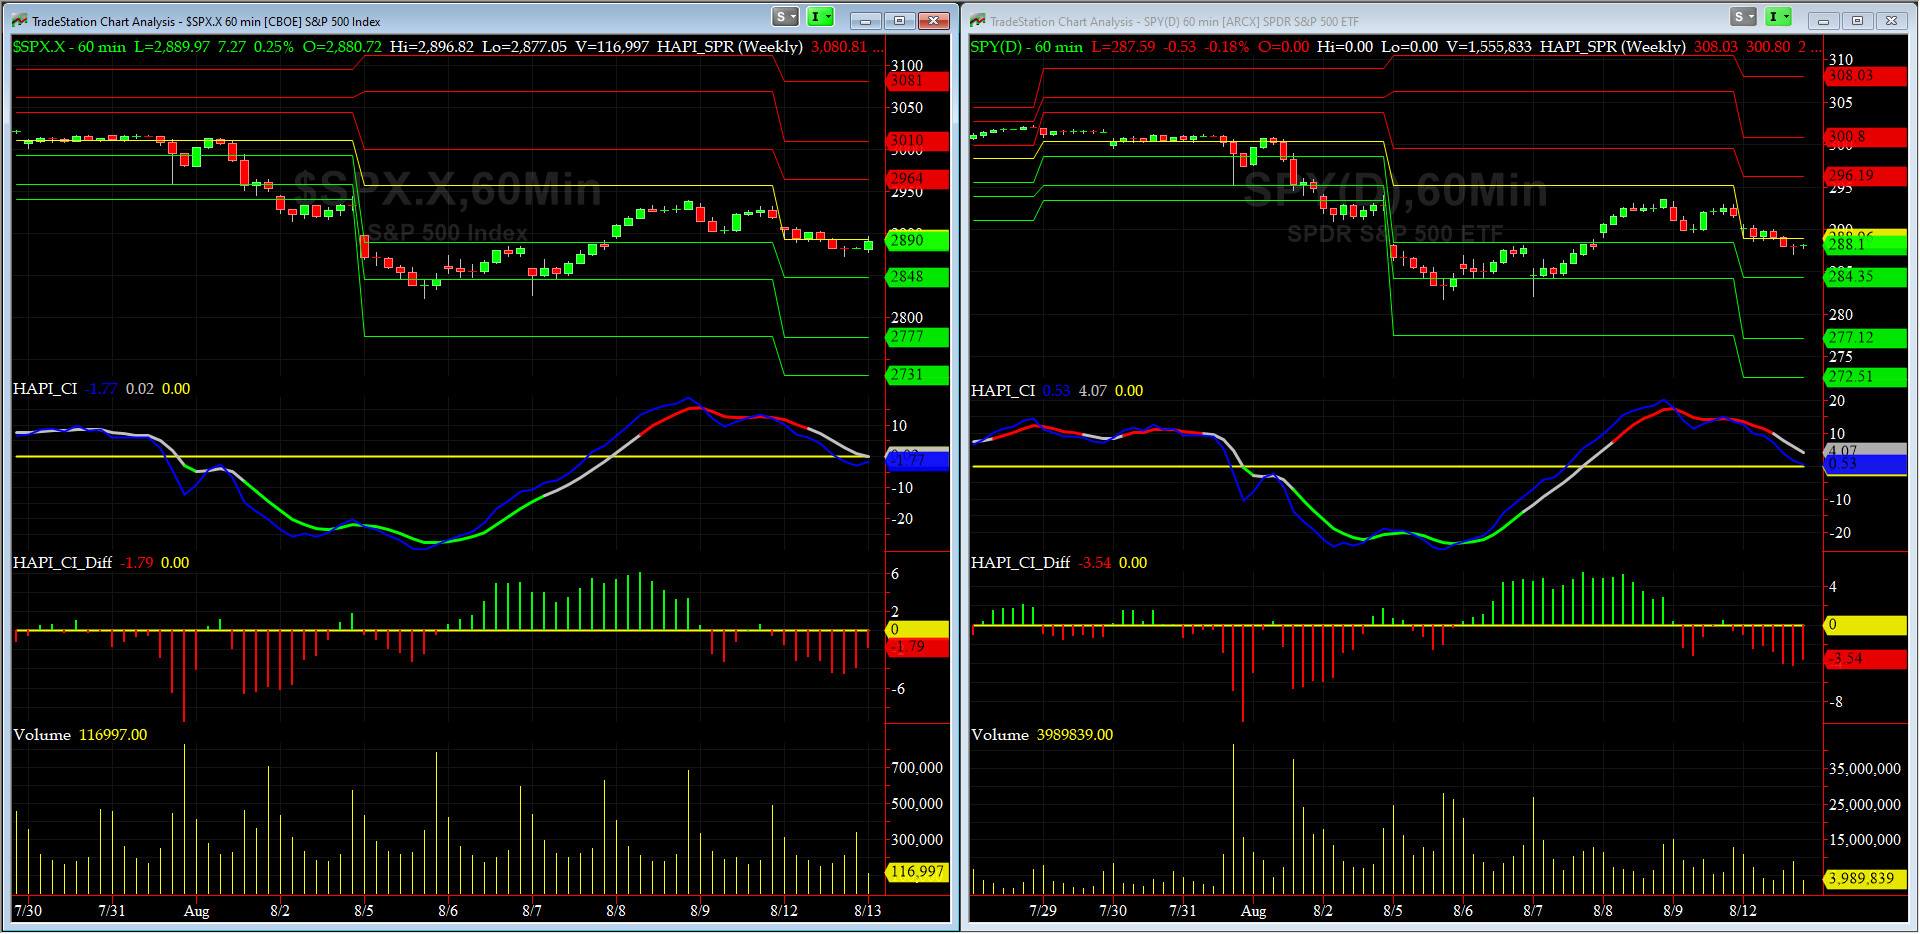
Timer Charts of S&P-500 Cash Index (SPX) + NASDAQ-100 Cash Index (NDX)
Most recent S&P-500 Cash Index (SPX) Close: 2919 up +74 (up +2.6%) for the four days ending on Friday, August 9, 2019, which closed a tad above its -2 sigma.
DJIA ALL TIME INTRADAY HIGH = 27398 (reached on Tuesday, July 16, 2019)
DJT ALL TIME INTRADAY HIGH = 11623 (reached on Friday, September 14, 2018)
SPX ALL TIME INTRADAY HIGH = 3028 (reached on Friday, July 26, 2019)
NDX ALL TIME INTRADAY HIGH = 8027 (reached on Friday, July 26, 2019)
RUT ALL TIME INTRADAY HIGH = 1742 (reached on Friday, August 31, 2018)
Current DAILY +2 Sigma SPX = 3072 with WEEKLY +2 Sigma = 3042
Current DAILY 0 Sigma SPX = 2969 with WEEKLY 0 Sigma = 2913
Current DAILY -2 Sigma SPX = 2866 with WEEKLY -2 Sigma = 2783
NYSE McClellan Oscillator = -80 (-150 is start of the O/S area; around -275 to -300 area or lower, we go into the �launch-pad� mode; over +150, we are in O/B area)
NYSE Breadth Thrust = 45.1 (40 is considered as oversold and 65 as overbought)
Well, we came back up with a roar as we were very oversold till Uber reported after the Close of Thursday causing NASDAQ futures to take a huge retreat overnight.
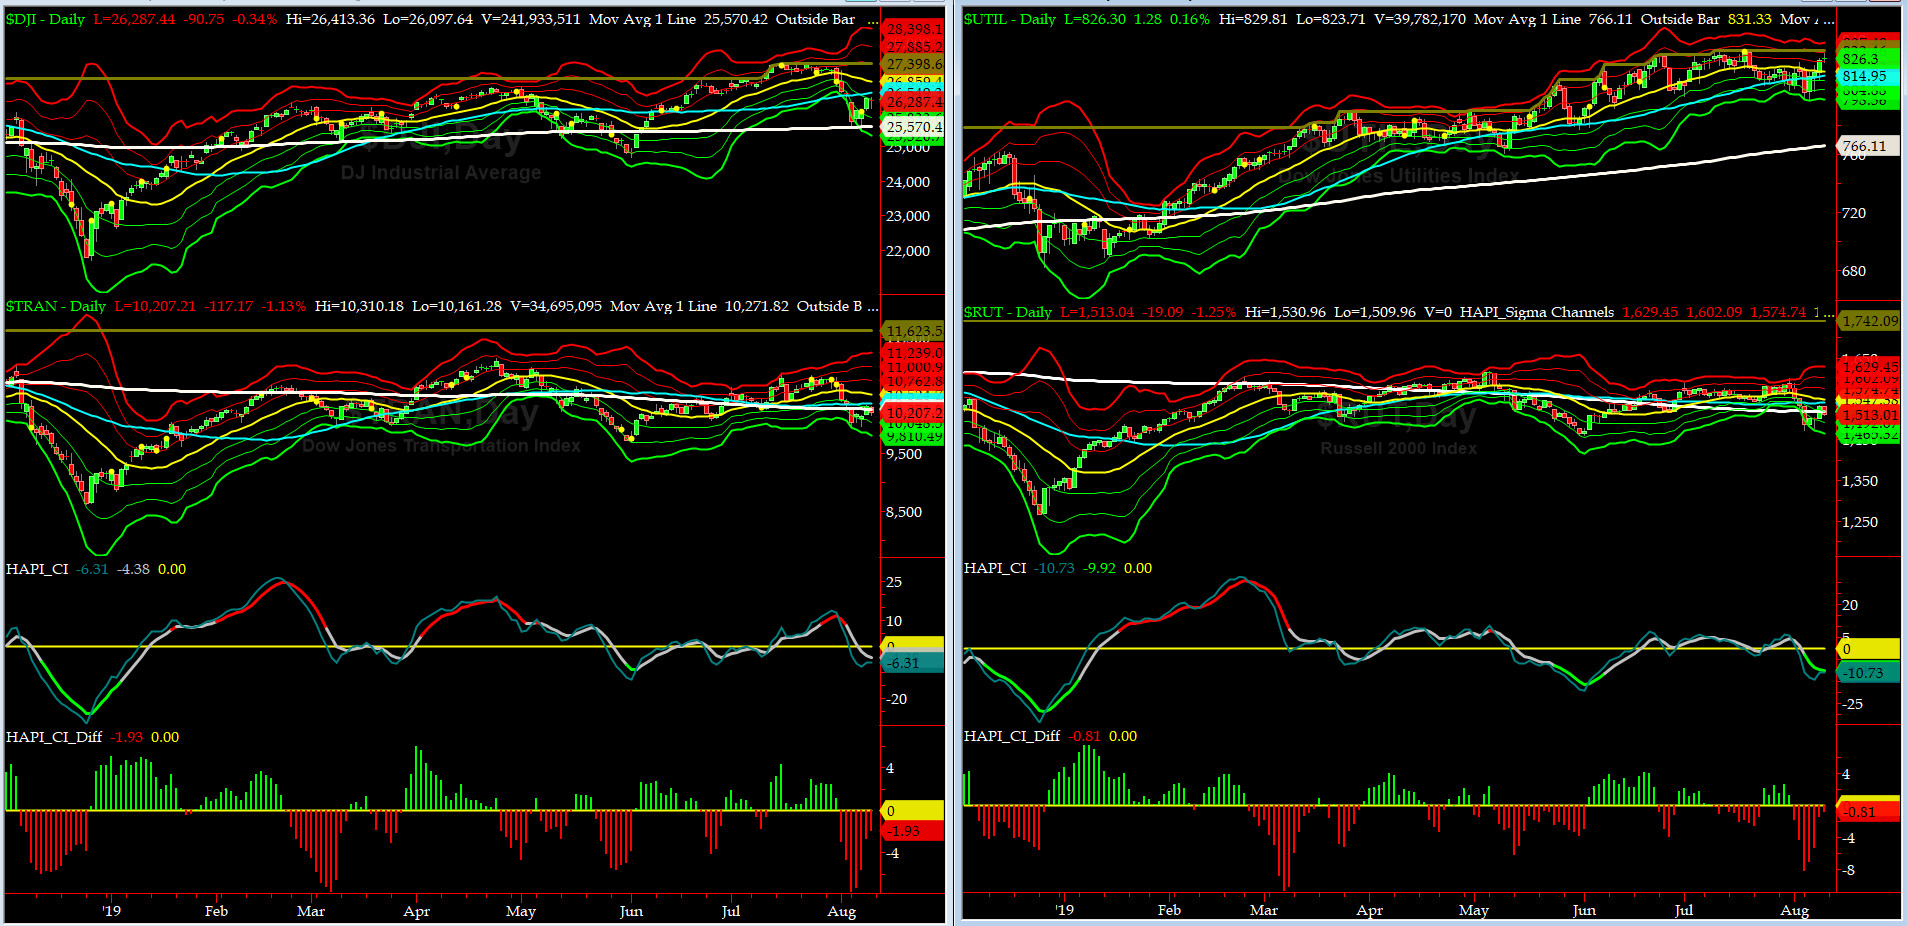
Canaries [in the Coal Mine] Chart for DJ TRAN & RUT Indices
200-Day MA DJ TRAN = 10,271 or 0.6% ABOVE DJ TRAN (max observed in last 7 yrs = 20.2%, min = -20.3%)
200-Day MA RUT = 1513 or 0.4% ABOVE RUT (max observed in last 7 yrs = 21.3%, min = -22.6%)
DJ Transportation Index (proxy for economic conditions 6 to 9 months hence) struggled to stabilize around its 200 day MA.
Russell 2000 Small Caps Index (proxy for Risk ON/OFF) again, ditto here and RISK is still OFF.

DeTrenders Charts for SPX, NDX, TRAN & RUT Indices
50-Day MA SPX = 2936 or 0.6% ABOVE SPX (max observed in last 7 yrs = +8.6%, min = -9.3%)
200-Day MA SPX = 2792 or 4.5% BELOW SPX (max observed in last 7 yrs = 15.2%, min = -14%)
Again, SIX of our EIGHT DeTrenders are in the NEGTIVE territory. The DeTrenders for DJ Tran & RUT will continue to be harbingers of future price behavior in broad indices.
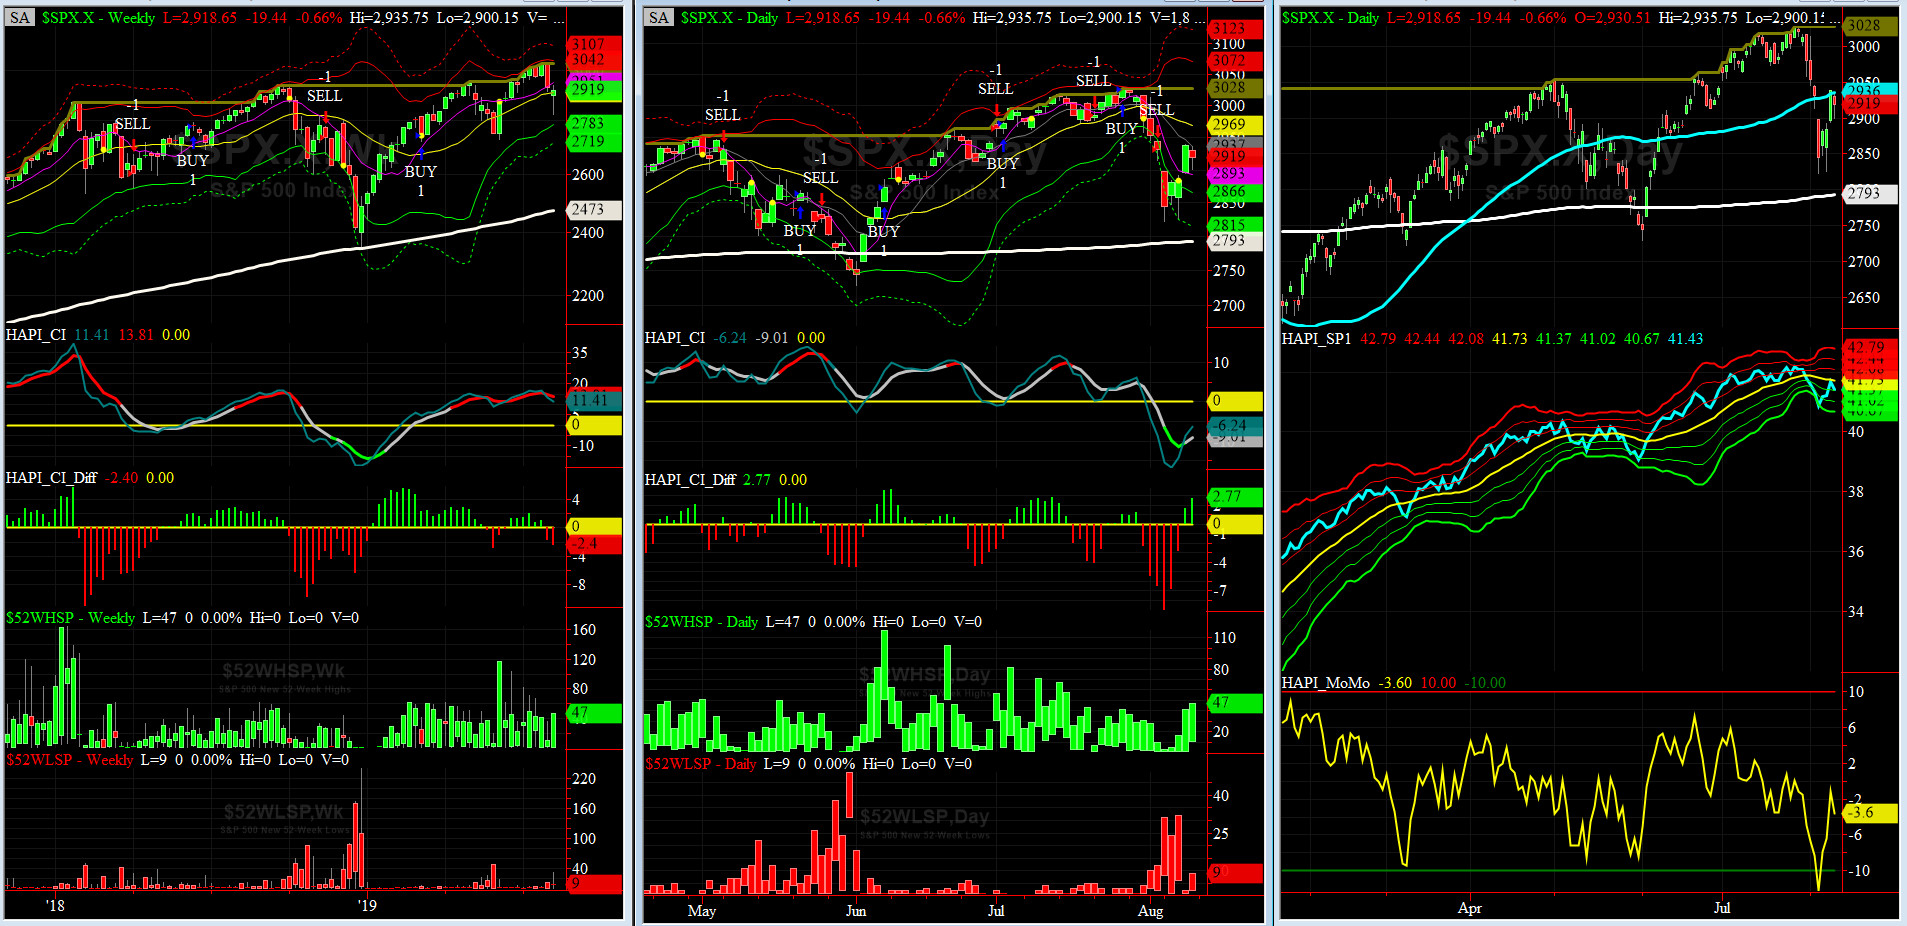
HA_SP1_Momo Chart
WEEKLY Timing Model = on a BUY Signal since Friday, March 8, 2019 CLOSE at 2743
DAILY Timing Model = on a SELL Signal since Friday, August 2, 2019 CLOSE at 2932
Max SPX 52wk-highs reading last week = 47 (over 120-140, the local maxima is in)
Max SPX 52wk-Lows reading last week = 32 (over 40-60, the local minima is in)
HA_SP1 closed near its -1 sigma channels
HA_Momo = -3.6 (reversals most likely occur above +10 or below -10)
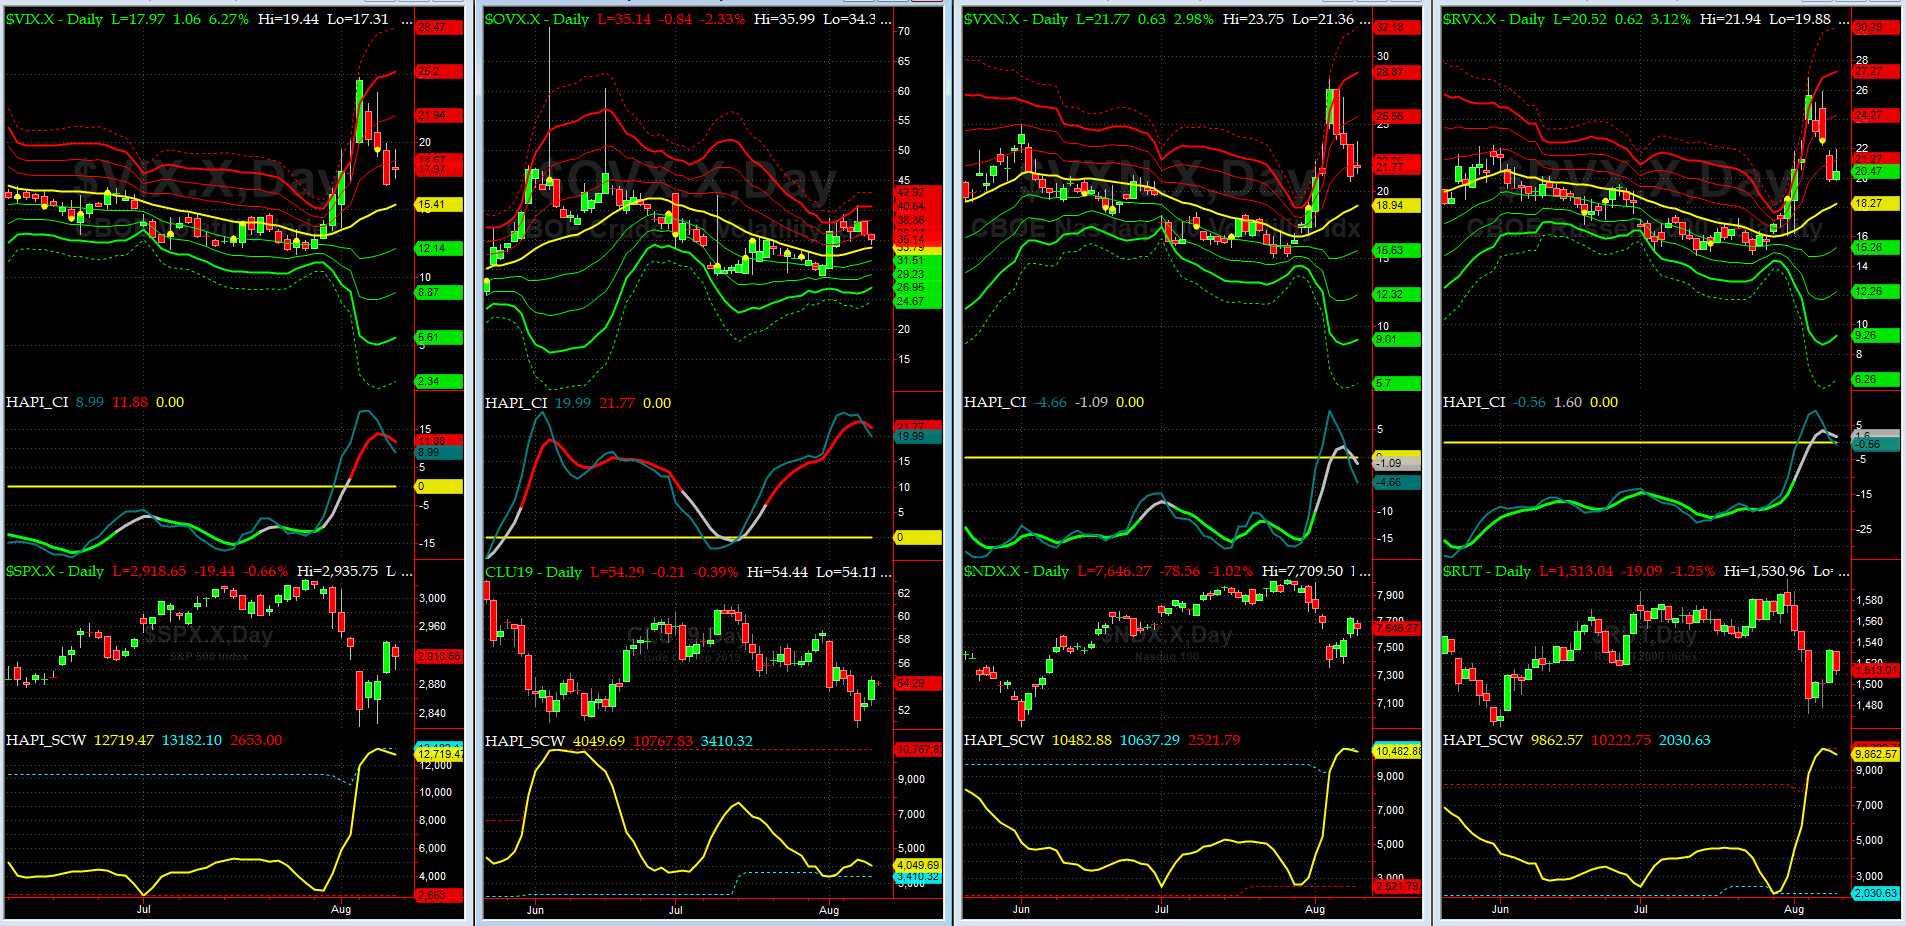
Vol of the Vols Chart
Spot VIX stood at 18 on Friday night, a tad above its +1 sigma (remember it's the VIX volatility pattern aka "its sigma channels" that matters, and not the level of VIX itself (this is per Dr. Robert Whaley, a great mentor and inventor of original VIX, now called VXO). VIX usually peaks around a test of its +4 sigma).
As expected last week was a local minima. We now have the confirmation.
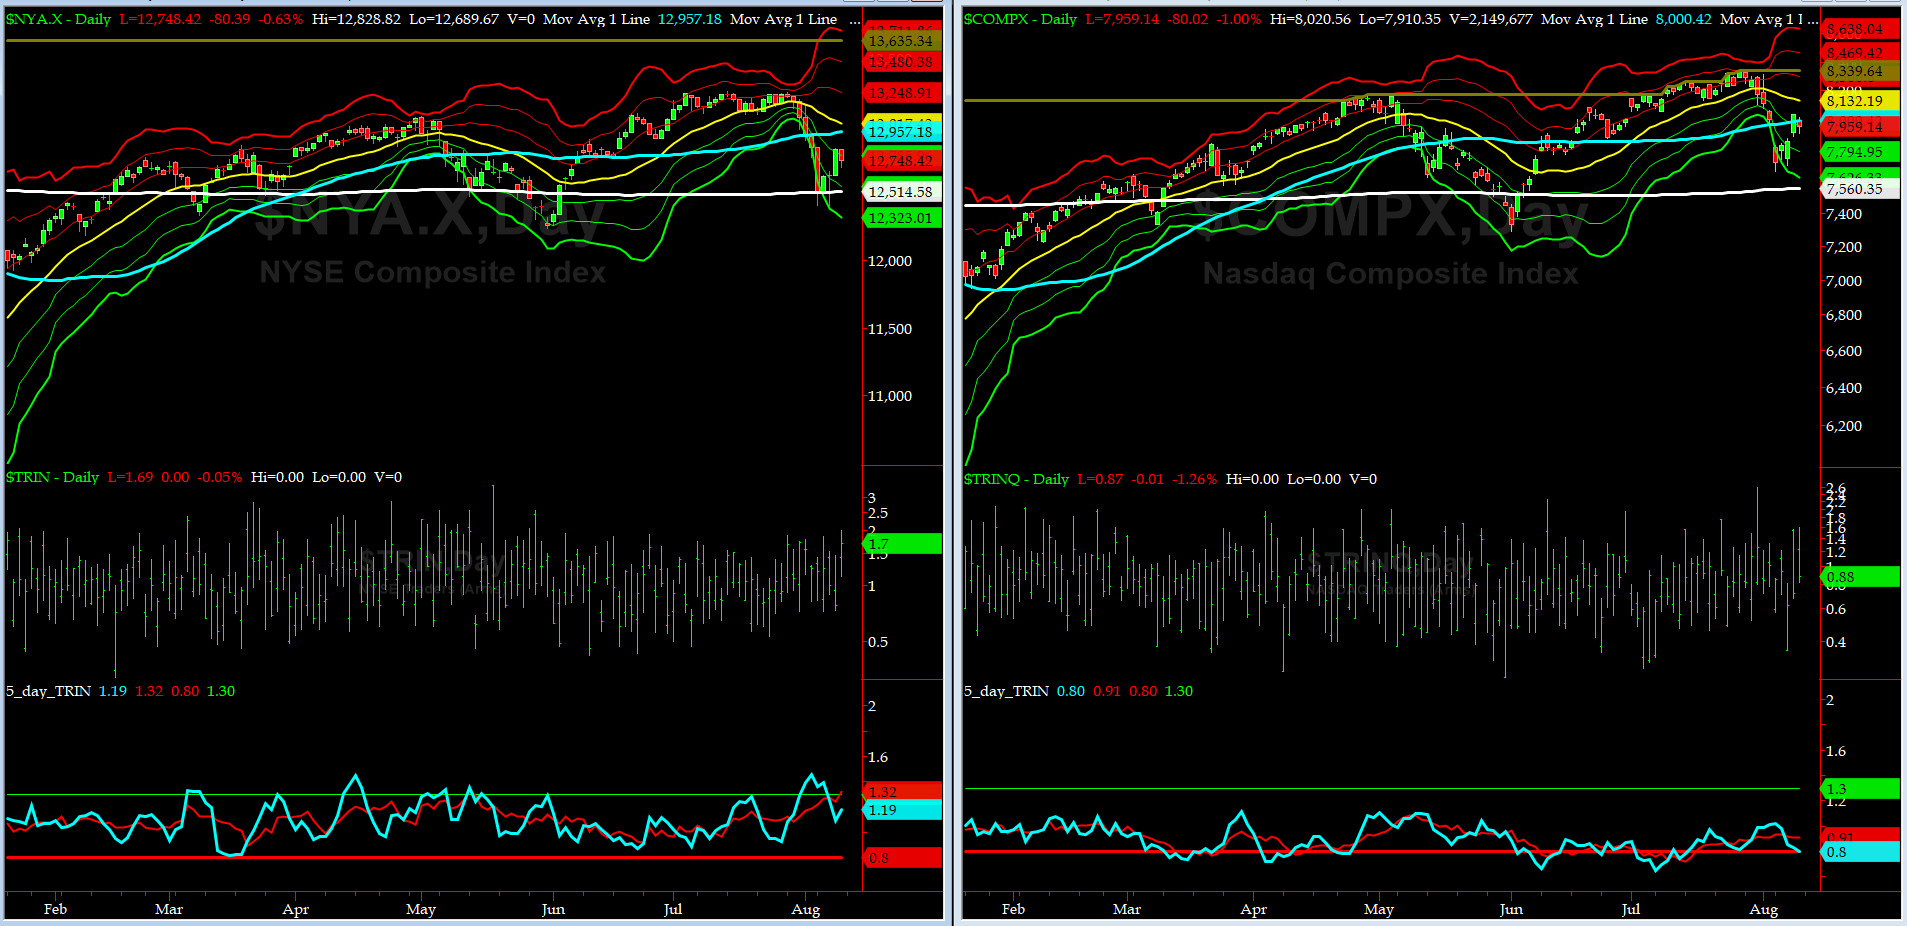
5-day TRIN & TRINQ Charts
NYSE 5-day TRIN is in the NEUTRAL-BUY zone while NASDAQ 5-day TRINQ is near the SELL zone.

Components of SPX above their respective 200-day MA Chart
This scoring indicator bounced from 57% to 64% and then came down to retest 60%......We need to keep a close eye on this during the next weeks.
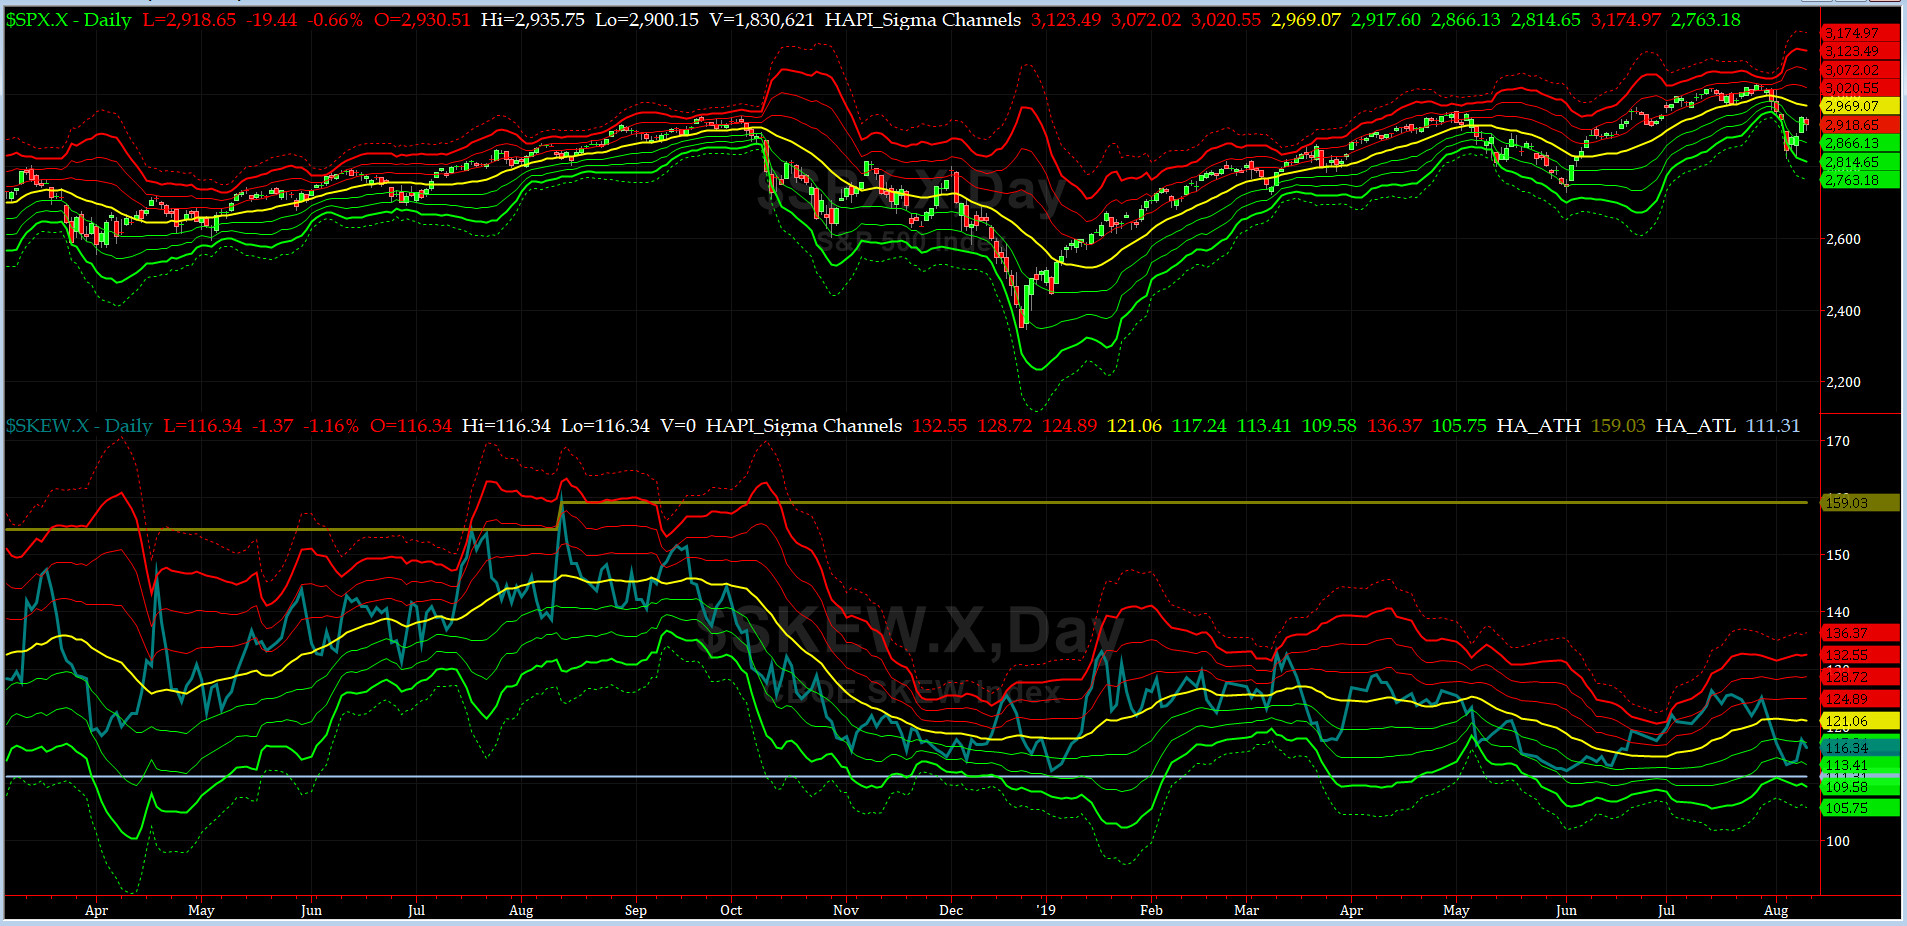
SPX SKEW (Tail Risk) Chart
On Friday, SPX SKEW (Tail Risk) rose pretty sharply to 116.3, now about its -1 sigma (normal = 115, range 100-150).
All quiet on the Eastern & Mid-Western Fronts? our beloved HRH Capt. Tiko, KCPE, still says NOPE.
How to interpret the value of SPX SKEW? (from CBOE white paper on SKEW)

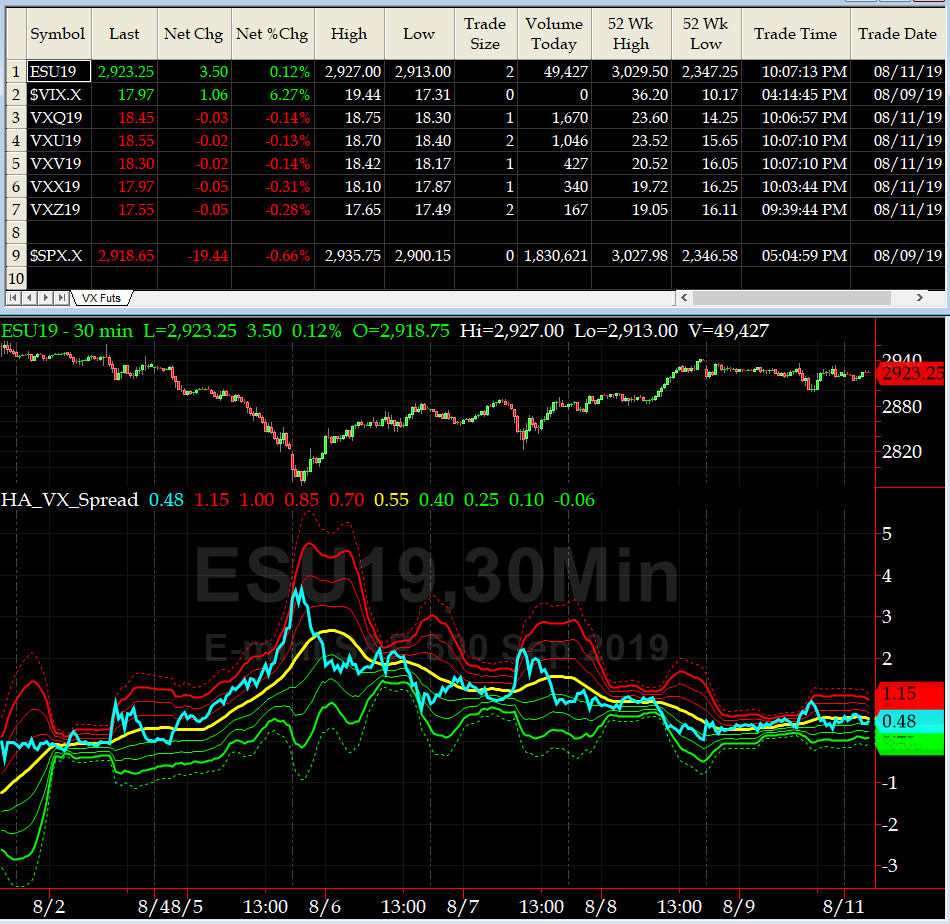
3-month VIX Futures Spread(VX) Chart
This popular timing indicator for identifying tradable bottoms, (now long AUG19, & short NOV19 VIX Futures) hit +0.60 on Friday Close. That is a very NEUTRAL signal.
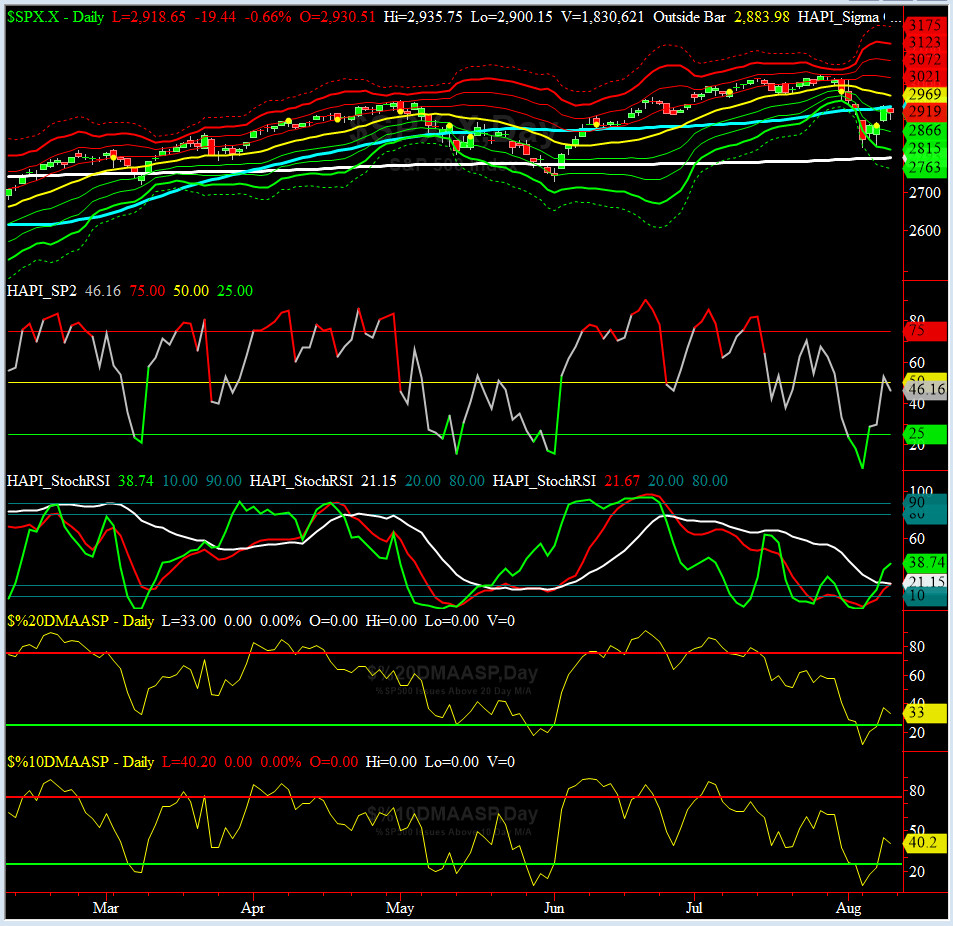
HA_SP2 Chart
HA_SP2 = 46.2 (Buy signal <= 25, Sell Signal >= 75)
This is a NEUTRAL reading here.
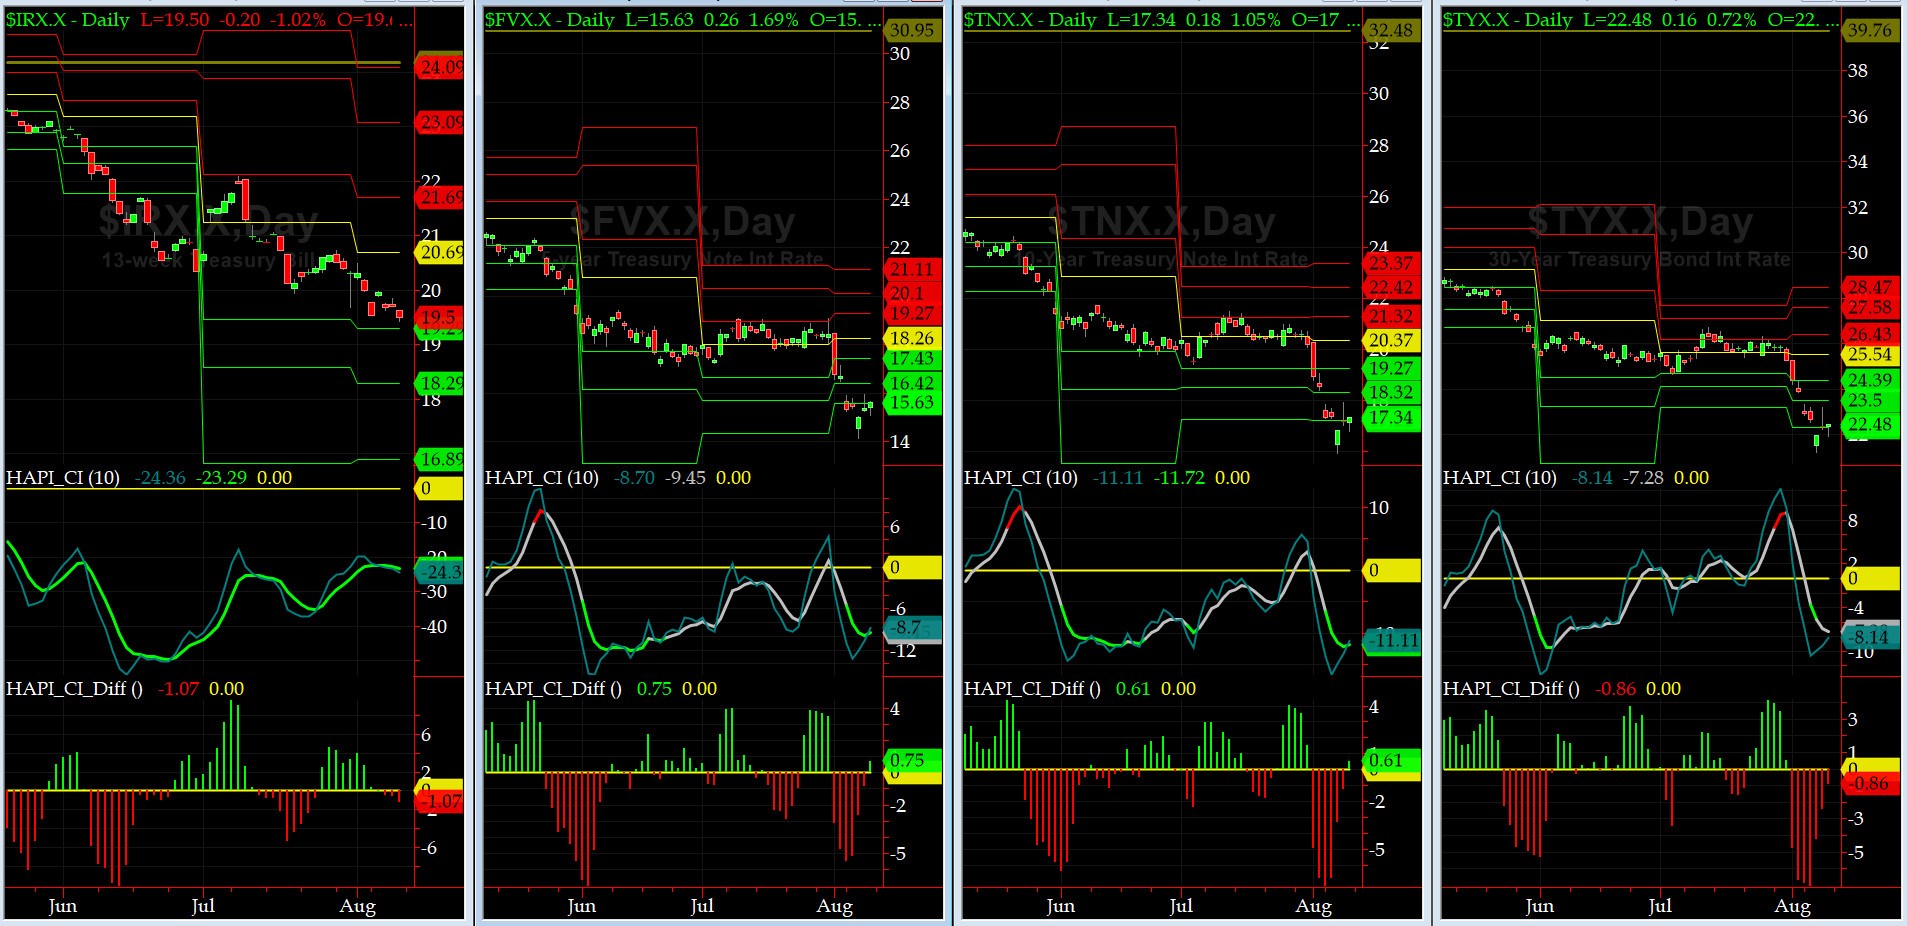
US Treasury T-Notes & T-Bonds Yields Chart
Well, our YTMs continued to get flushed, and yes, our beloved Maury continued to rough it out at the pool side of BH Waldorf-Astoria overlooking LA Country Club (he is not welcome there either, albeit for totally different reason), while the wife went on to enjoy her 7K sq, 12+ MM BH Flat mansion all by herself and did some more shoe shopping on Rodeo Dr.
Fari Hamzei
|


 Proactive Market Timing