|
Monday, August 19, 2019, 0830ET
Market Timing Charts, Analysis & Commentary for Issue #303

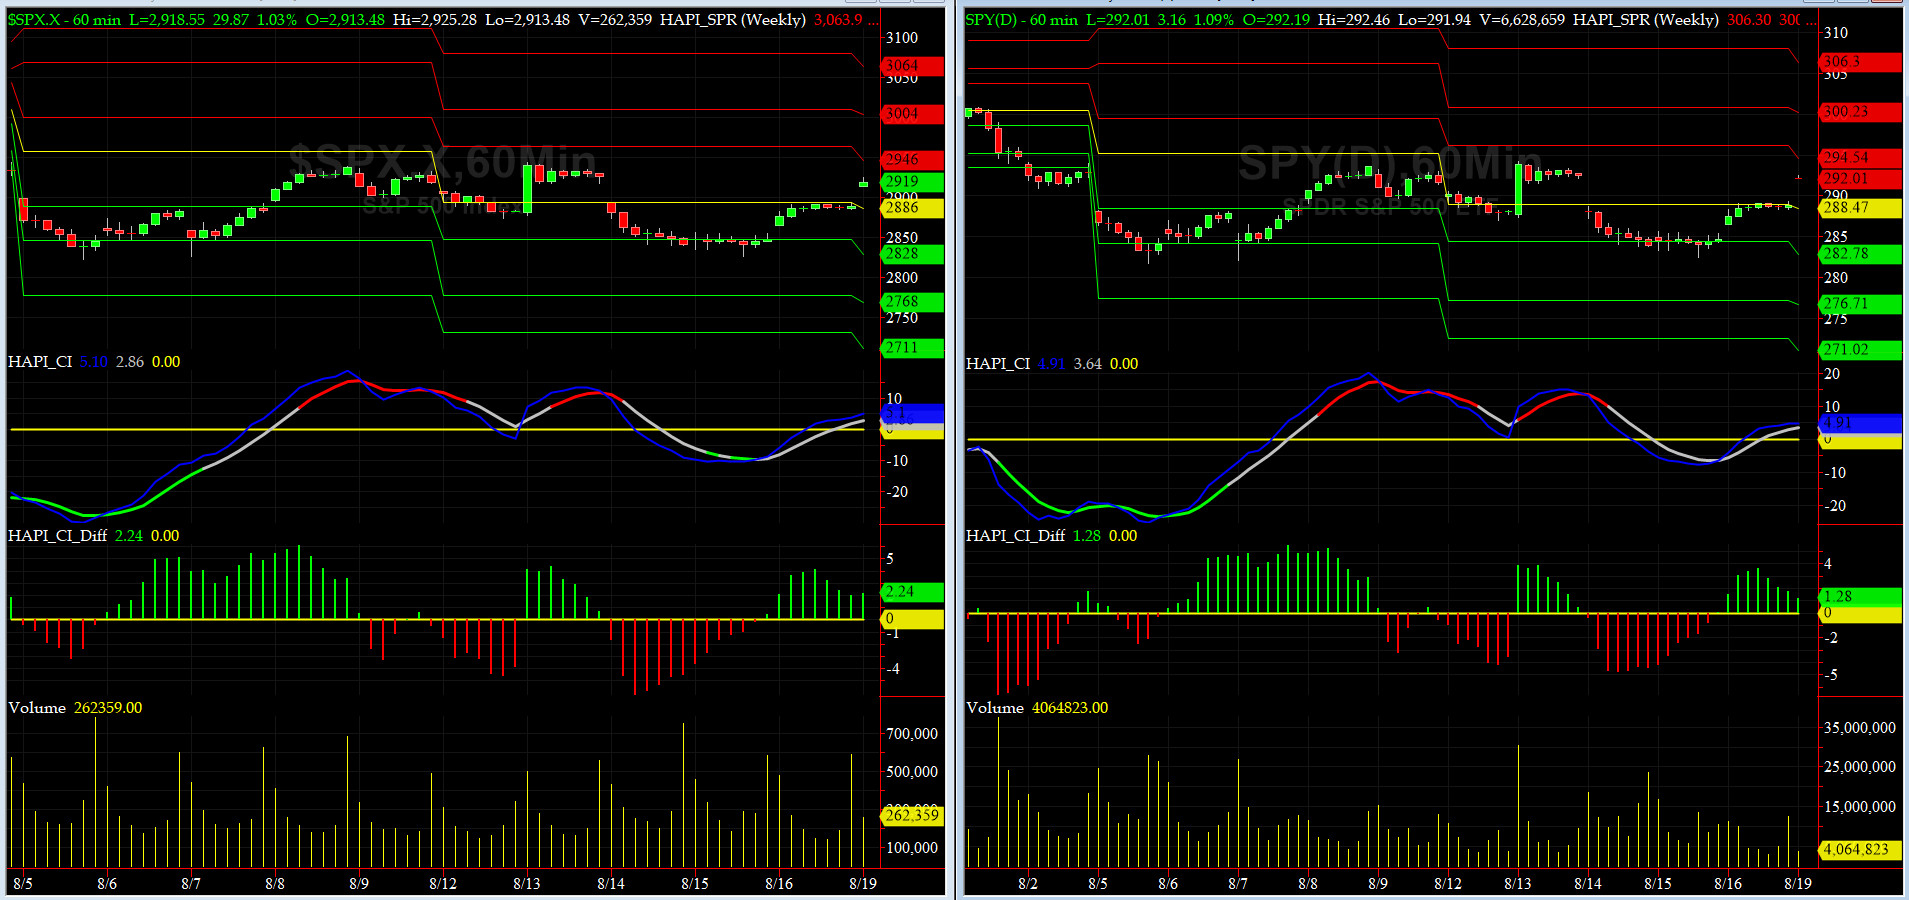
Timer Charts of S&P-500 Cash Index (SPX) + NASDAQ-100 Cash Index (NDX)
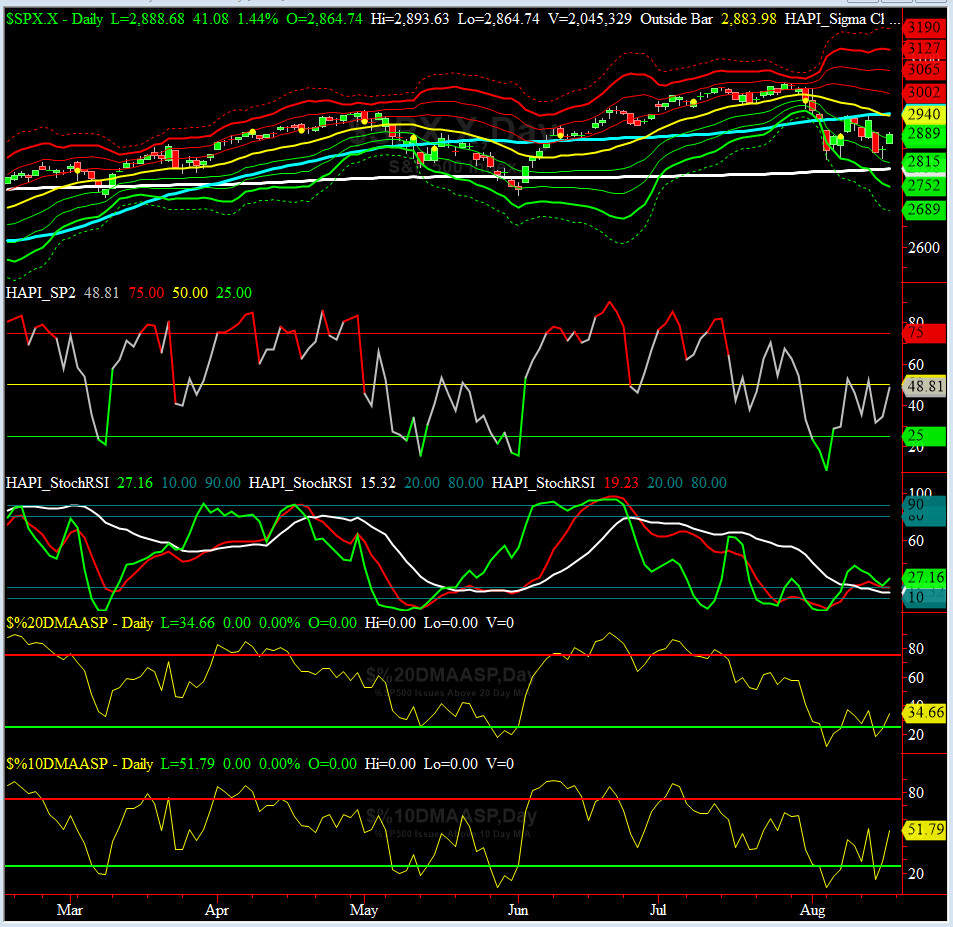
Most recent S&P-500 Cash Index (SPX) Close: 2889 down -30 (down -1.03%) for the four days ending on Friday, August 16, 2019, which closed a tad above its -1 sigma.
DJIA ALL TIME INTRADAY HIGH = 27398 (reached on Tuesday, July 16, 2019)
DJT ALL TIME INTRADAY HIGH = 11623 (reached on Friday, September 14, 2018)
SPX ALL TIME INTRADAY HIGH = 3028 (reached on Friday, July 26, 2019)
NDX ALL TIME INTRADAY HIGH = 8027 (reached on Friday, July 26, 2019)
RUT ALL TIME INTRADAY HIGH = 1742 (reached on Friday, August 31, 2018)
Current DAILY +2 Sigma SPX = 3065 with WEEKLY +2 Sigma = 3040
Current DAILY 0 Sigma SPX = 2940 with WEEKLY 0 Sigma = 2915
Current DAILY -2 Sigma SPX = 2815 with WEEKLY -2 Sigma = 2791
NYSE McClellan Oscillator = -32 (-150 is start of the O/S area; around -275 to -300 area or lower, we go into the �launch-pad� mode; over +150, we are in O/B area)
NYSE Breadth Thrust = 48.1 (40 is considered as oversold and 65 as overbought)
Well, we saw what happens when a failed CEO tries to run our Economy. Total Chaos brings about huge vol. While that is a paradise revisited (remember Dec 2018) for the daytraders, it is very scary for average Mom & Pop Investors who had just put their toes in.
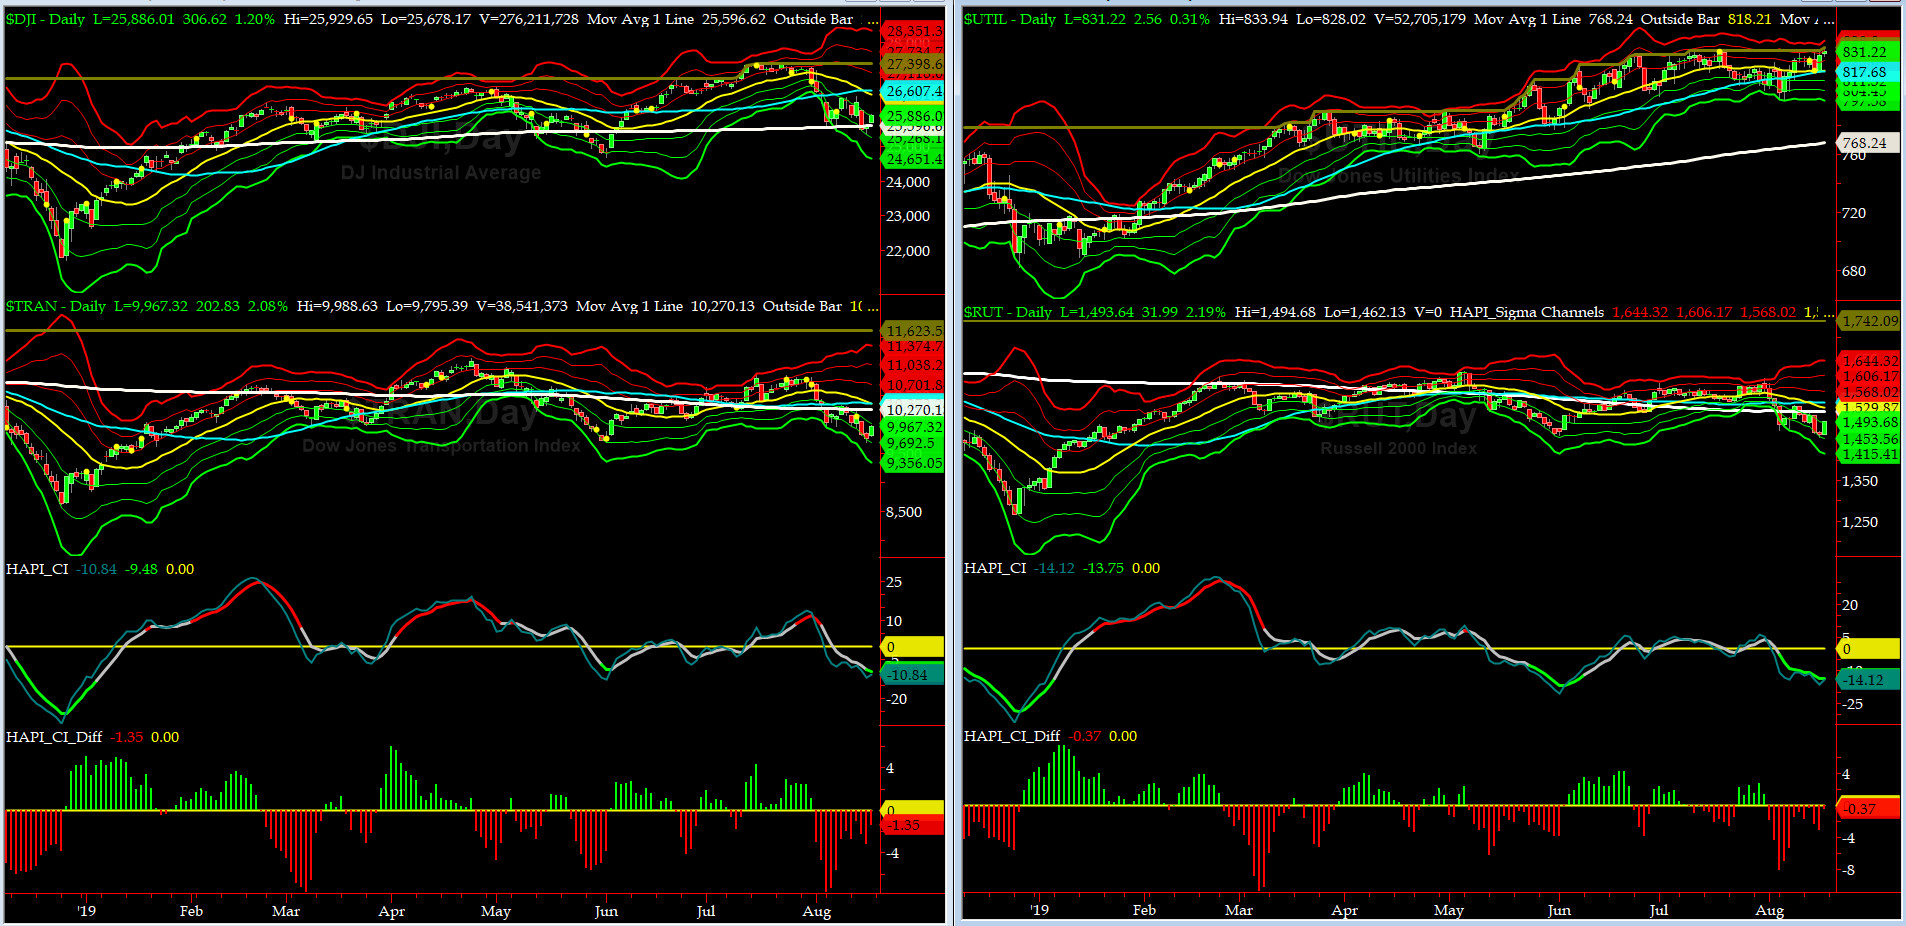
Canaries [in the Coal Mine] Chart for DJ TRAN & RUT Indices
200-Day MA DJ TRAN = 10,270 or 2.9% ABOVE DJ TRAN (max observed in last 7 yrs = 20.2%, min = -20.3%)
200-Day MA RUT = 1518 or 1.7% ABOVE RUT (max observed in last 7 yrs = 21.3%, min = -22.6%)
DJ Transportation Index (proxy for economic conditions 6 to 9 months hence) finally stabilized on Friday (OpEx).
Russell 2000 Small Caps Index (proxy for Risk ON/OFF) ditto here and RISK is still OFF.
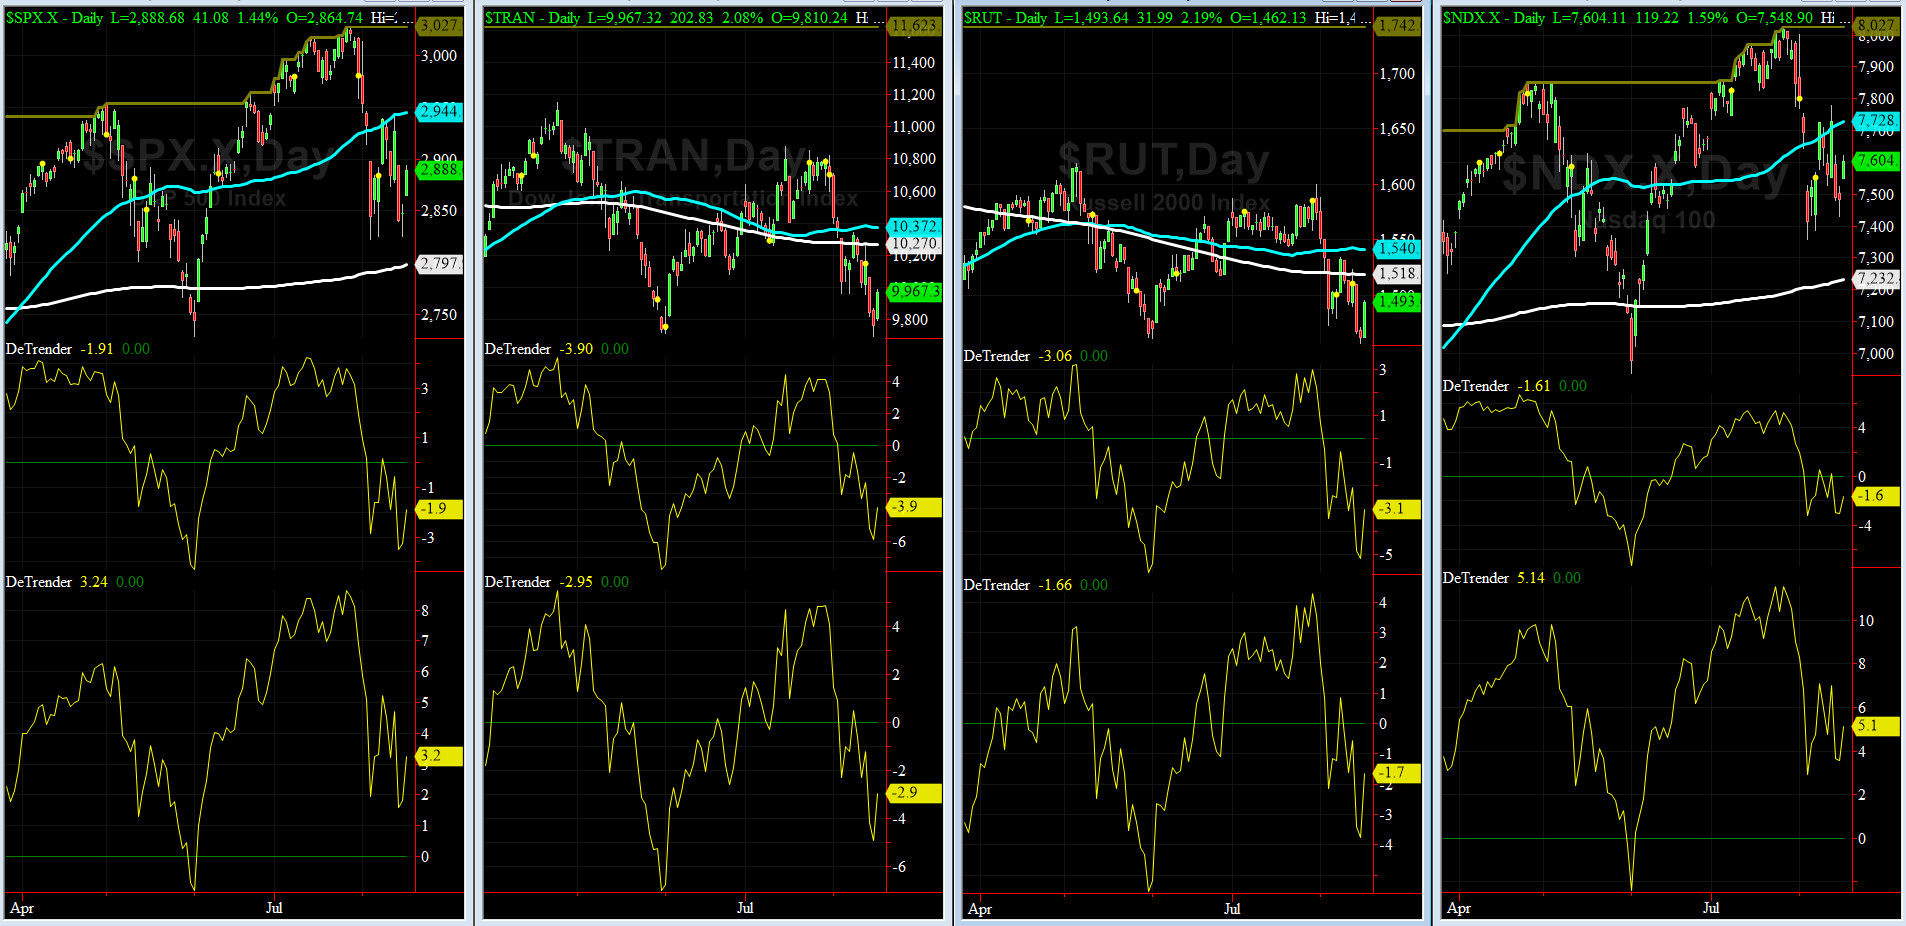
DeTrenders Charts for SPX, NDX, TRAN & RUT Indices
50-Day MA SPX = 2944 or 1.9% ABOVE SPX (max observed in last 7 yrs = +8.6%, min = -9.3%)
200-Day MA SPX = 2797 or 3.2% BELOW SPX (max observed in last 7 yrs = 15.2%, min = -14%)
Again, SIX of our EIGHT DeTrenders are in the NEGTIVE territory. The DeTrenders for DJ Tran & RUT will continue to be harbingers of future price behavior in broad indices.
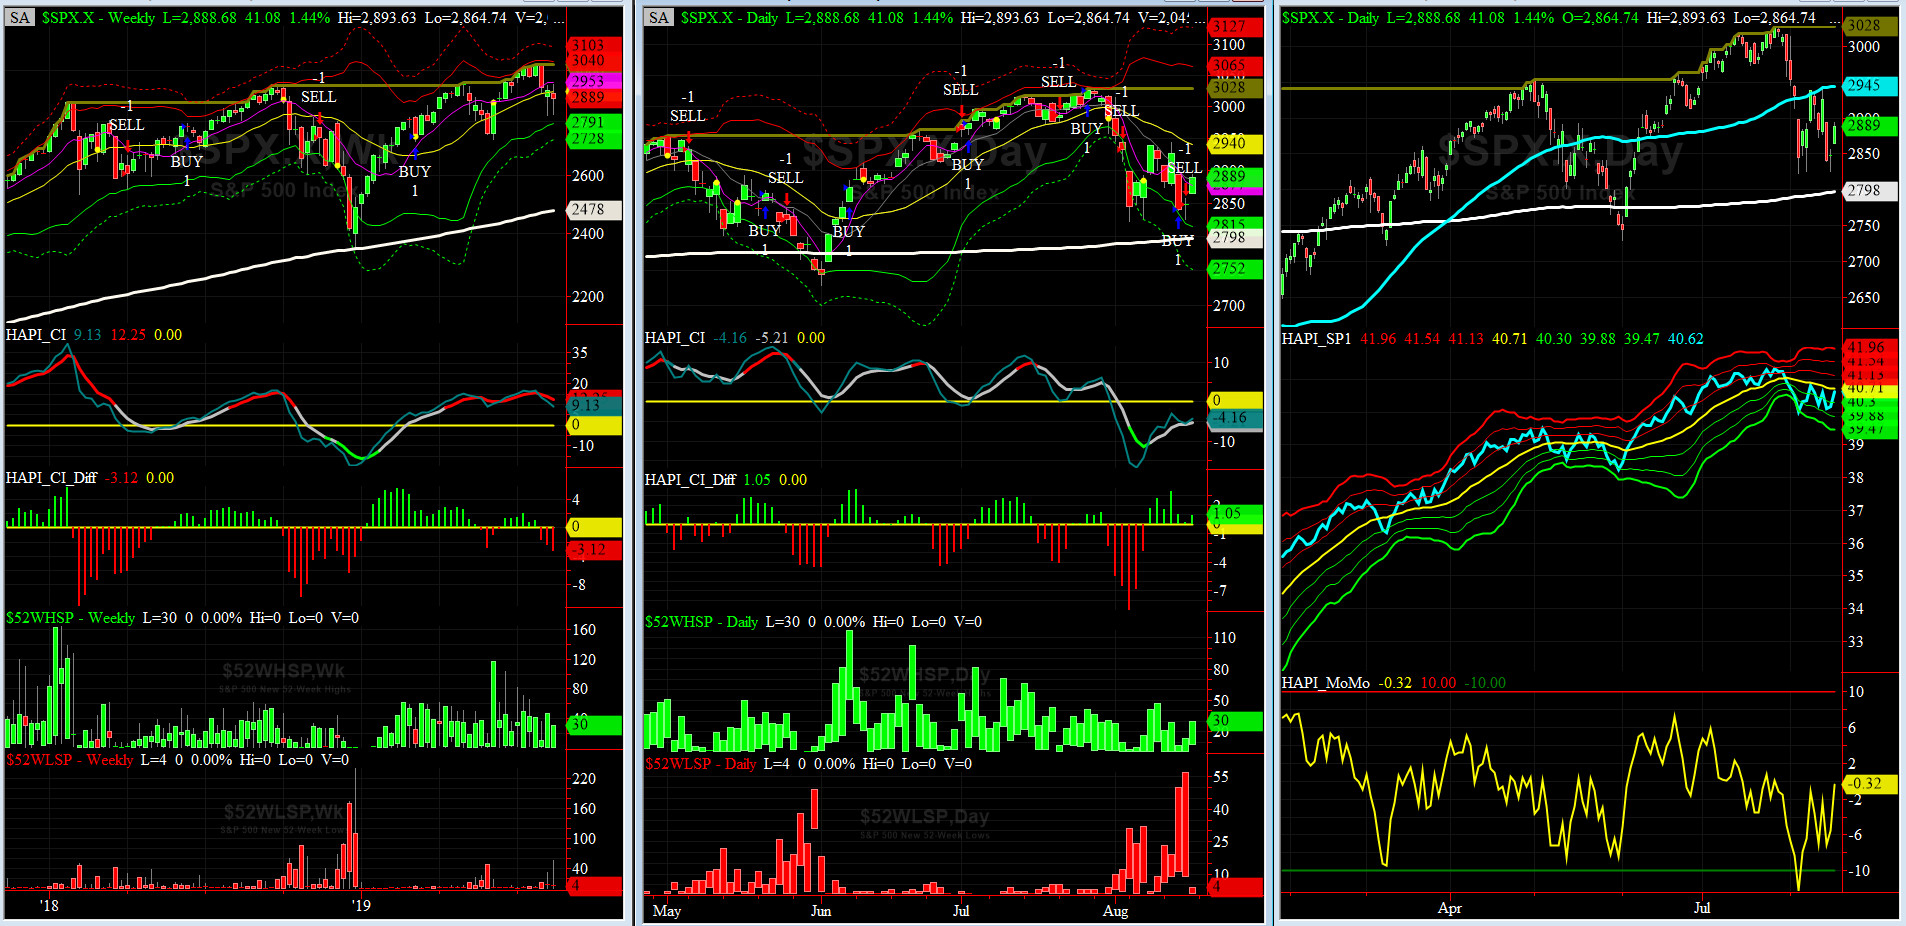
HA_SP1_Momo Chart
WEEKLY Timing Model = on a BUY Signal since Friday, March 8, 2019 CLOSE at 2743
DAILY Timing Model = on a SELL Signal since Friday, August 15, 2019 CLOSE at 2847
Max SPX 52wk-highs reading last week = 30 (over 120-140, the local maxima is in)
Max SPX 52wk-Lows reading last week = 57 (over 40-60, the local minima is in)
HA_SP1 closed near its zero sigma channels
HA_Momo = -0.32 (reversals most likely occur above +10 or below -10)

Vol of the Vols Chart
Spot VIX stood at 18.5 on Friday night, a tad above its +0.5 sigma (remember it's the VIX volatility pattern aka "its sigma channels" that matters, and not the level of VIX itself (this is per Dr. Robert Whaley, a great mentor and inventor of original VIX, now called VXO). VIX usually peaks around a test of its +4 sigma).
Last week VIX trading data gave us a buy confirmation but then Grumpino stepped in and made another mess. Let's see if this week confirmation will hold. We simply just don't know !!
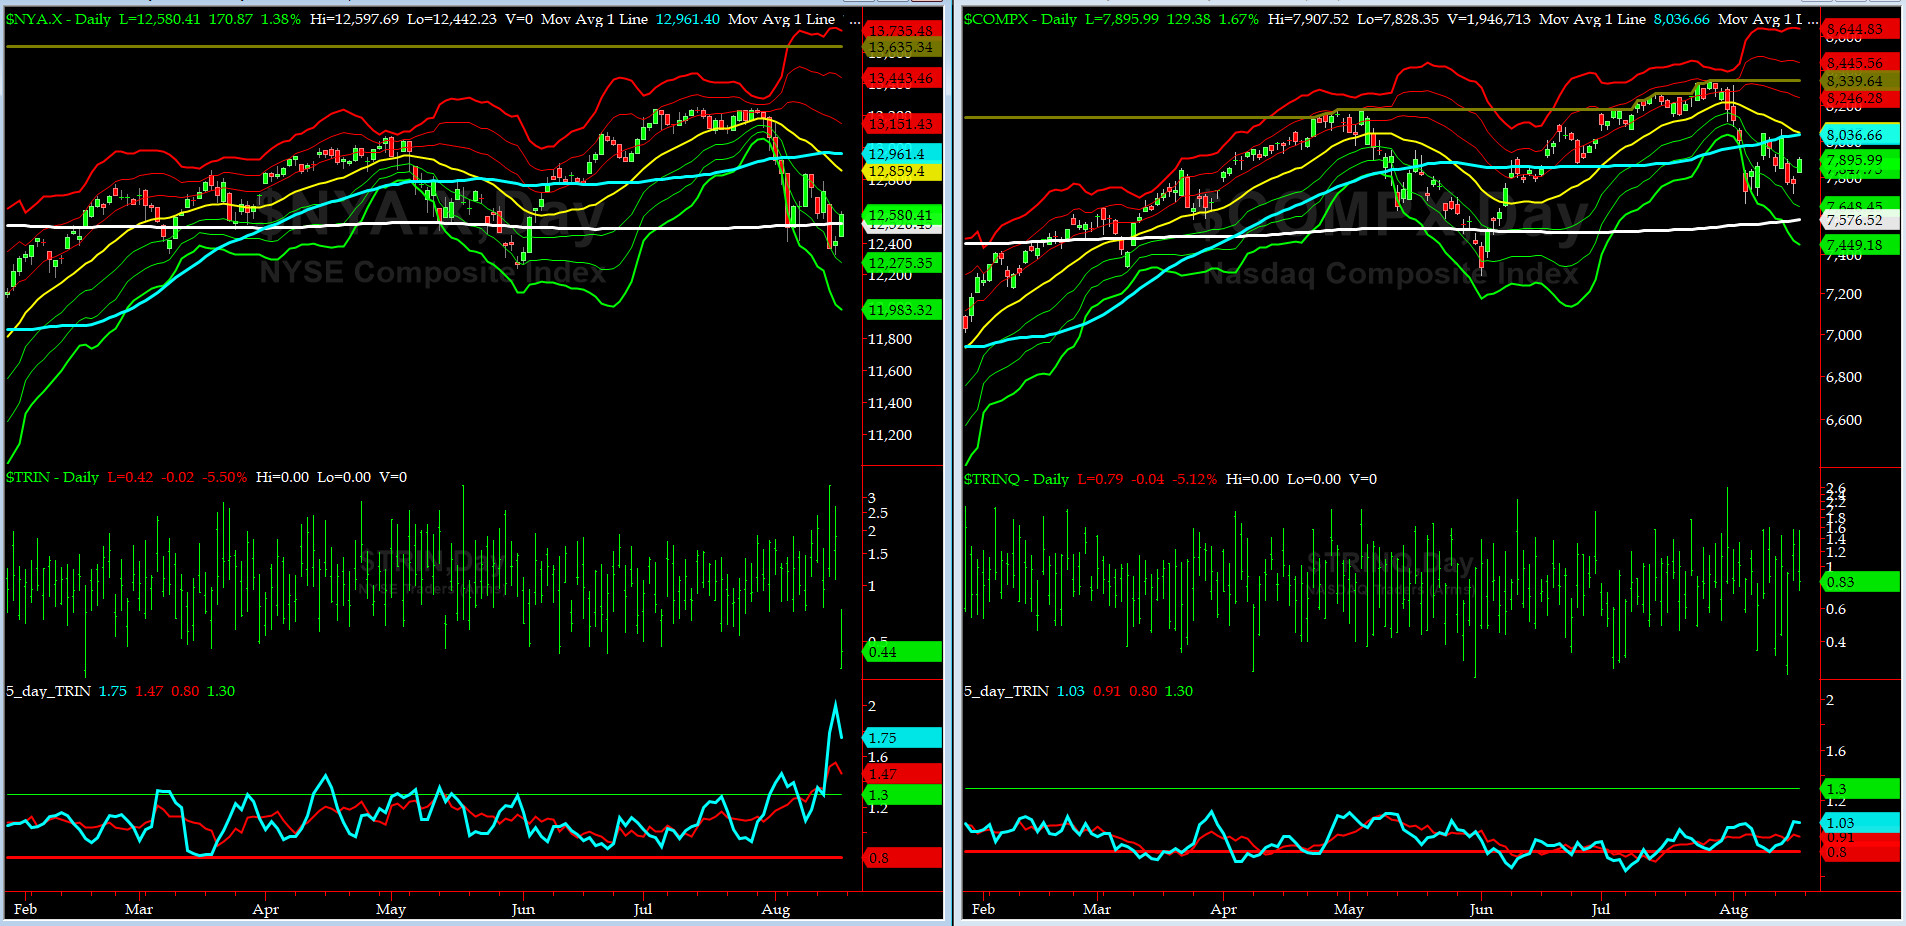
5-day TRIN & TRINQ Charts
NYSE 5-day TRIN is big time in the BUY zone while NASDAQ 5-day TRINQ is still in the NEUTRAL zone.
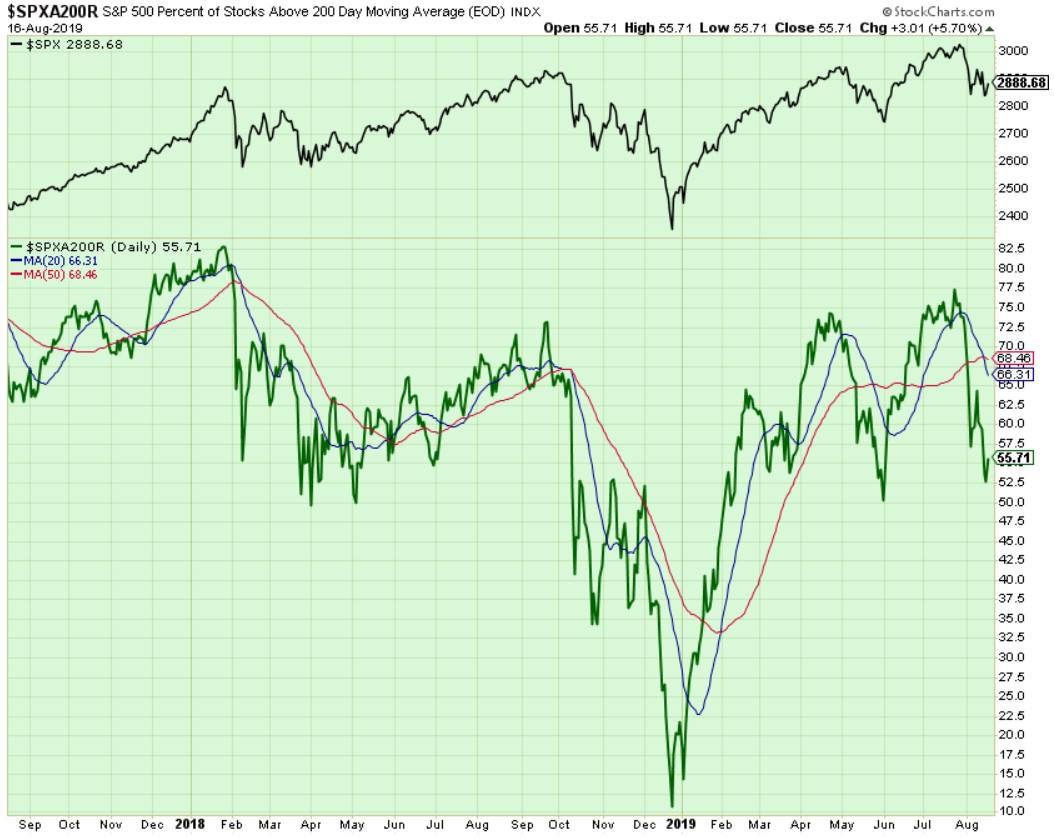
Components of SPX above their respective 200-day MA Chart
This scoring indicator retest of 60% level failed and we dropped to 55%......We need to keep a close eye on this during the next week as a move below 50% is a big issue for the Longs.
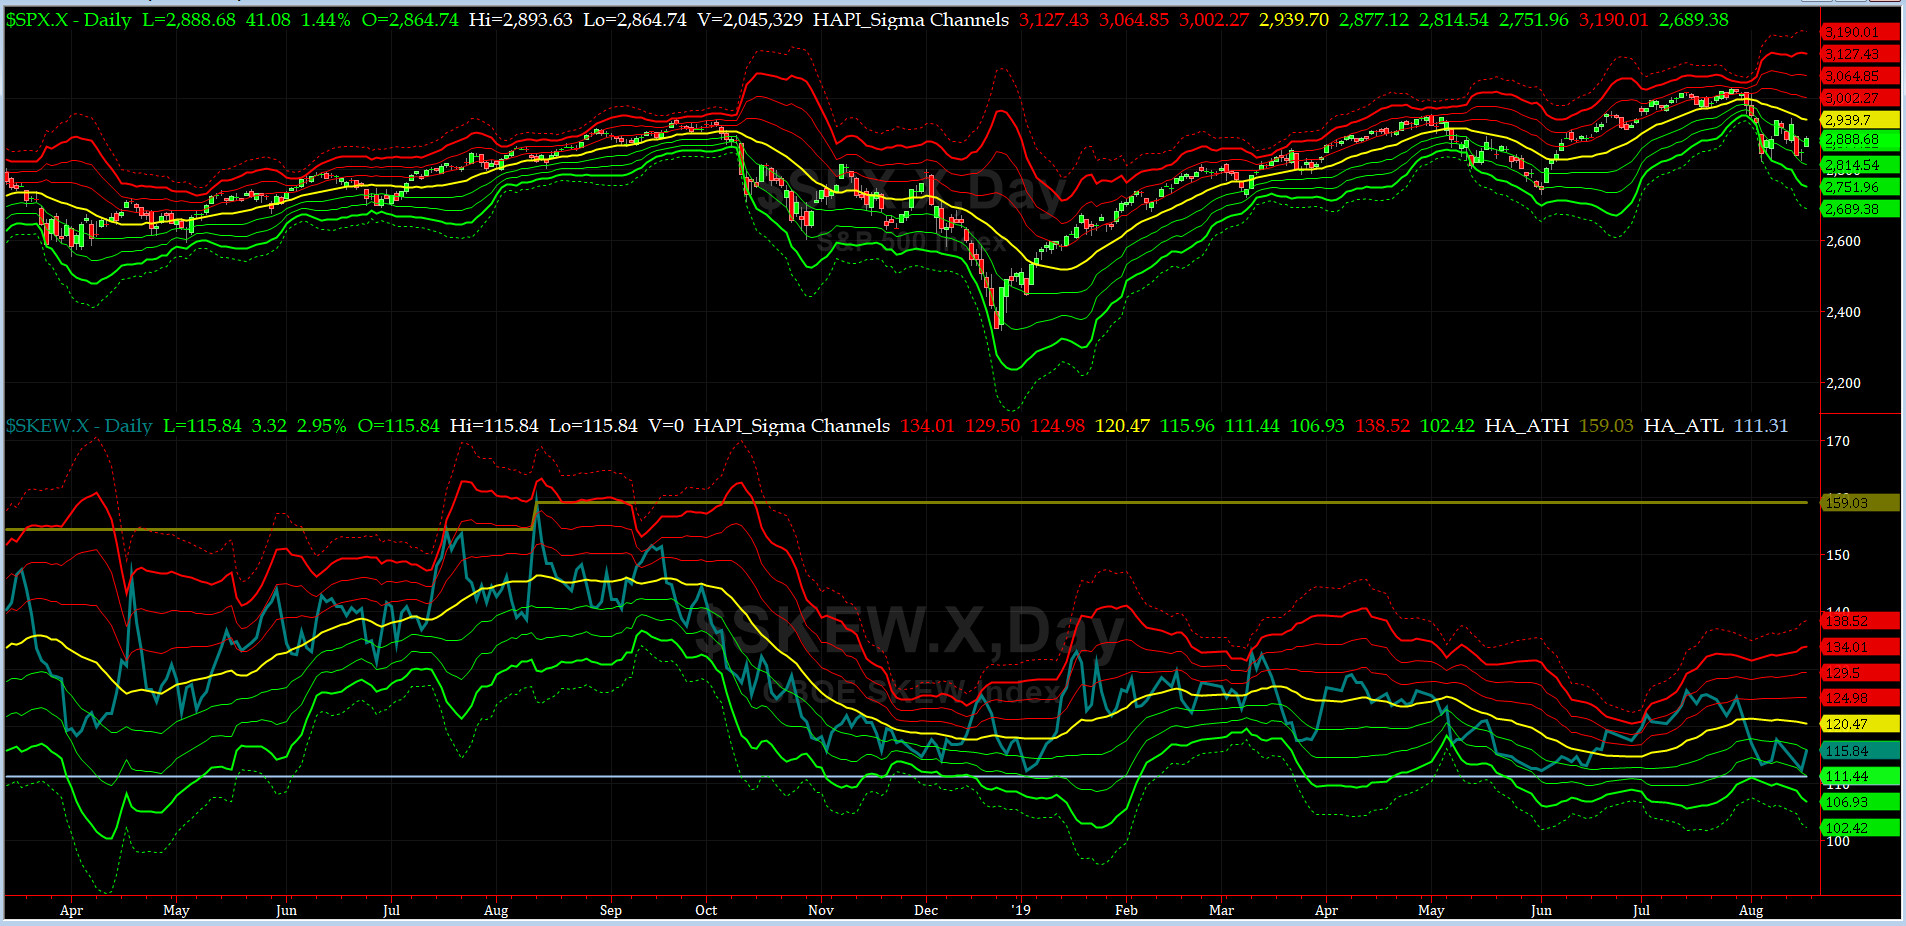
SPX SKEW (Downside Tail Risk) Chart
On Friday, SPX SKEW (Downside Tail Risk) rose pretty sharply to 115.8, now about its -1 sigma (normal = 115, range 100-150).
All quiet on the Eastern & Mid-Western Fronts? our beloved HRH Capt. Tiko, KCPE, still says NOPE.
How to interpret the value of SPX SKEW? (from CBOE white paper on SKEW)

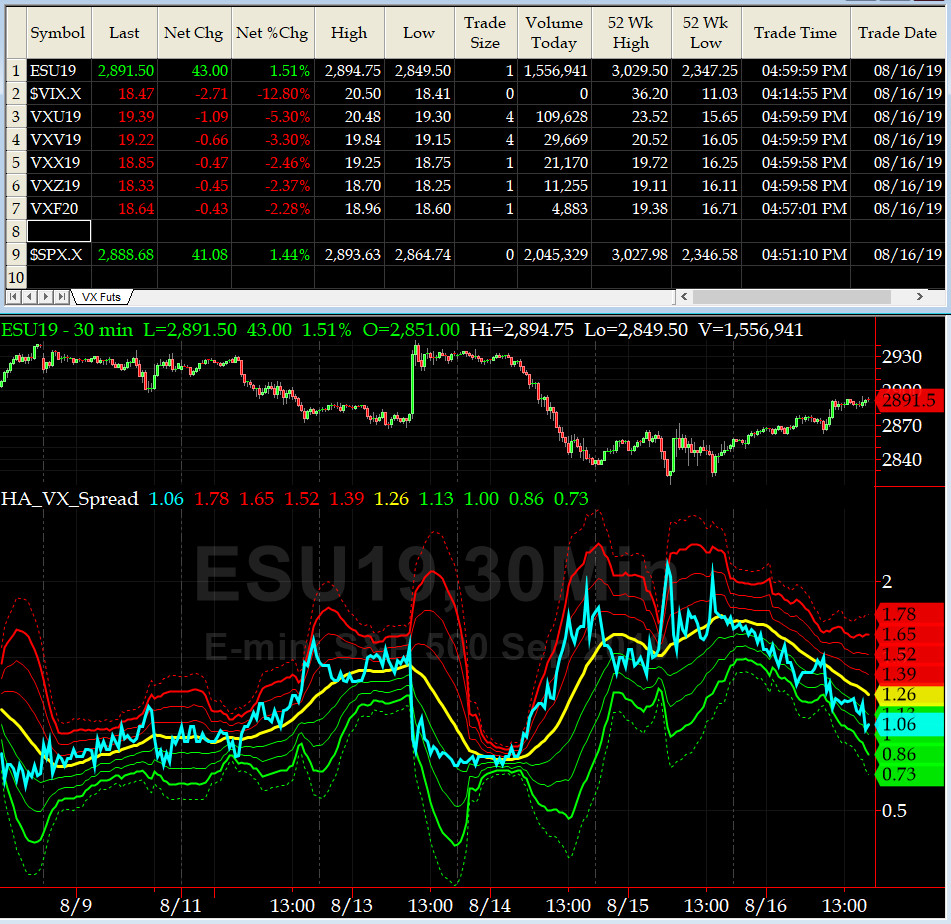
3-month VIX Futures Spread(VX) Chart
This popular timing indicator for identifying tradable bottoms, (now long SEP19, & short DEEZ19 VIX Futures) hit +1.03 on Friday Close. That is signaling a [tradable?] bottom on Thursday. Again, with Grumpino's erratic behavior, you never know.
HA_SP2 Chart
HA_SP2 = 48.8 (Buy signal <= 25, Sell Signal >= 75)
This is a NEUTRAL reading here.

US Treasury T-Notes & T-Bonds Yields Chart
Well, our YTMs continued to get flushed, and yes, our beloved Maury continued to rough it out at the pool side of BH Waldorf-Astoria overlooking LA Country Club (he is not welcome there either, albeit for totally different reason), while Mrs. Maury continued with vengeance, her quest for more shoe shopping on Rodeo Dr. Life can be very tough for the rich & famous. Their revenge of the inverted yield curve translated to more conspicuous consumption.
Fari Hamzei
|


 Proactive Market Timing