|
Monday, August 26, 2019, 0845ET
Market Timing Charts, Analysis & Commentary for Issue #304
Timer Charts of S&P-500 Cash Index (SPX) + NASDAQ-100 Cash Index (NDX)
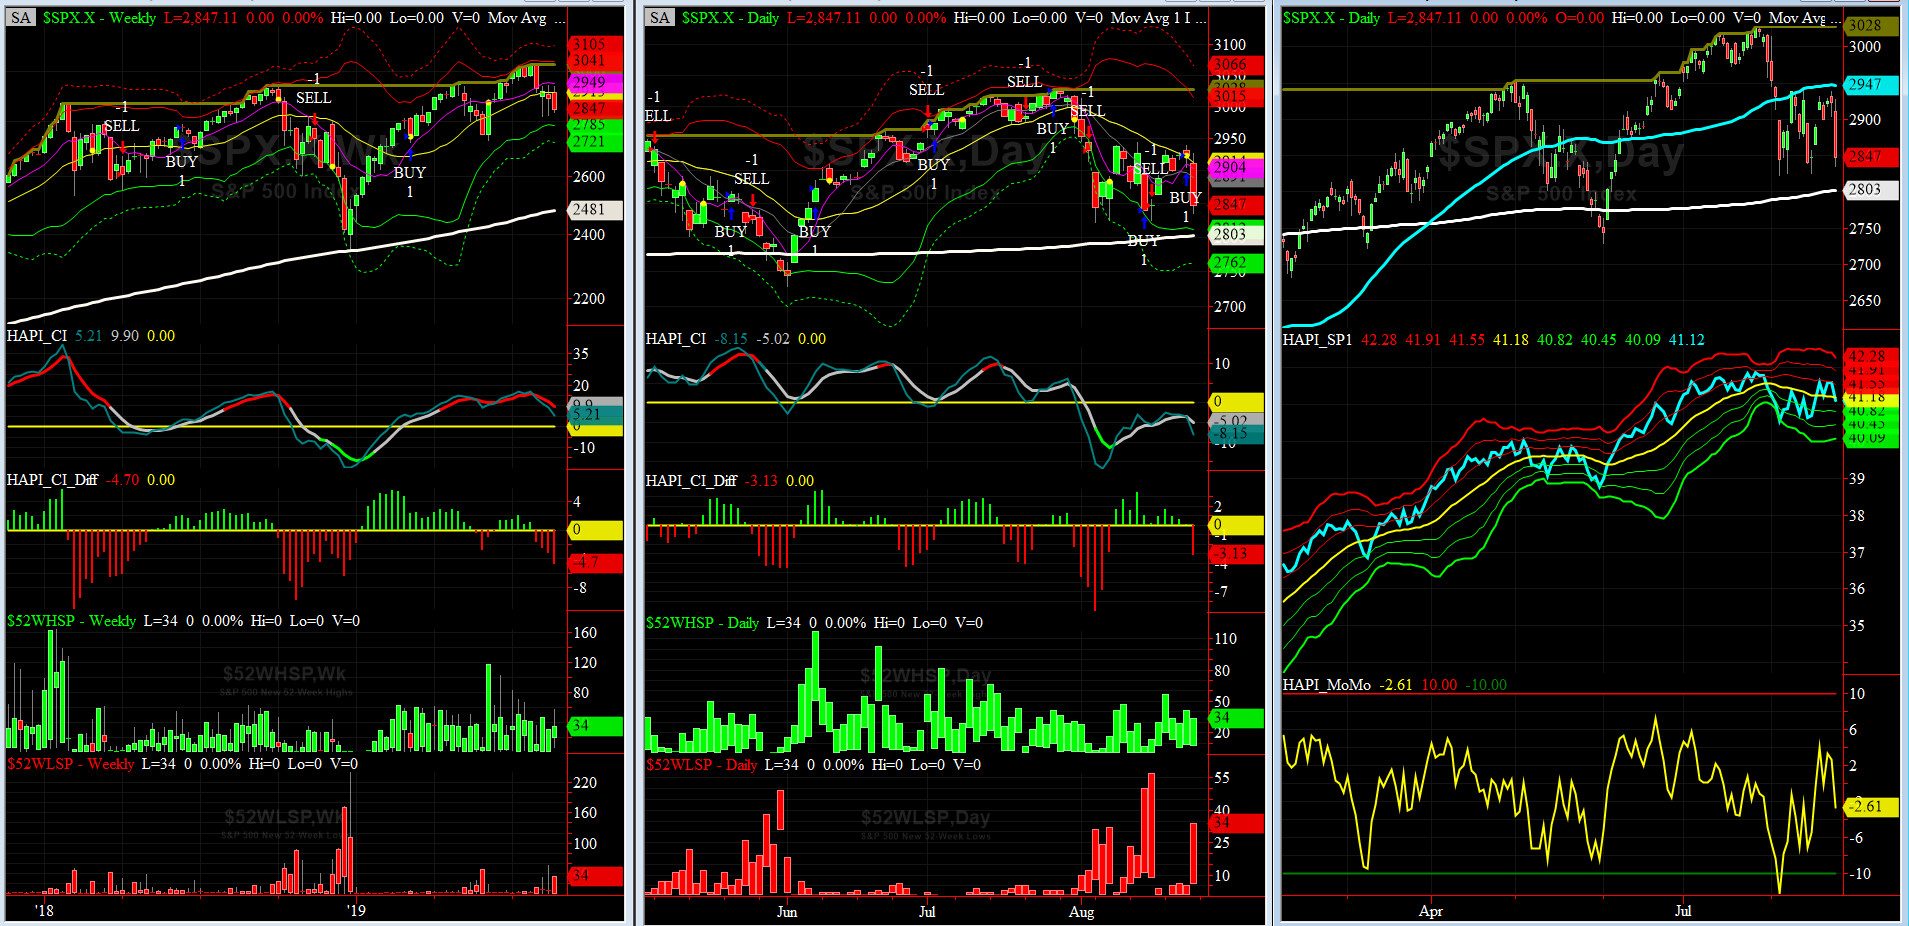
Most recent S&P-500 Cash Index (SPX) Close: 2847 down -42 (down -1.45%) for the four days ending on Friday, August 23, 2019, which closed a tad above its -1.5 sigma.
DJIA ALL TIME INTRADAY HIGH = 27398 (reached on Tuesday, July 16, 2019)
DJT ALL TIME INTRADAY HIGH = 11623 (reached on Friday, September 14, 2018)
SPX ALL TIME INTRADAY HIGH = 3028 (reached on Friday, July 26, 2019)
NDX ALL TIME INTRADAY HIGH = 8027 (reached on Friday, July 26, 2019)
RUT ALL TIME INTRADAY HIGH = 1742 (reached on Friday, August 31, 2018)
Current DAILY +2 Sigma SPX = 3015 with WEEKLY +2 Sigma = 3041
Current DAILY 0 Sigma SPX = 2914 with WEEKLY 0 Sigma = 2913
Current DAILY -2 Sigma SPX = 2812 with WEEKLY -2 Sigma = 2785
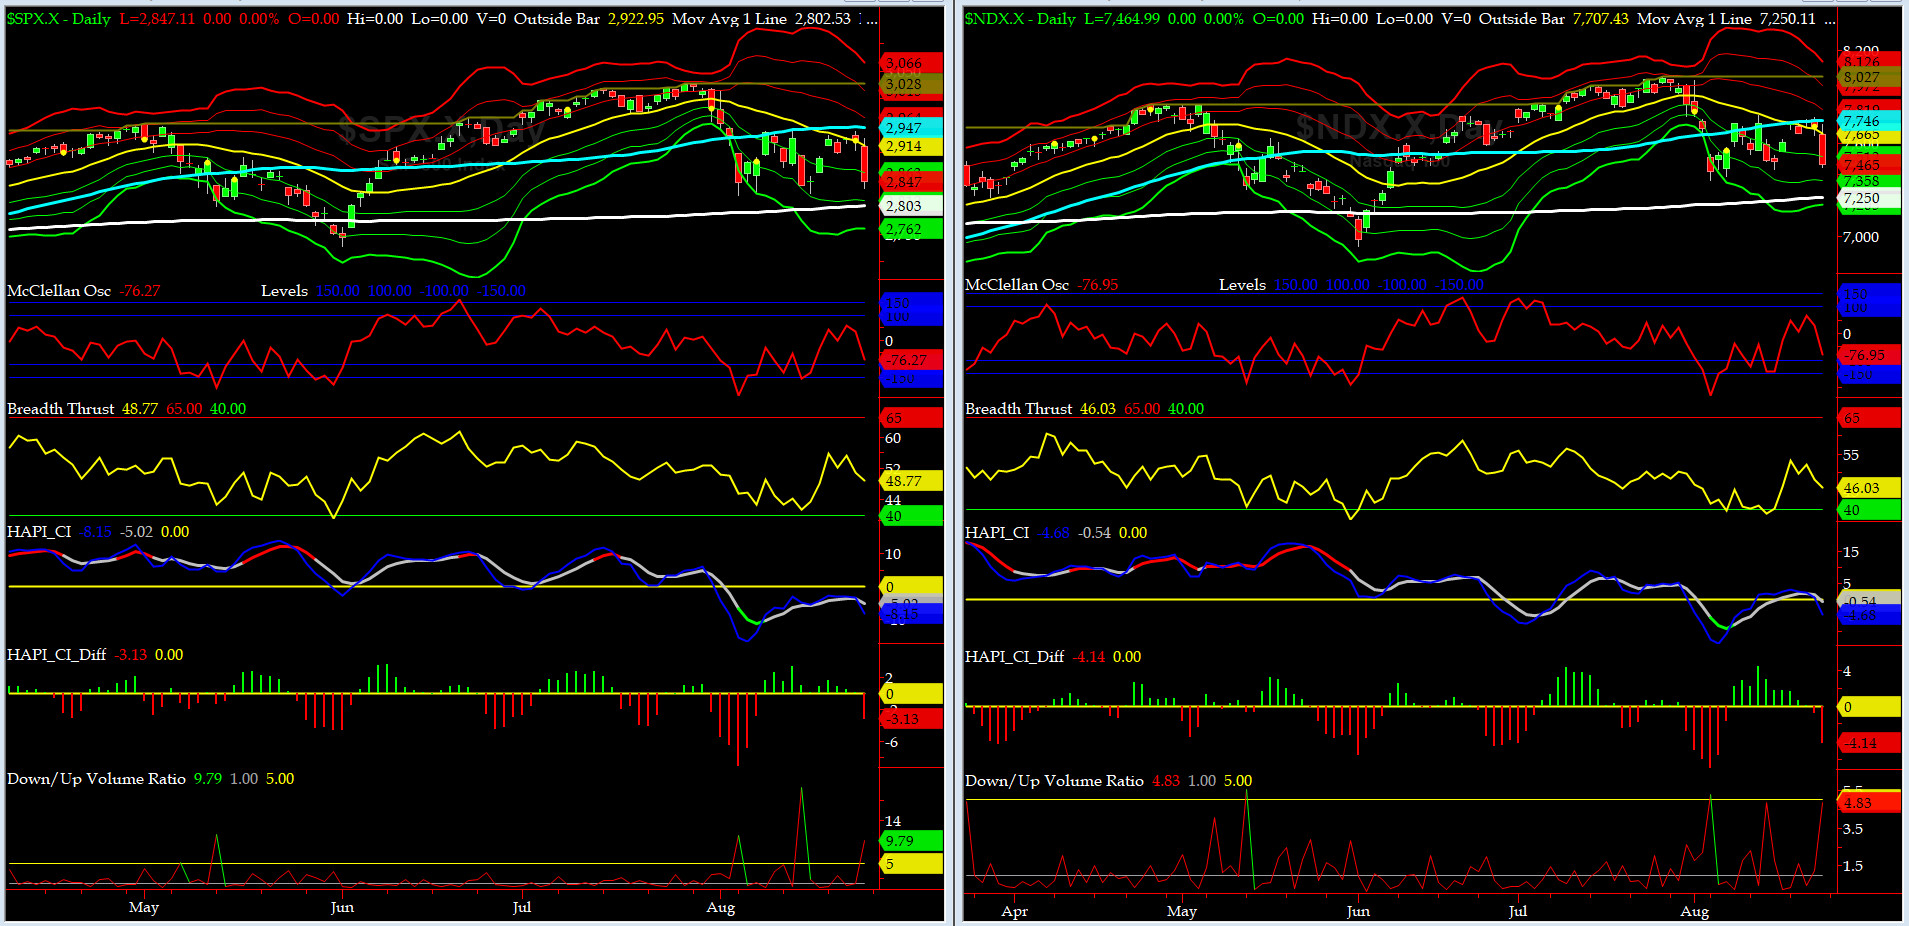
NYSE McClellan Oscillator = -76 (-150 is start of the O/S area; around -275 to -300 area or lower, we go into the �launch-pad� mode; over +150, we are in O/B area)
NYSE Breadth Thrust = 48.7 (40 is considered as oversold and 65 as overbought)
If you read our comments here last week and thought we were too harsh on Grumpino, we are confident by Friday, you could clearly see our point of view. These markets are getting unhinged.
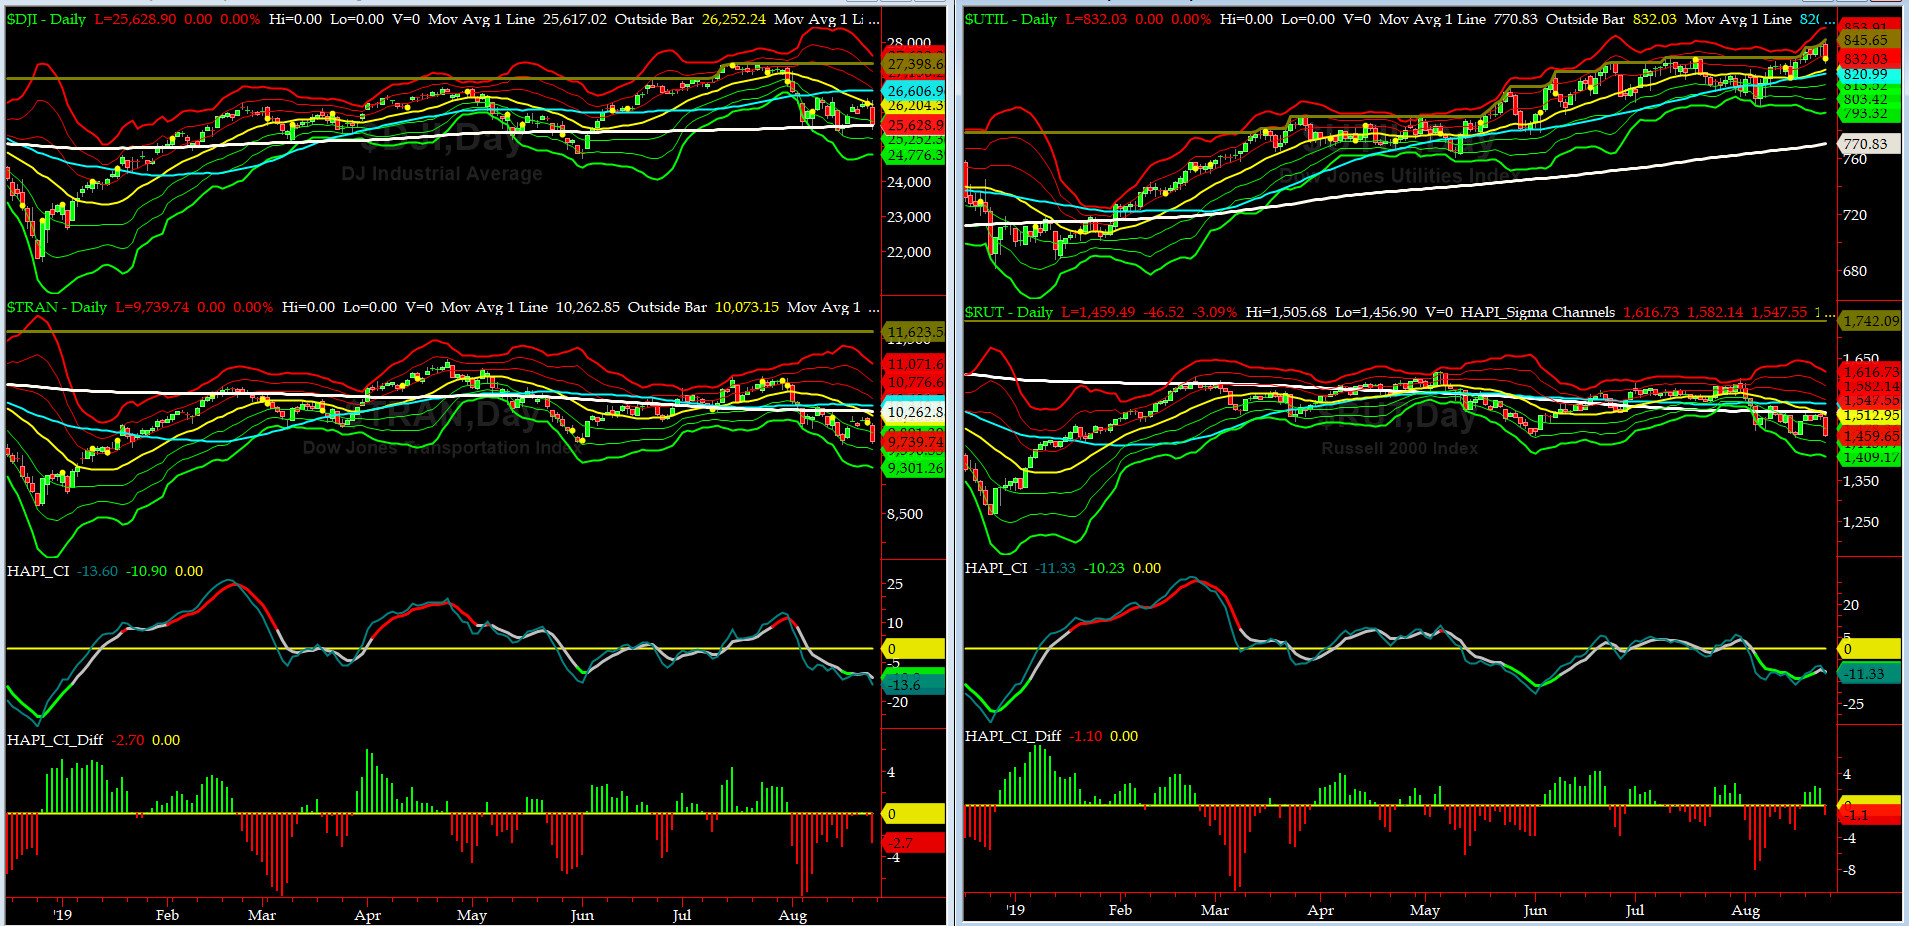
Canaries [in the Coal Mine] Chart for DJ TRAN & RUT Indices
200-Day MA DJ TRAN = 10,262 or 5.1% ABOVE DJ TRAN (max observed in last 7 yrs = 20.2%, min = -20.3%)
200-Day MA RUT = 1517 or 3.8% ABOVE RUT (max observed in last 7 yrs = 21.3%, min = -22.6%)
DJ Transportation Index (proxy for economic conditions 6 to 9 months hence) had a very tough day on Friday.
Russell 2000 Small Caps Index (proxy for Risk ON/OFF) ditto here and RISK is still OFF.
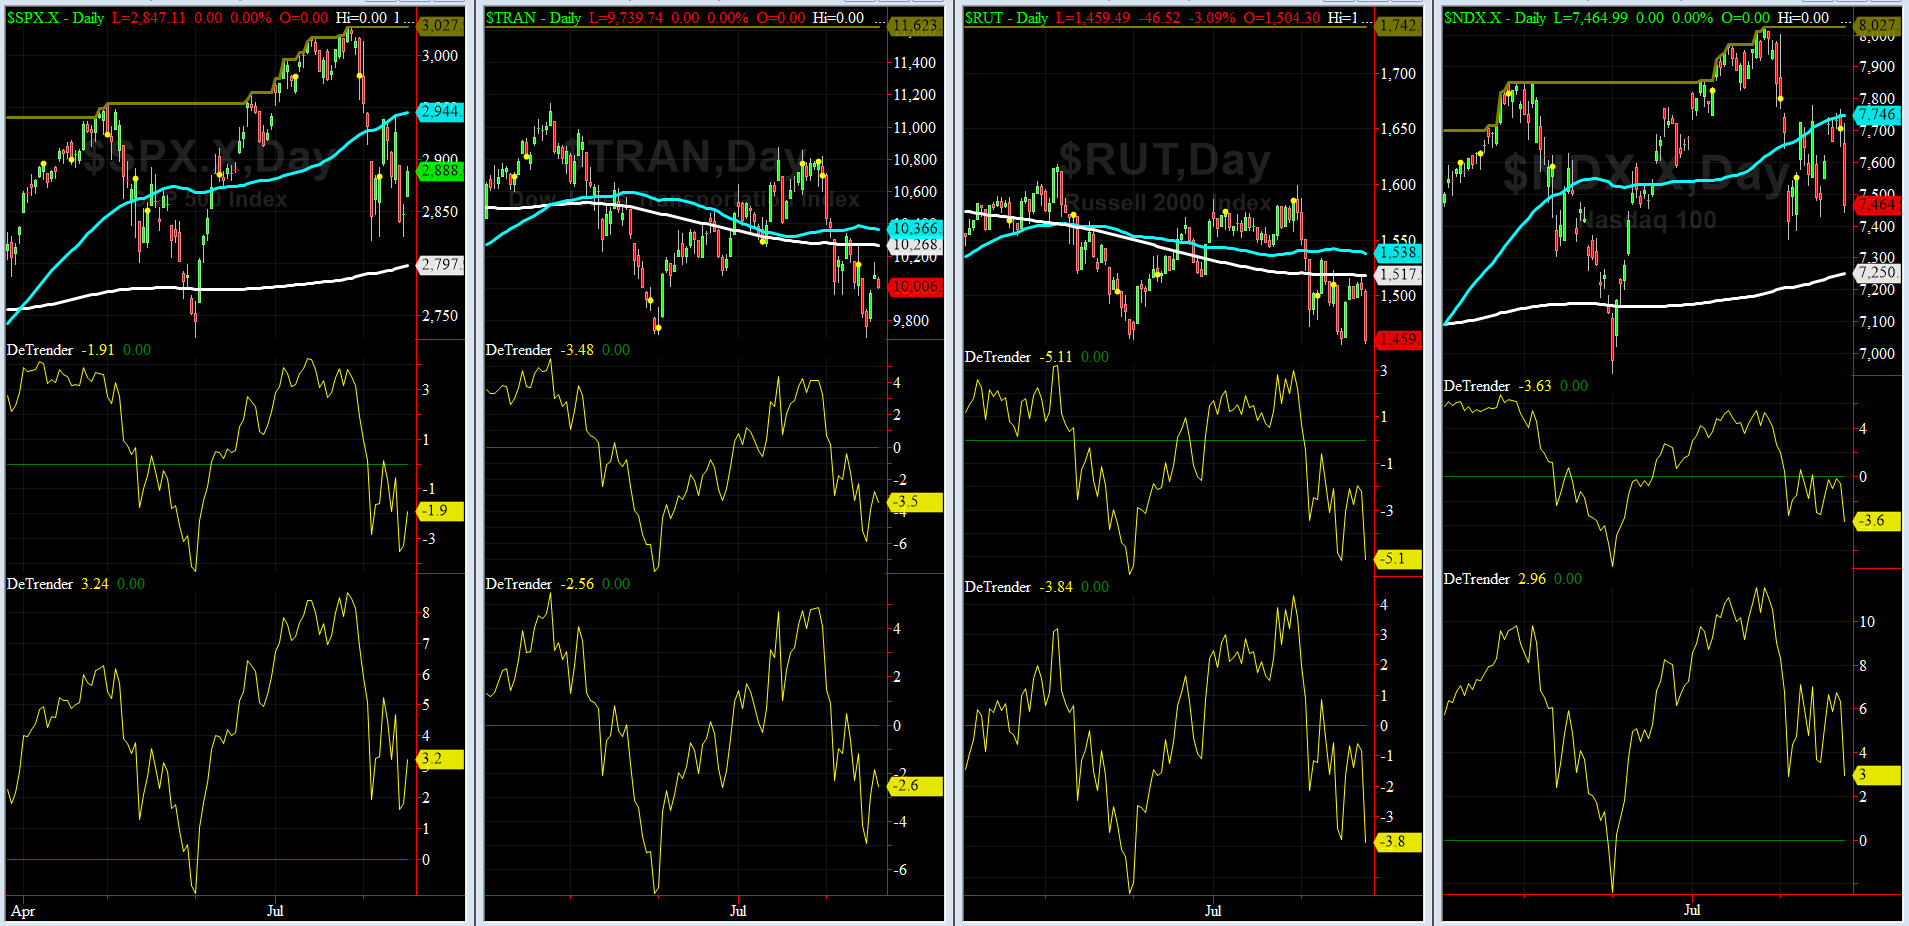
DeTrenders Charts for SPX, NDX, TRAN & RUT Indices
50-Day MA SPX = 2946 or 3.4% ABOVE SPX (max observed in last 7 yrs = +8.6%, min = -9.3%)
200-Day MA SPX = 2802 or 1.6% BELOW SPX (max observed in last 7 yrs = 15.2%, min = -14%)
SEVEN of our EIGHT DeTrenders are in the NEGTIVE territory. The DeTrenders for DJ Tran & RUT will continue to be harbingers of future price behavior in broad indices.
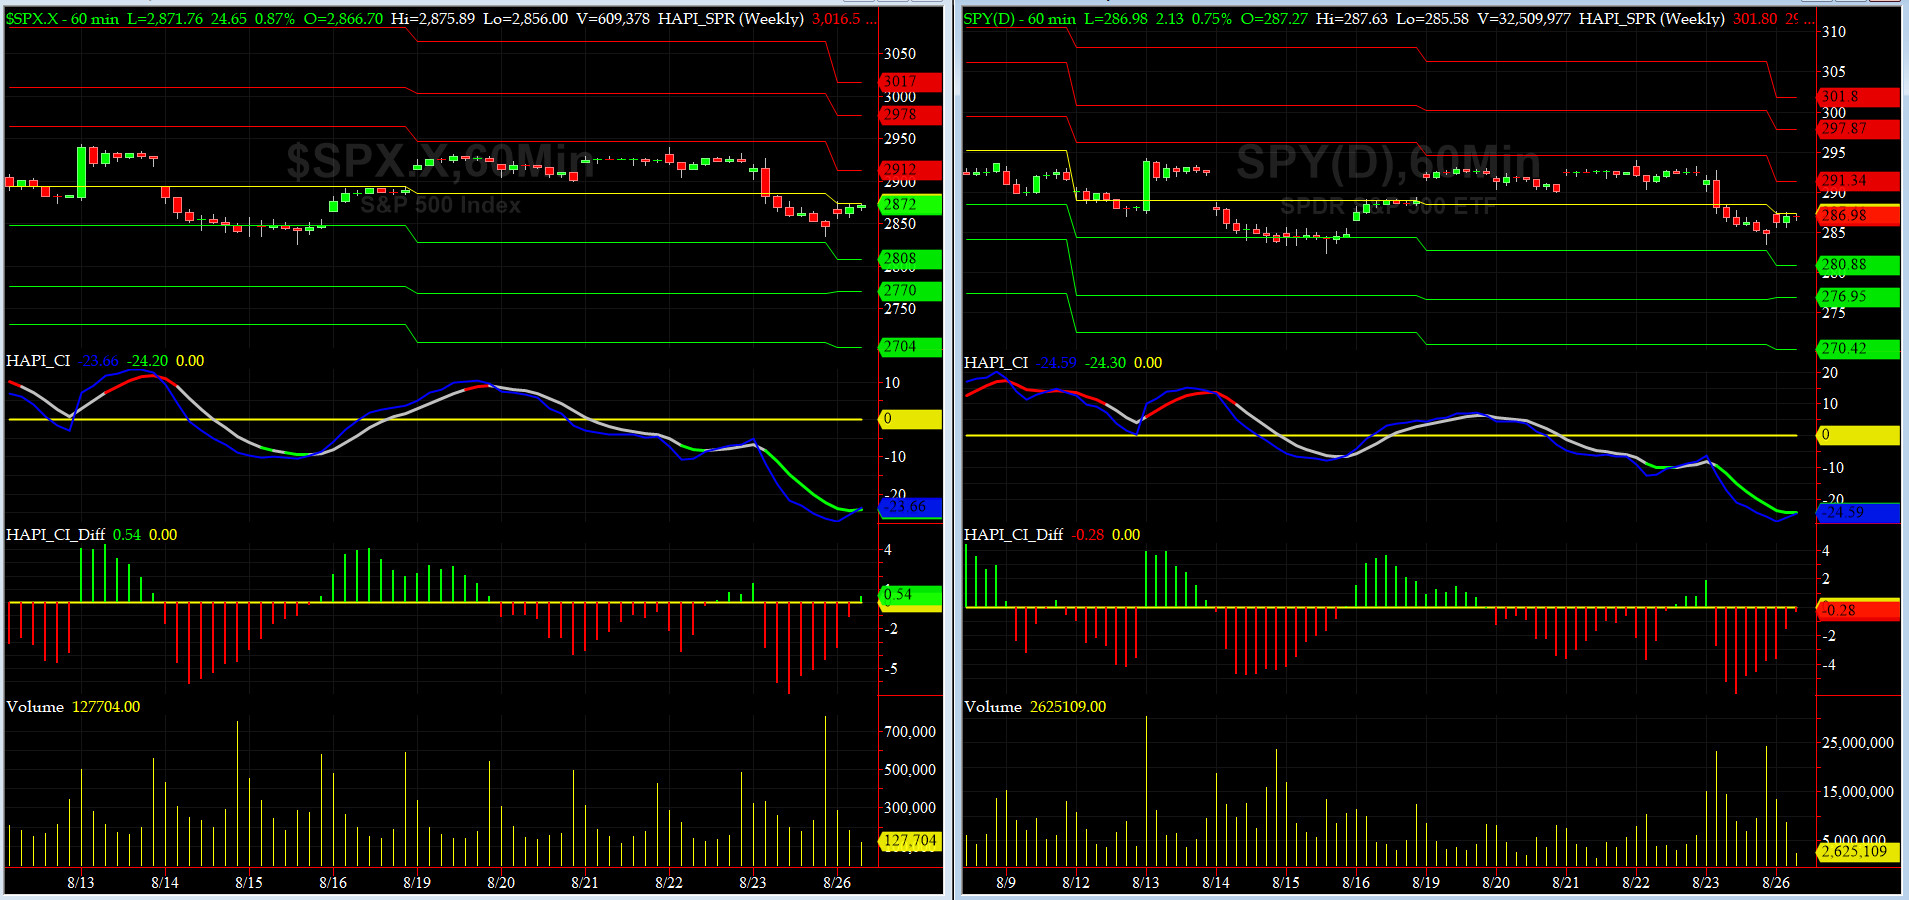
HA_SP1_Momo Chart
WEEKLY Timing Model = on a BUY Signal since Friday, March 8, 2019 CLOSE at 2743
DAILY Timing Model = on a BUY Signal since Thursday, August 22, 2019 CLOSE at 2922
Max SPX 52wk-highs reading last week = 57 (over 120-140, the local maxima is in)
Max SPX 52wk-Lows reading last week = 34 (over 40-60, the local minima is in)
HA_SP1 closed near its zero sigma channels
HA_Momo = -2.61 (reversals most likely occur above +10 or below -10)
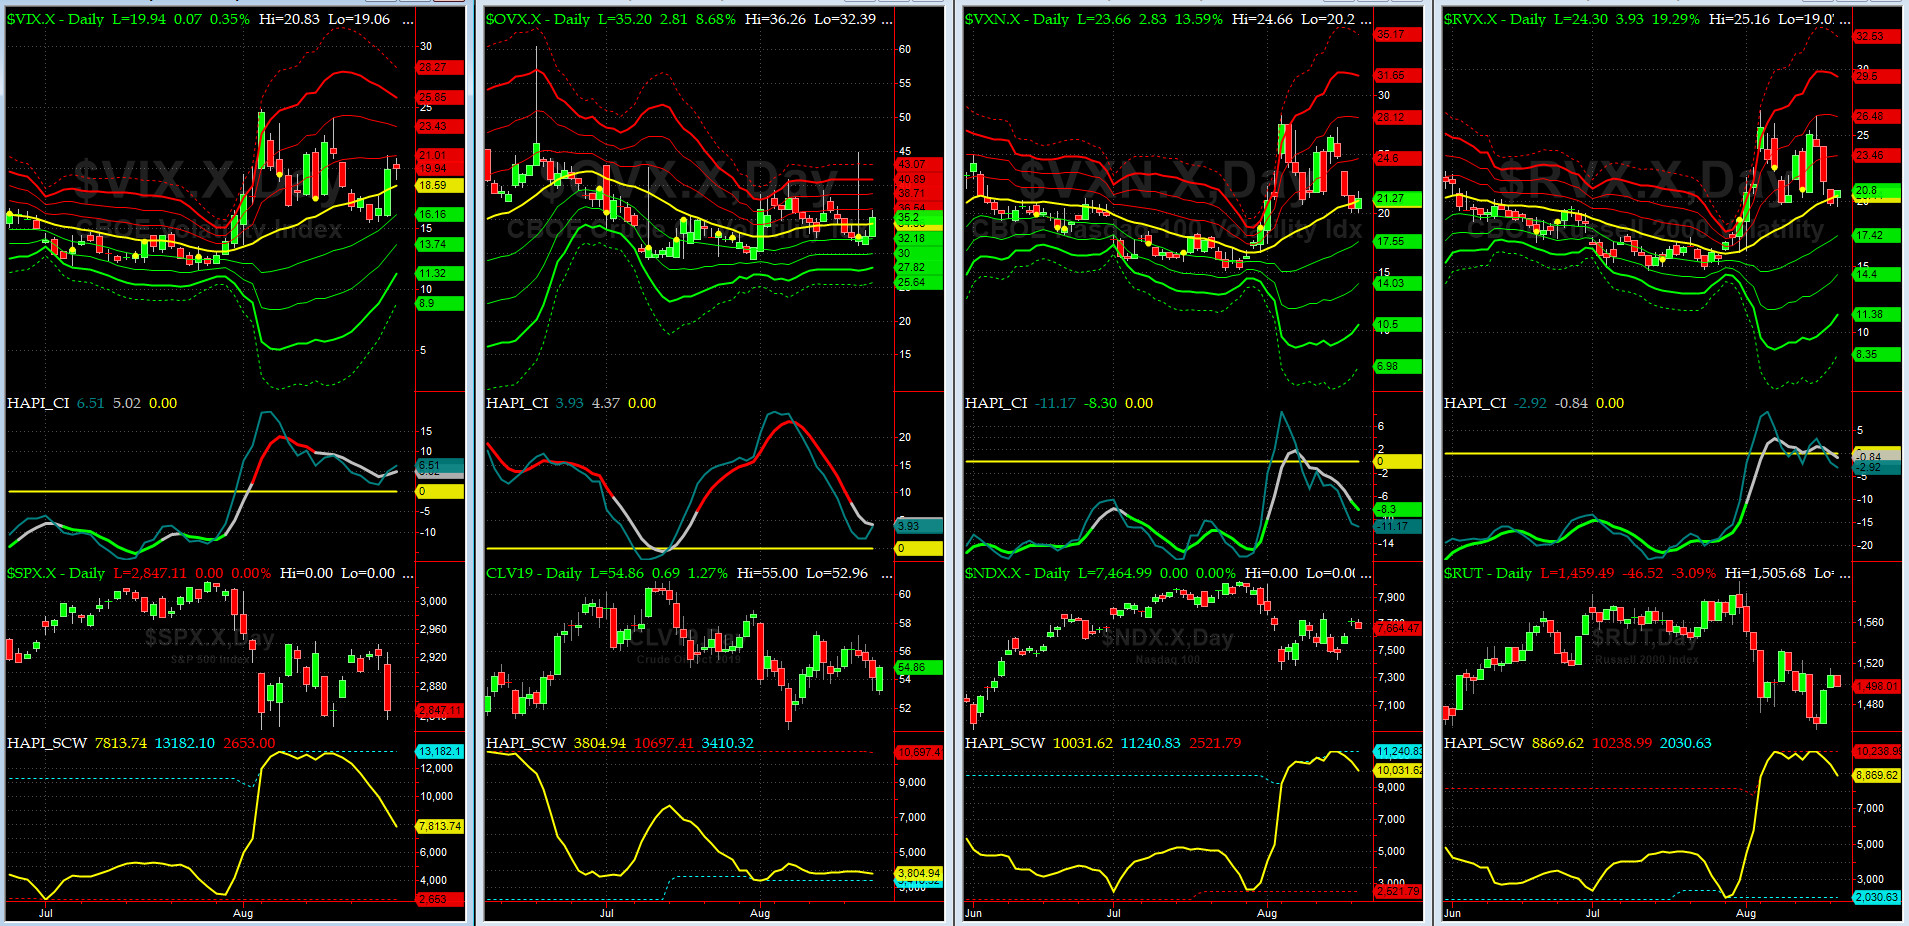
Vol of the Vols Chart
Spot VIX stood at 19.9 on Friday night, a tad below its +1 sigma (remember it's the VIX volatility pattern aka "its sigma channels" that matters, and not the level of VIX itself (this is per Dr. Robert Whaley, a great mentor and inventor of original VIX, now called VXO). VIX usually peaks around a test of its +4 sigma).
Last week VIX had a wild ride, thanks to Grumpino !!

5-day TRIN & TRINQ Charts
NYSE 5-day TRIN is back up near the BUY zone while NASDAQ 5-day TRINQ is still in the NEUTRAL zone.
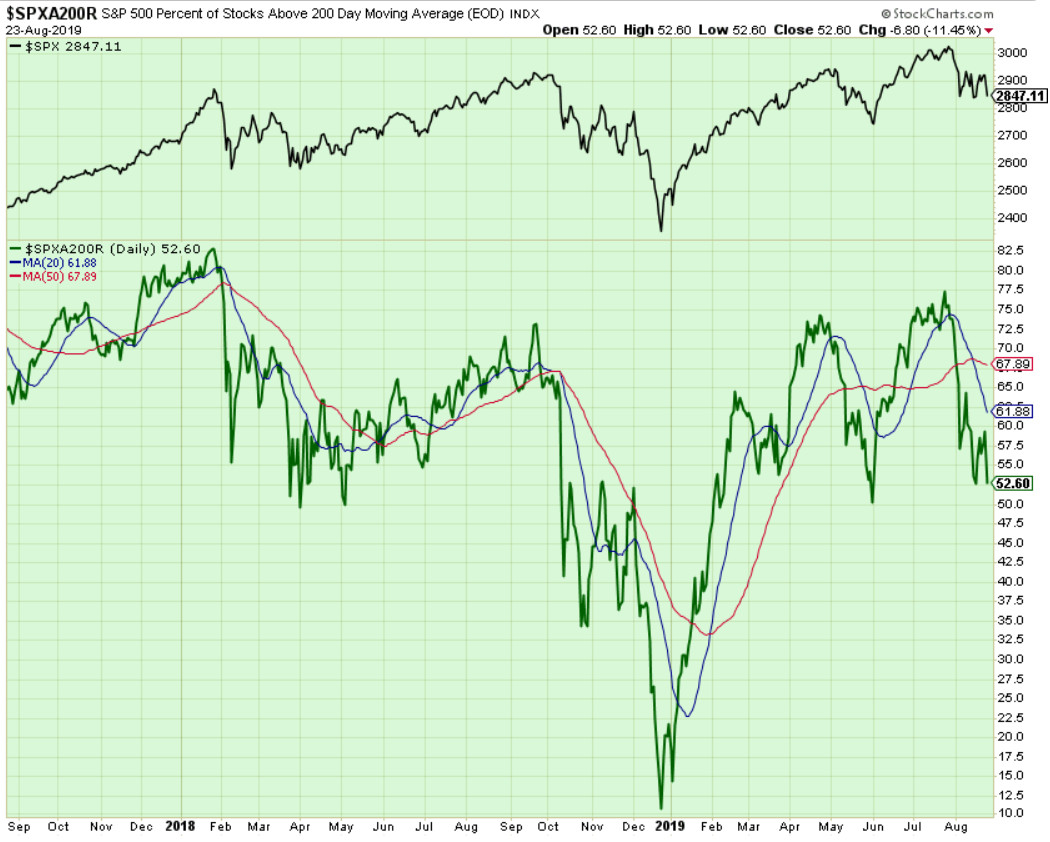
Components of SPX above their respective 200-day MA Chart
This scoring indicator punched thru 55% and almost tested 60% before closing at 52.6% on Friday night......We need to keep a close eye on this indicator this week as a move below 50% is a big issue for the Longs.
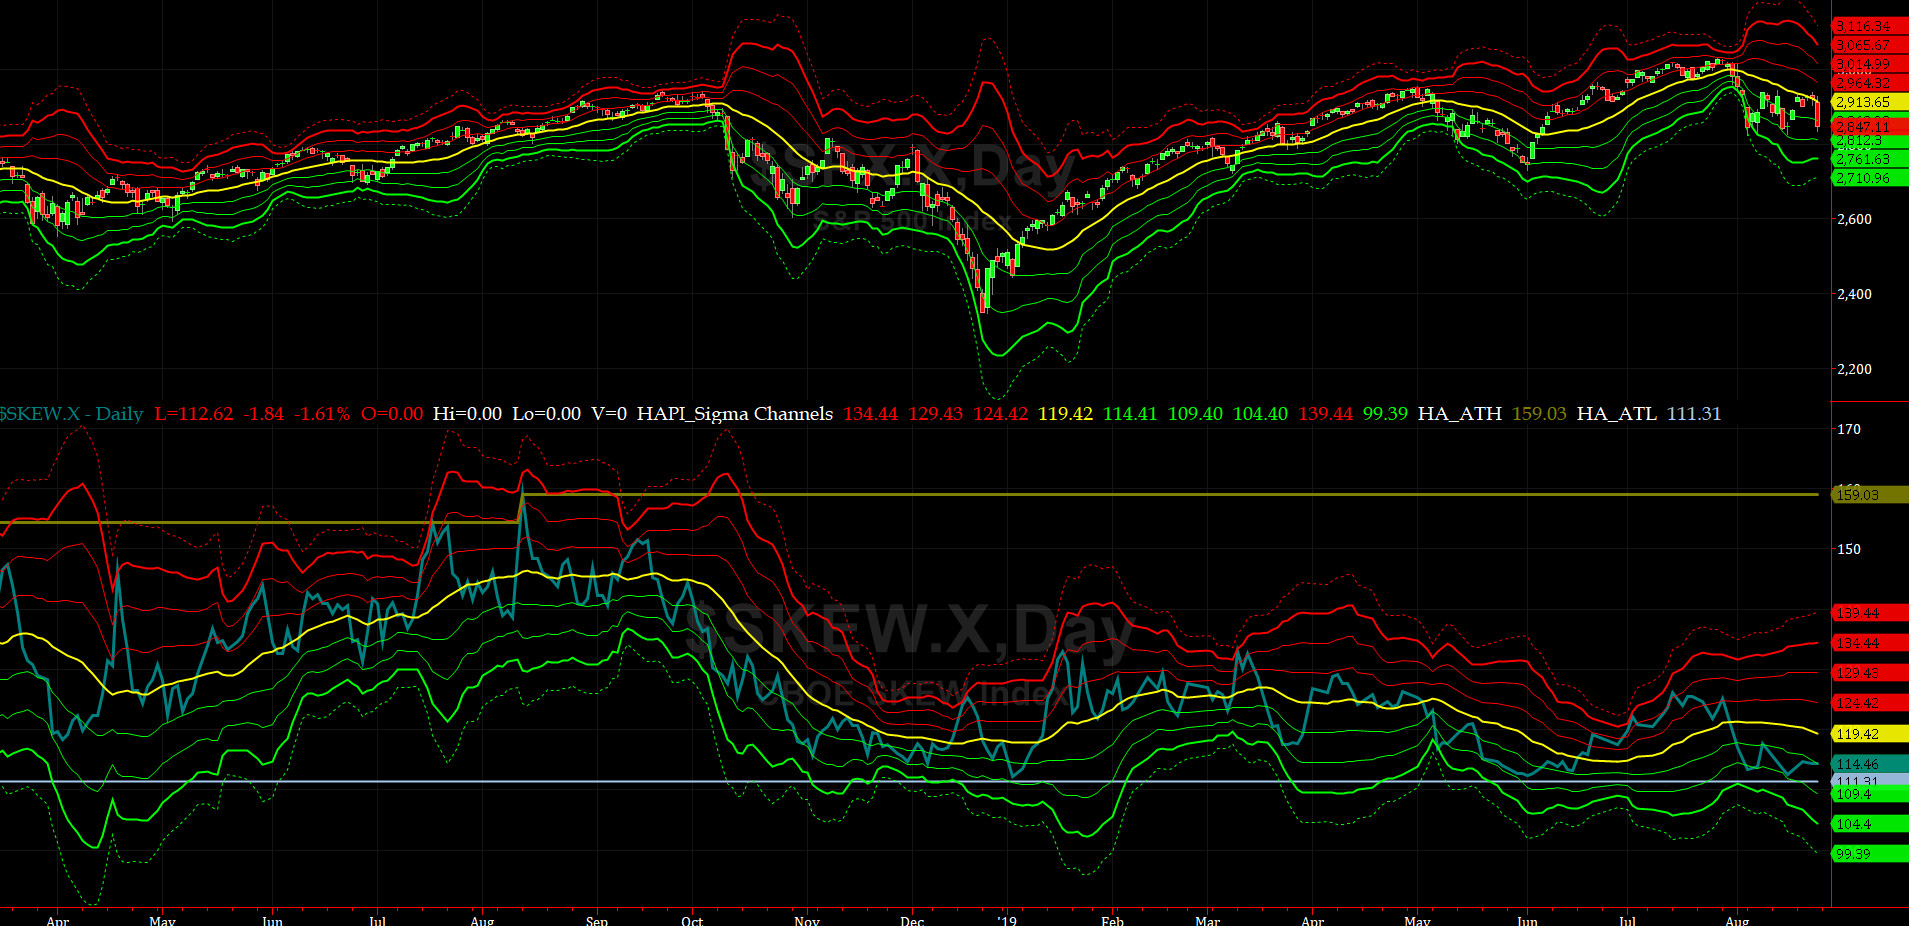
SPX SKEW (Downside Tail Risk) Chart
On Friday, SPX SKEW (Downside Tail Risk) rose pretty sharply to 114.5, now about its -1 sigma (normal = 115, range 100-150).
All quiet on the Eastern & Mid-Western Fronts? our beloved HRH Capt. Tiko, KCPE, still says NOPE.
How to interpret the value of SPX SKEW? (from CBOE white paper on SKEW)

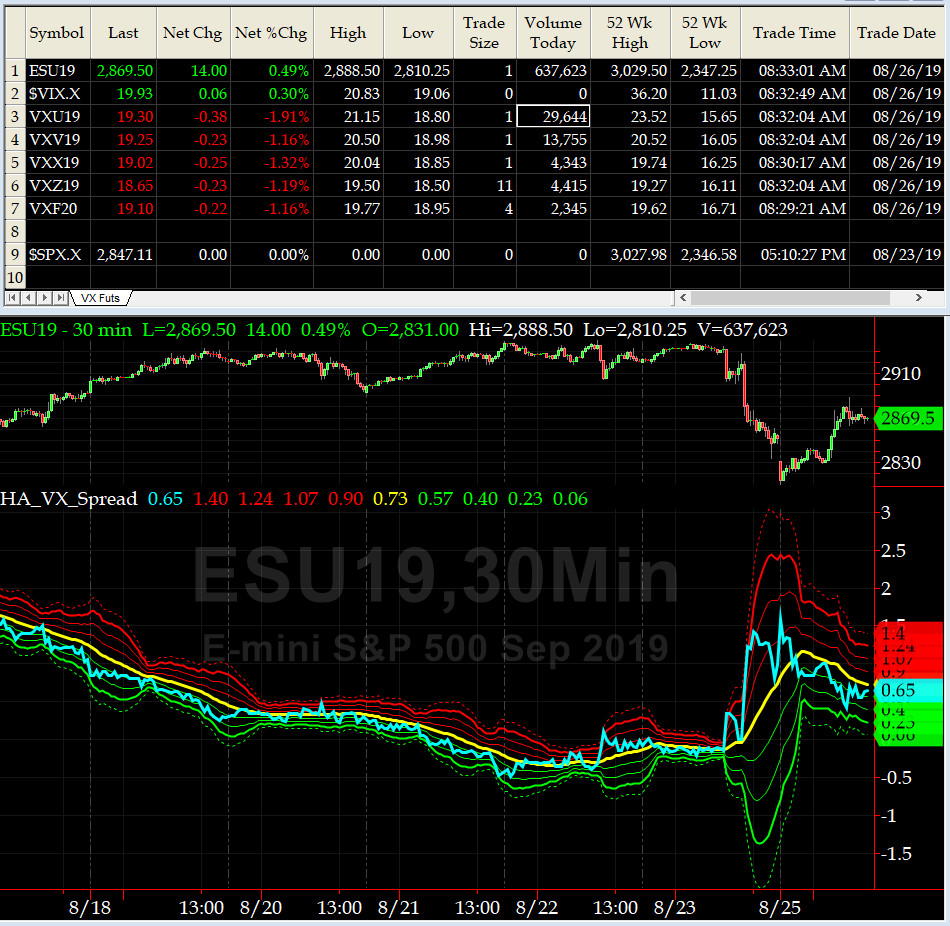
3-month VIX Futures Spread(VX) Chart
This popular timing indicator for identifying tradable bottoms, (now long SEP19, & short DEEZ19 VIX Futures) hit +0.99 on Friday Close. That is signaling a tradable bottom on Friday. Again, with Grumpino's erratic behavior, you never know.
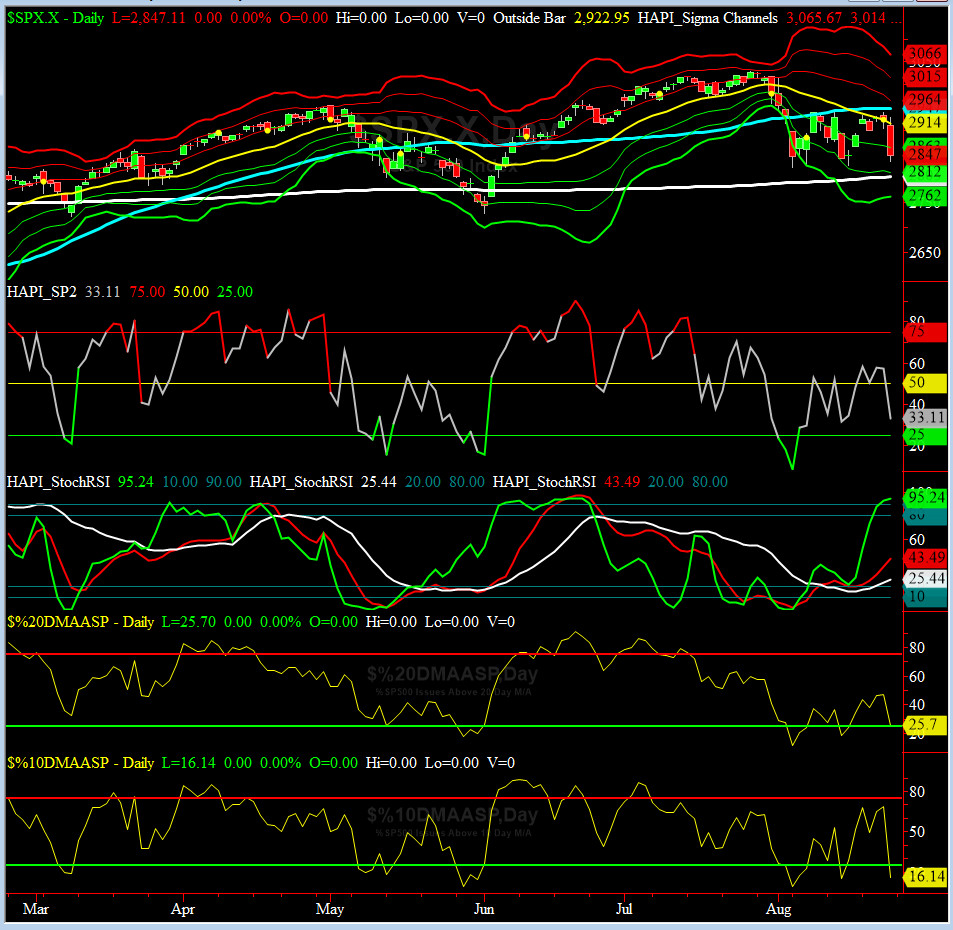
HA_SP2 Chart
HA_SP2 = 33.1 (Buy signal <= 25, Sell Signal >= 75)
This is a NEUTRAL reading here.
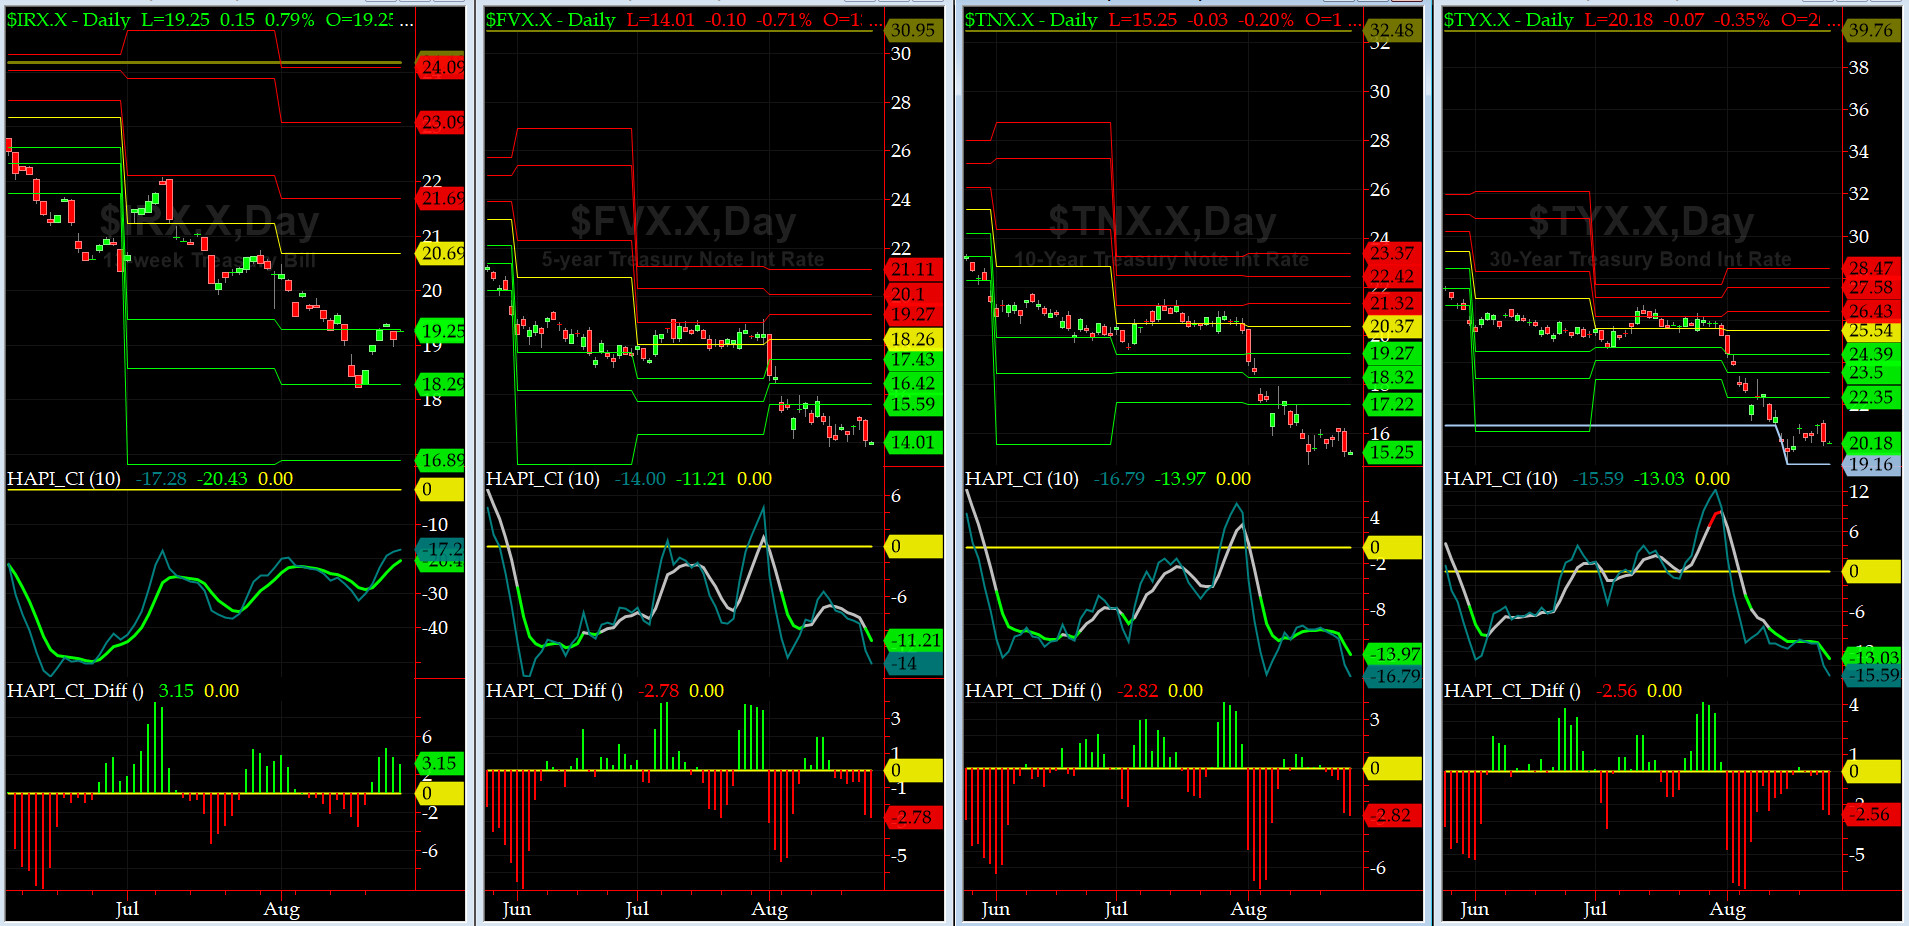
US Treasury T-Notes & T-Bonds Yields Chart
Front end of the Yield Curve held steady while back-end sold off more. with inversion like this, next recession should be around corner.
Fari Hamzei
|


 Proactive Market Timing