|
Monday, September 9, 2019, 0845ET
Market Timing Charts, Analysis & Commentary for Issue #305
Timer Charts of S&P-500 Cash Index (SPX) + NASDAQ-100 Cash Index (NDX)
Most recent S&P-500 Cash Index (SPX) Close: 2978 up +131 (up +4.6%) for the two weeks ending on Friday, September 6, 2019, which closed at its +2 sigma.
DJIA ALL TIME INTRADAY HIGH = 27398 (reached on Tuesday, July 16, 2019)
DJT ALL TIME INTRADAY HIGH = 11623 (reached on Friday, September 14, 2018)
SPX ALL TIME INTRADAY HIGH = 3028 (reached on Friday, July 26, 2019)
NDX ALL TIME INTRADAY HIGH = 8027 (reached on Friday, July 26, 2019)
RUT ALL TIME INTRADAY HIGH = 1742 (reached on Friday, August 31, 2018)
Current DAILY +2 Sigma SPX = 2980 with WEEKLY +2 Sigma = 3049
Current DAILY 0 Sigma SPX = 2905 with WEEKLY 0 Sigma = 2918
Current DAILY -2 Sigma SPX = 2831 with WEEKLY -2 Sigma = 2787
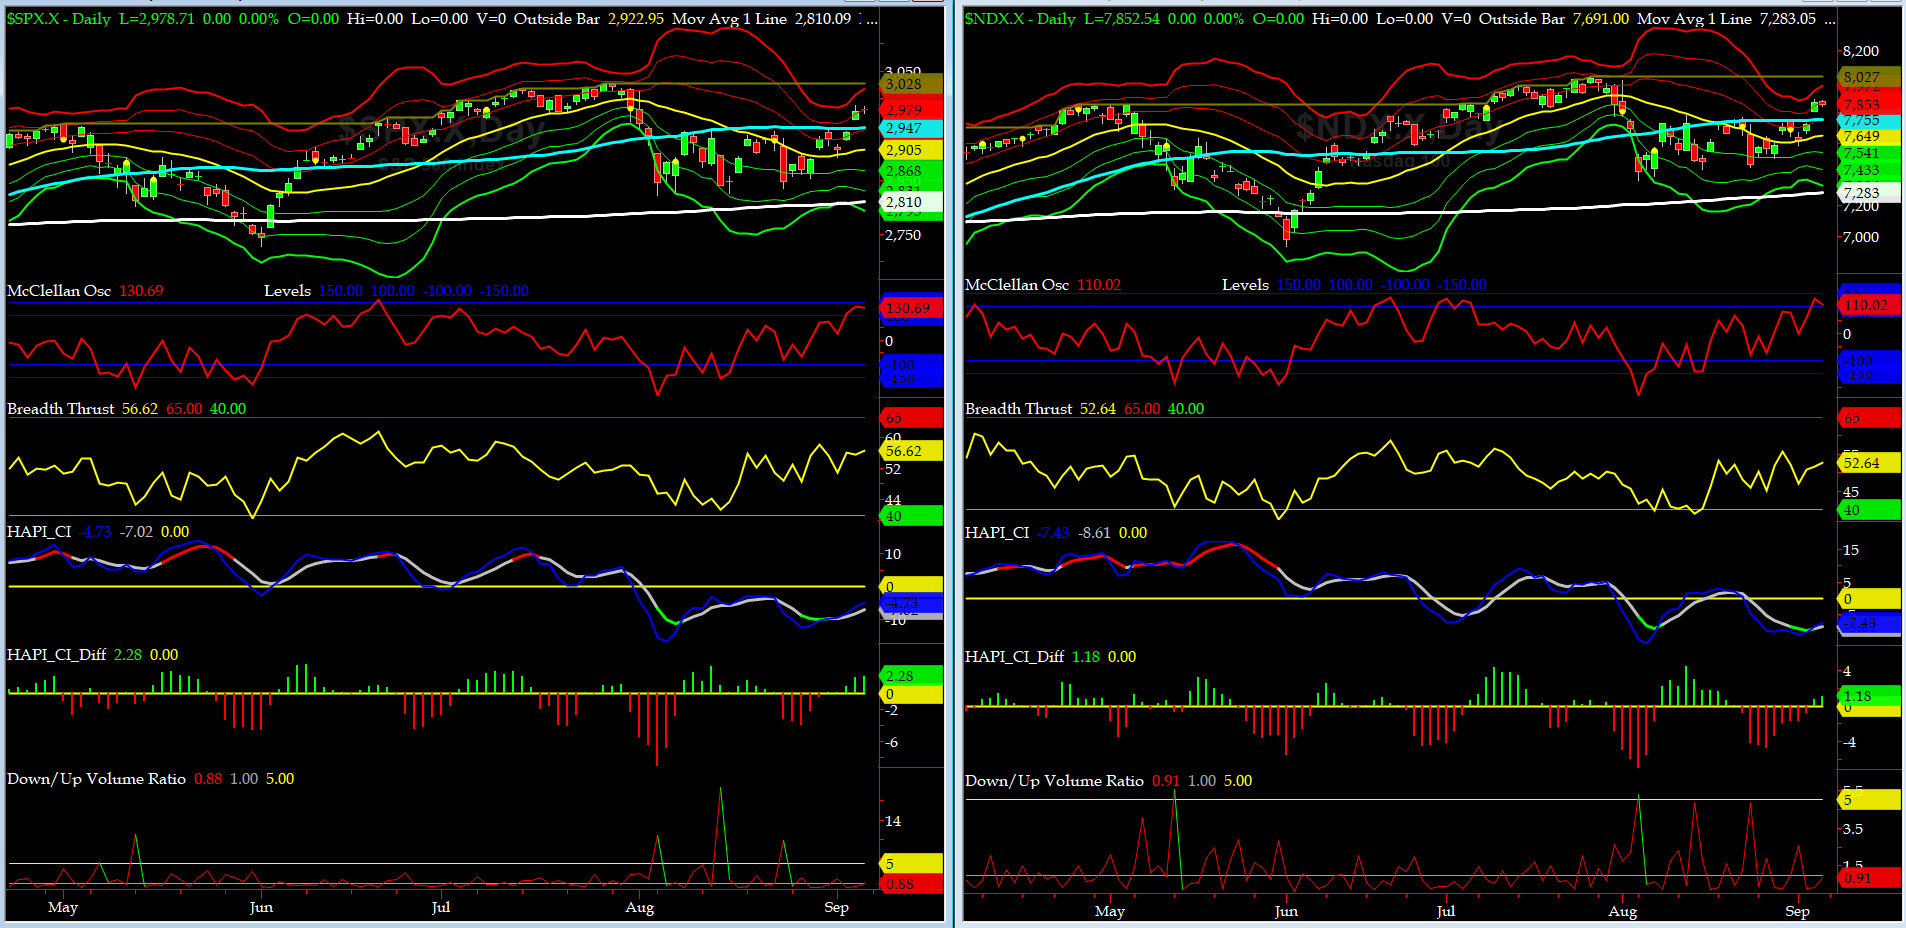
NYSE McClellan Oscillator = +130 (-150 is start of the O/S area; around -275 to -300 area or lower, we go into the �launch-pad� mode; over +150, we are in O/B area)
NYSE Breadth Thrust = 56.6 (40 is considered as oversold and 65 as overbought)
We see GS paw prints all over this market: someone got to Grumpino, he changed his tune on the trade war with China. And since for his entertainment, he craves on controversies (Roy Cohn 101) he picked on NOAA and HRC. SharpieGate is here.
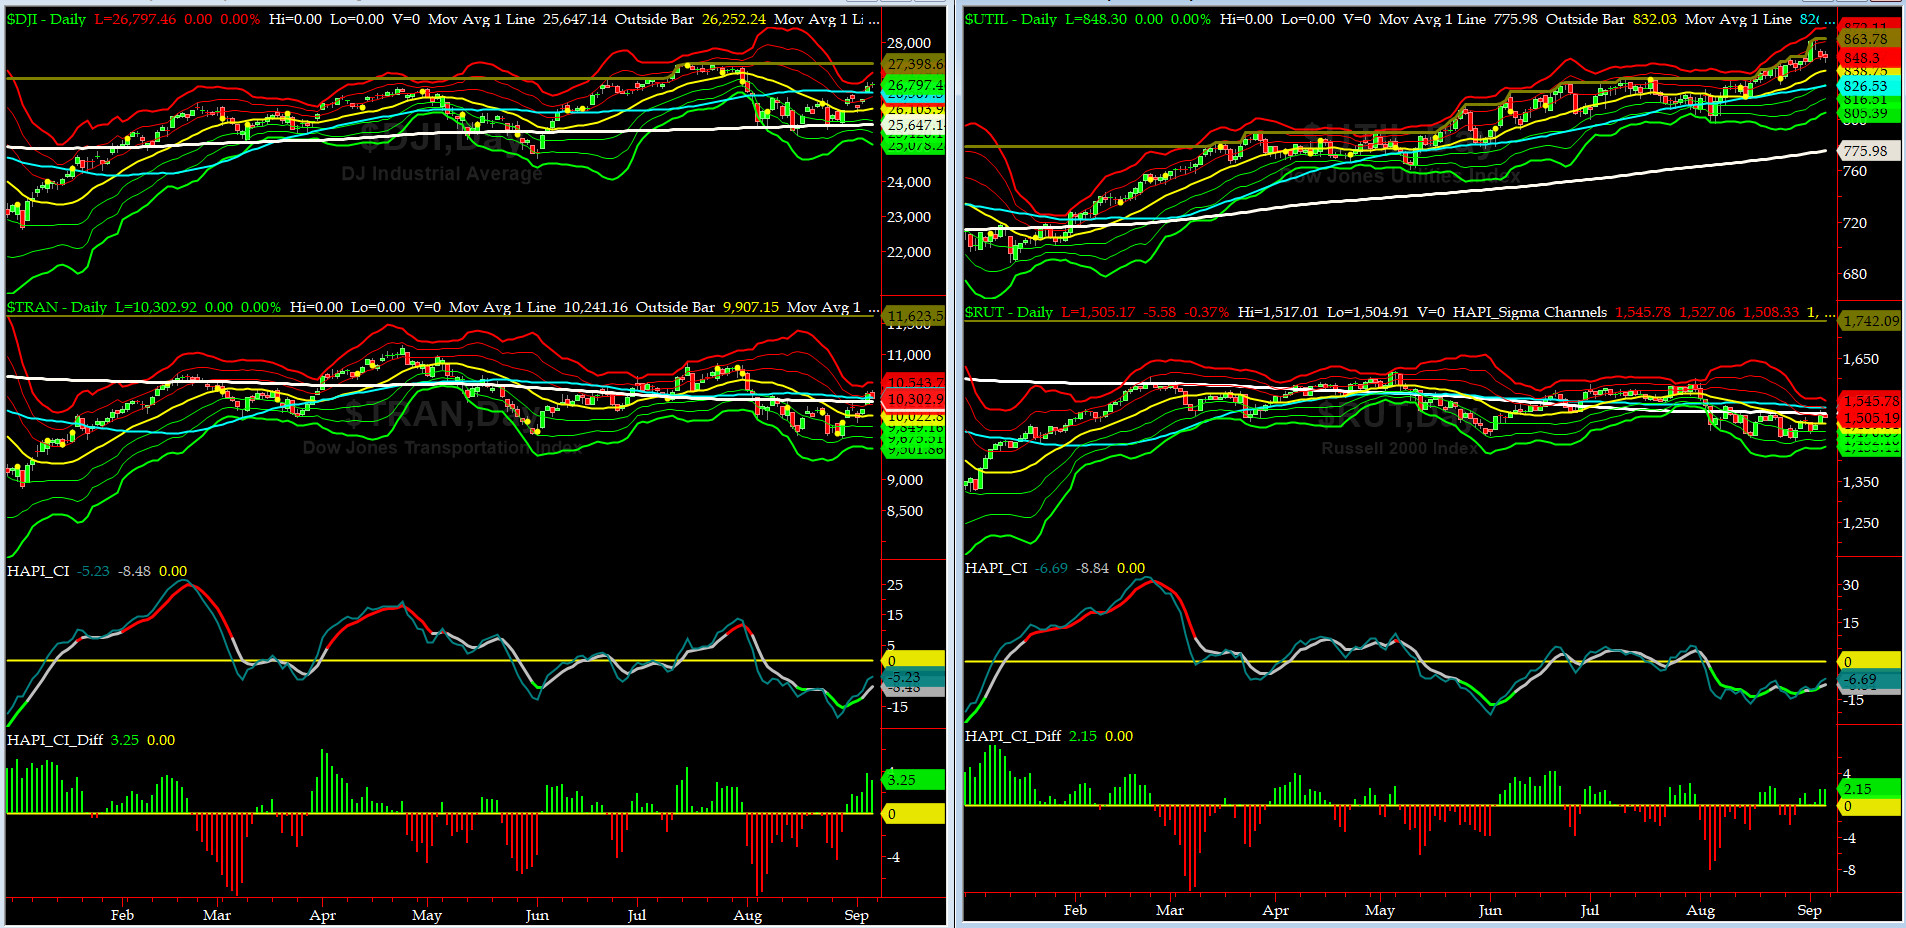
Canaries [in the Coal Mine] Chart for DJ TRAN & RUT Indices
200-Day MA DJ TRAN = 10,241 or 0.6 BELOW DJ TRAN (max observed in last 7 yrs = 20.2%, min = -20.3%)
200-Day MA RUT = 1512 or 0.1% ABOVE RUT (max observed in last 7 yrs = 21.3%, min = -22.6%)
DJ Transportation Index (proxy for economic conditions 6 to 9 months hence) had a very tough day on Friday.
Russell 2000 Small Caps Index (proxy for Risk ON/OFF) ditto here and RISK is still OFF.

DeTrenders Charts for SPX, NDX, TRAN & RUT Indices
50-Day MA SPX = 2947 or 1.2% BELOW SPX (max observed in last 7 yrs = +8.6%, min = -9.3%)
200-Day MA SPX = 2811 or 6.1% BELOW SPX (max observed in last 7 yrs = 15.2%, min = -14%)
ONLY FIVE of our EIGHT DeTrenders are in the POSITIVE territory. The DeTrenders for DJ Tran & RUT will continue to be harbingers of future price behavior in broad indices.

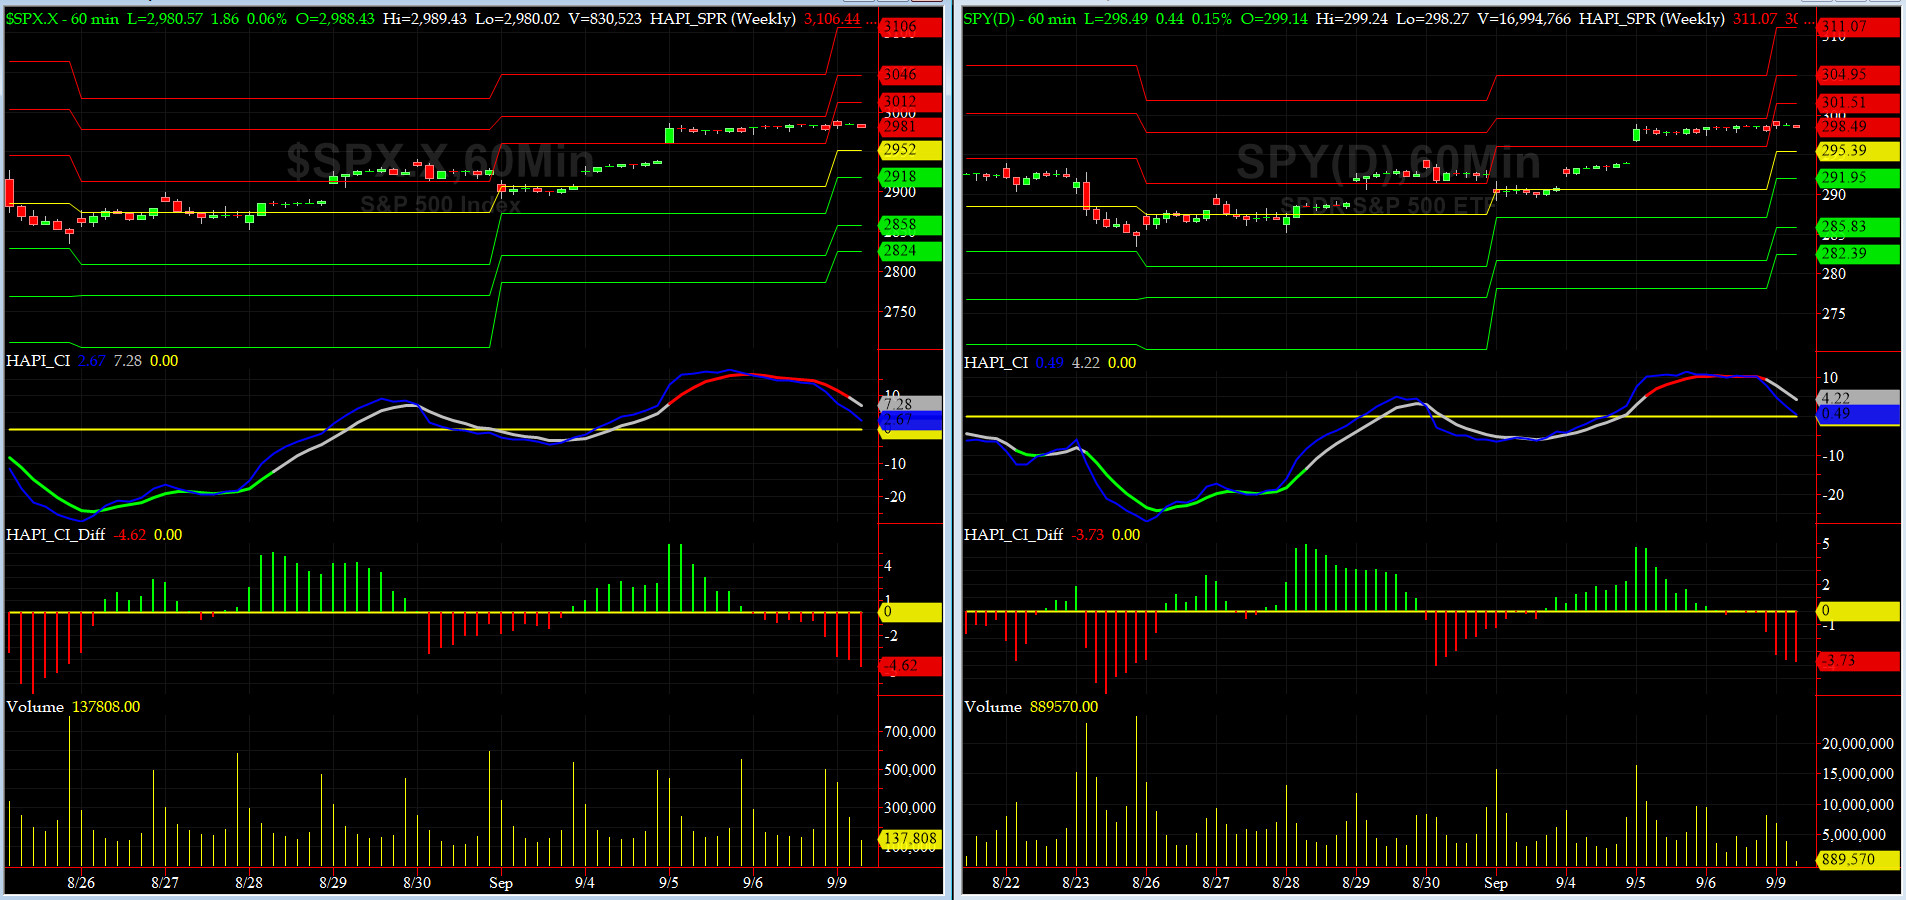
HA_SP1_Momo Chart
WEEKLY Timing Model = on a BUY Signal since Friday, March 8, 2019 CLOSE at 2743
DAILY Timing Model = on a BUY Signal since Tuesday, September 3, 2019 CLOSE at 2906
Max SPX 52wk-highs reading last week = 67 (over 120-140, the local maxima is in)
Max SPX 52wk-Lows reading last week = 10 (over 40-60, the local minima is in)
HA_SP1 closed near its +2 sigma channels
HA_Momo = +7.8 (reversals most likely occur above +10 or below -10)
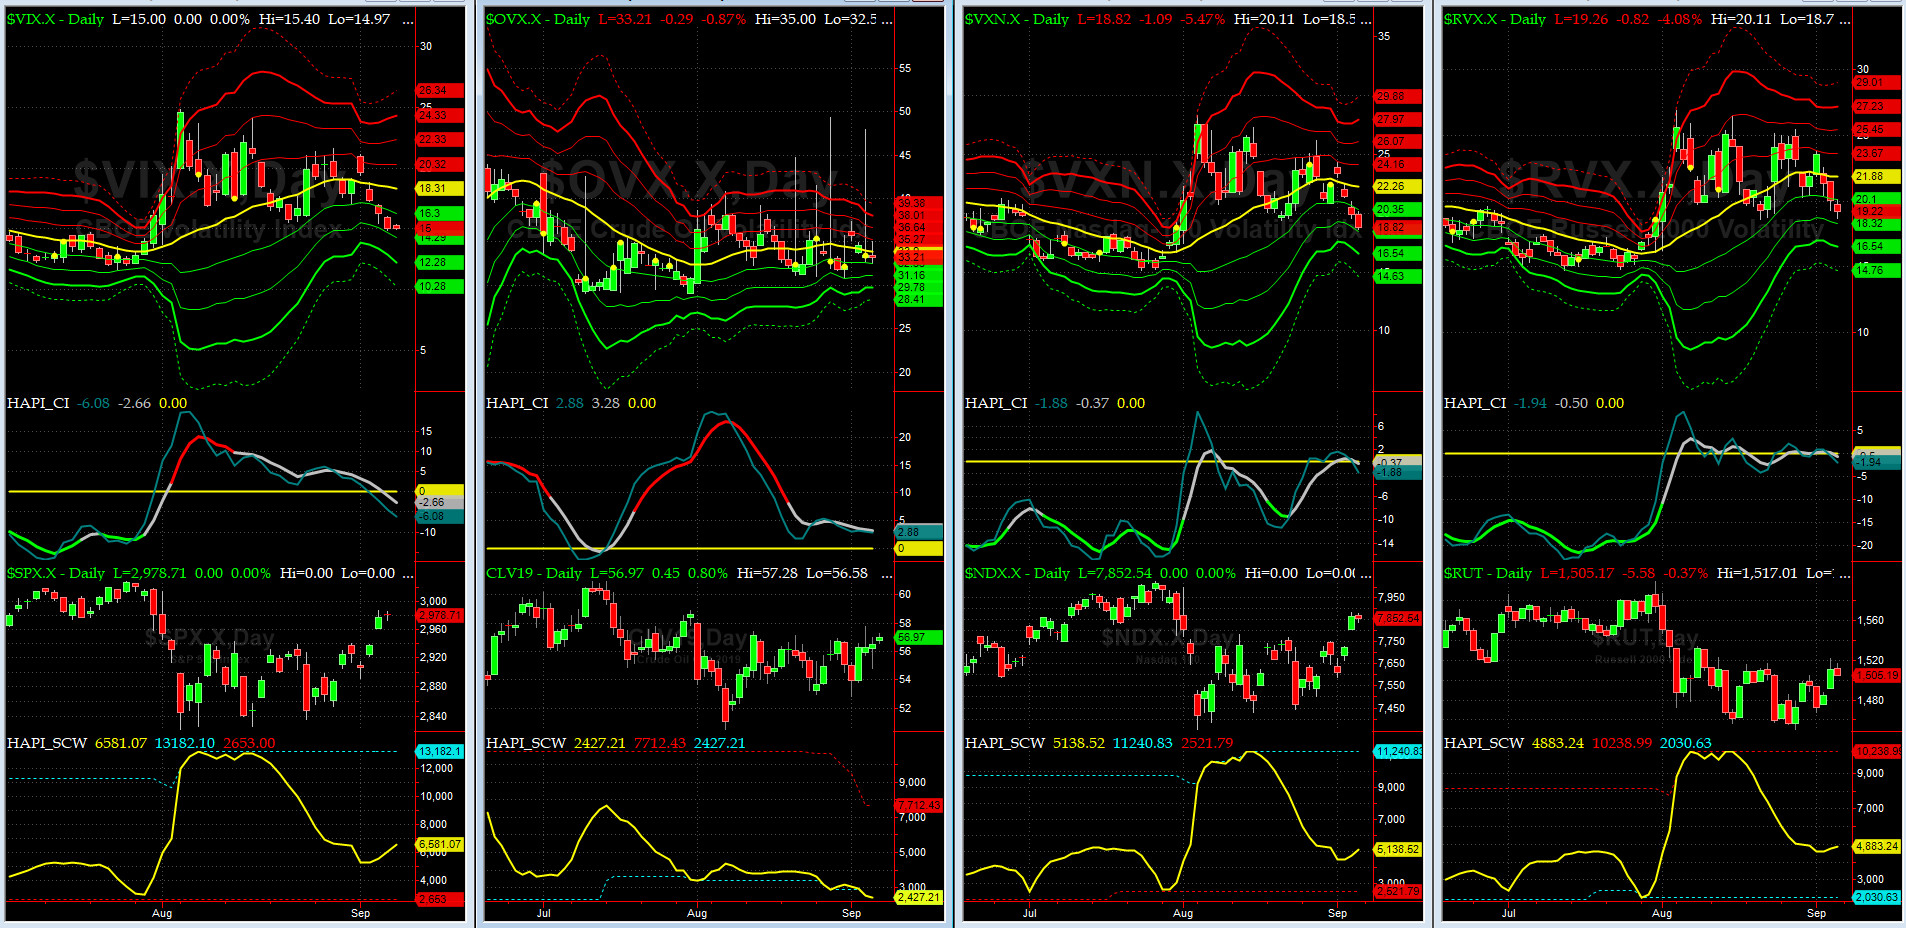
Vol of the Vols Chart
Spot VIX stood at 15 on Friday night, a tad below its -2 sigma (remember it's the VIX volatility pattern aka "its sigma channels" that matters, and not the level of VIX itself (this is per Dr. Robert Whaley, a great mentor and inventor of original VIX, now called VXO). VIX usually peaks around a test of its +4 sigma).
Last two weeks markets and VIX have had a wild ride. Daytraders, please send in your thanks by a tweet to Grumpino !!
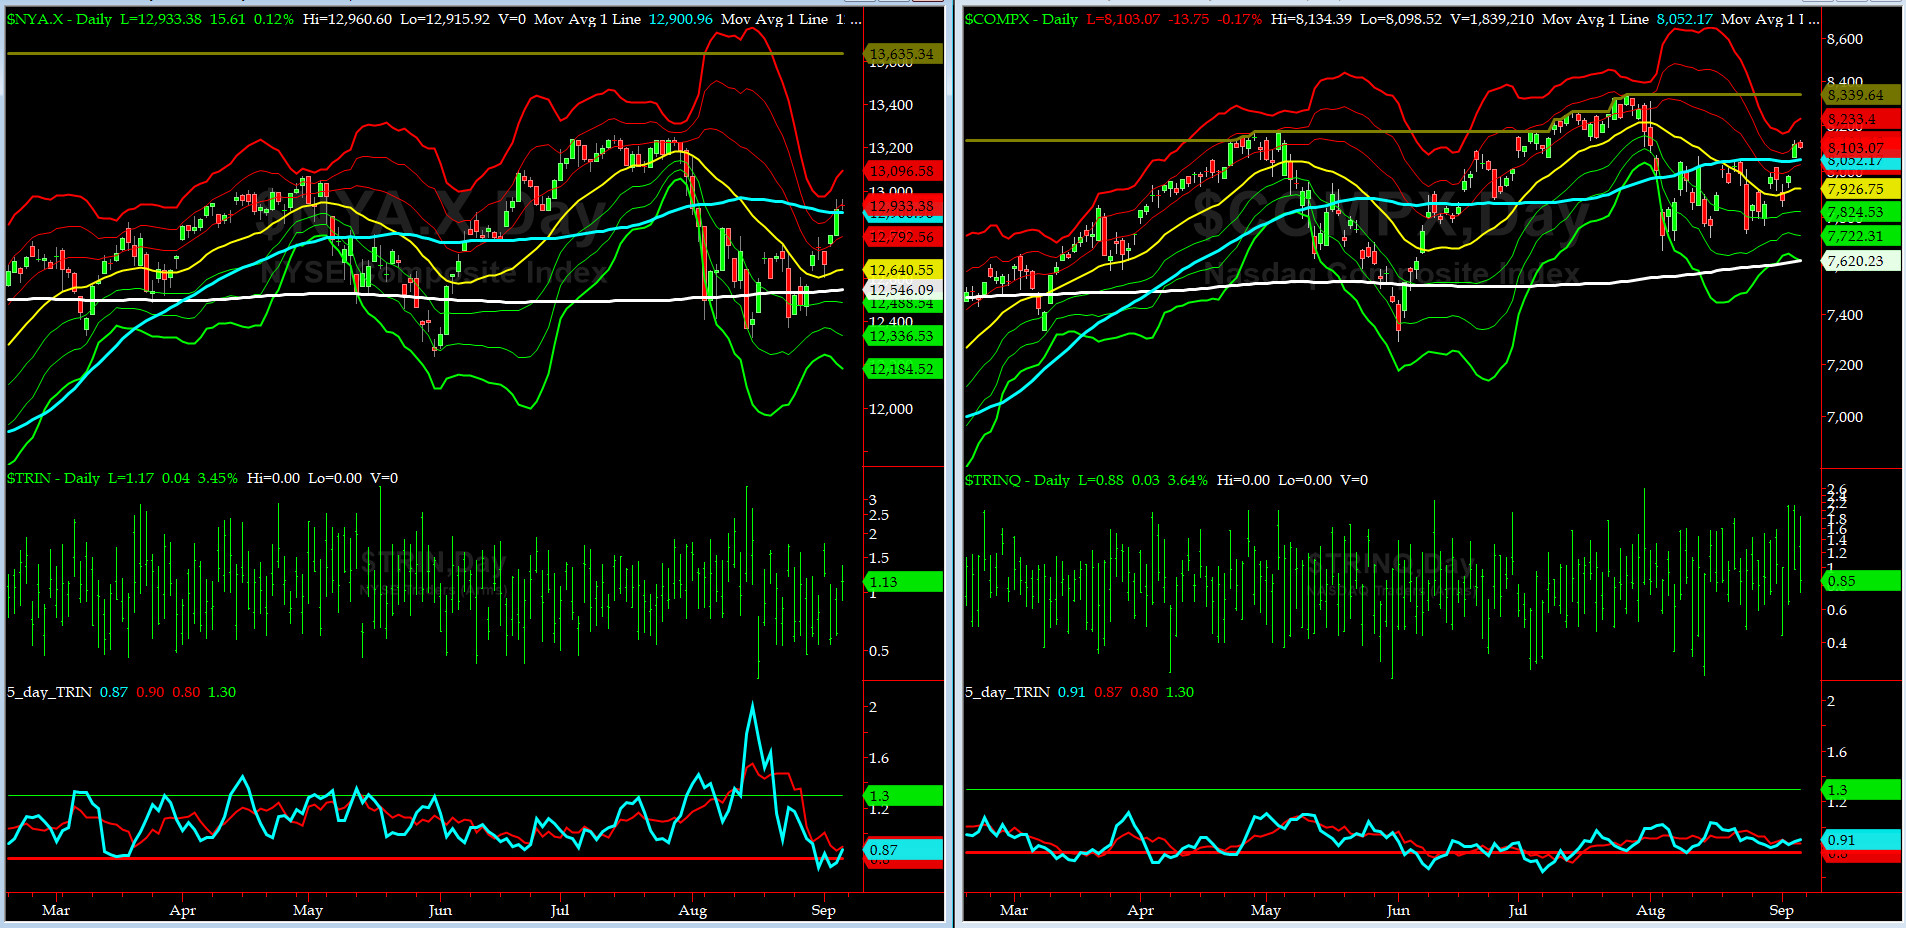
5-day TRIN & TRINQ Charts
NYSE 5-day TRIN is about to issue a SELL signal while NASDAQ 5-day TRINQ is still in the NEUTRAL zone.
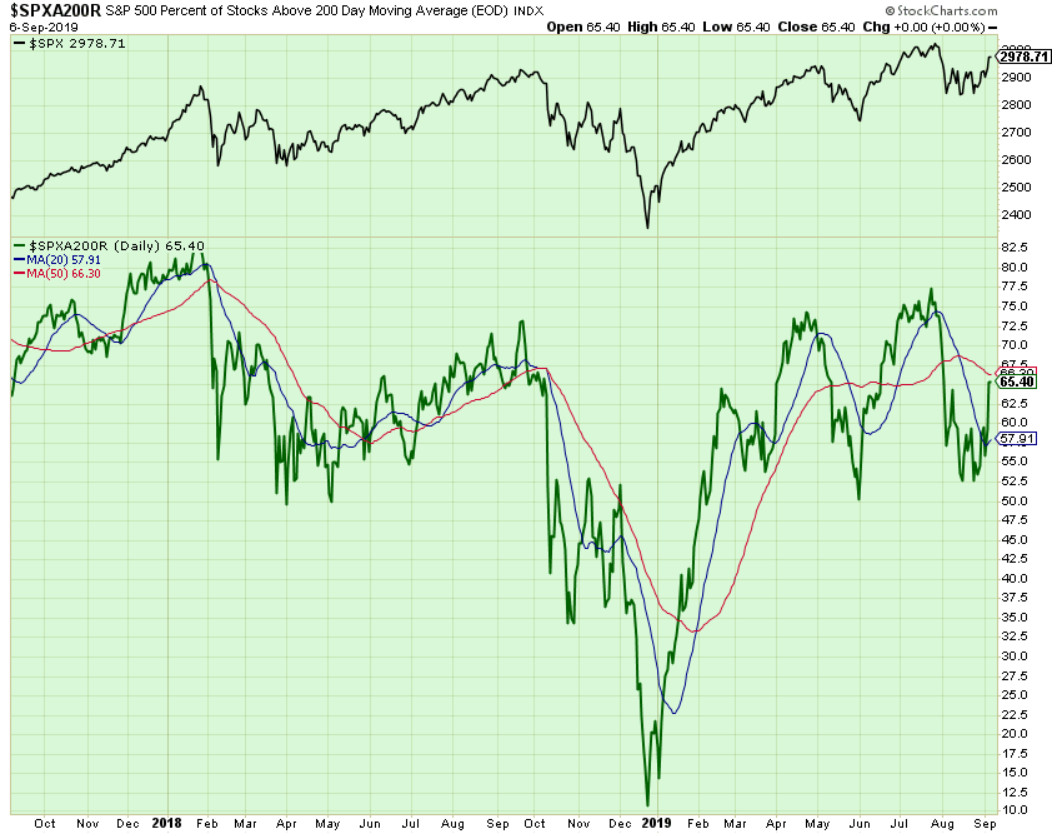
Components of SPX above their respective 200-day MA Chart
This scoring indicator closed last Friday at 65%. Look at its 2 MAs. A failure to punch thru 66 here would have negative consequences going into late September.
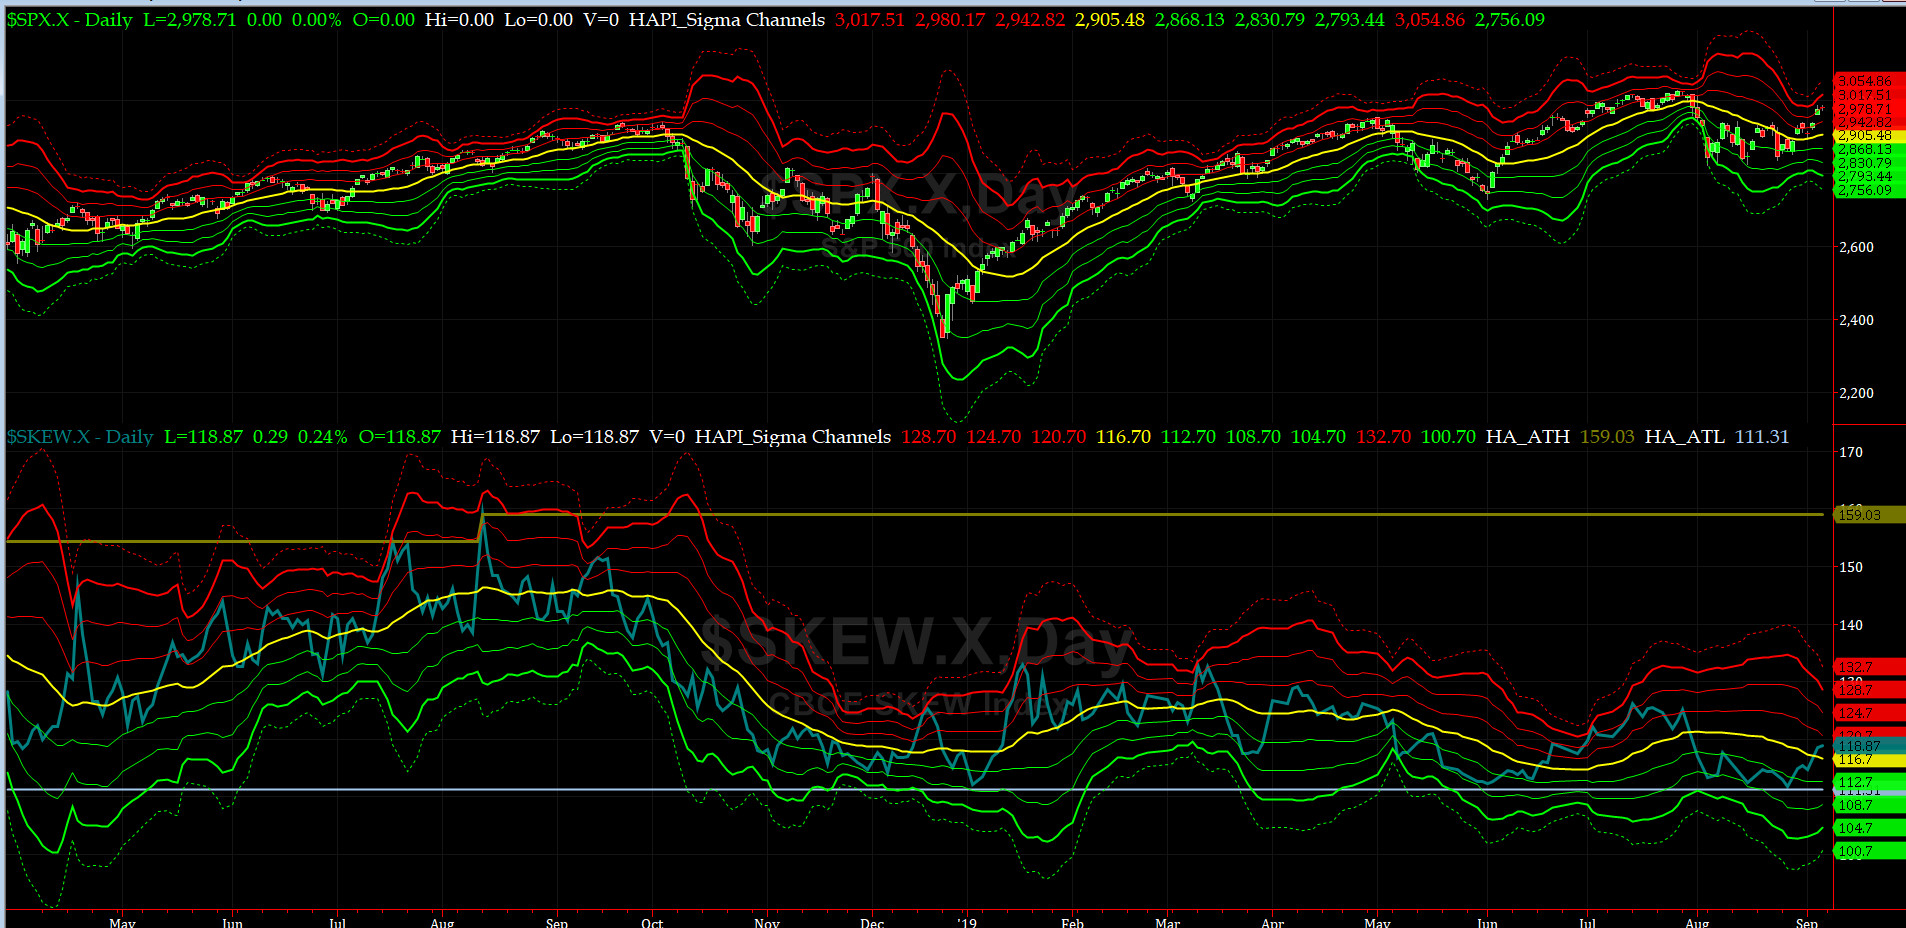
SPX SKEW (Downside Tail Risk) Chart
On Friday, SPX SKEW (Downside Tail Risk) rose pretty sharply to 118.9, now about its -1 sigma (normal = 115, range 100-150).
All quiet on the Eastern & Mid-Western Fronts? our beloved HRH Capt. Tiko, KCPE, has finally changed his bias here: the Whales are raising their bets for a [seasonal?] move lower as indicated by recent upticks in Tail Risk.
How to interpret the value of SPX SKEW? (from CBOE white paper on SKEW)

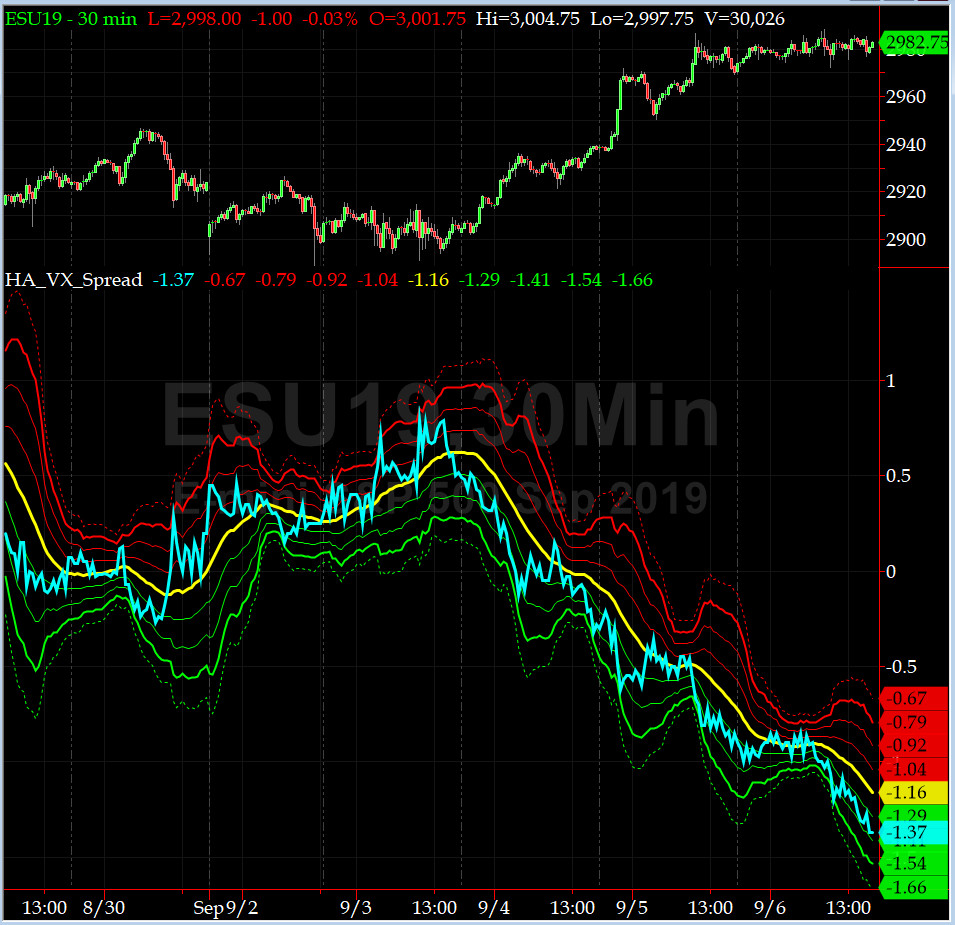
3-month VIX Futures Spread(VX) Chart
This popular timing indicator for identifying tradable bottoms, (now long SEP19, & short DEEZ19 VIX Futures) hit -1.37 on Friday Close. That is a NEUTRAL signal. But remember, with continued Grumpino's erratic behavior, you never know.

HA_SP2 Chart
HA_SP2 = 74.8 (Buy signal <= 25, Sell Signal >= 75)
This is a border-line OverBought reading here.
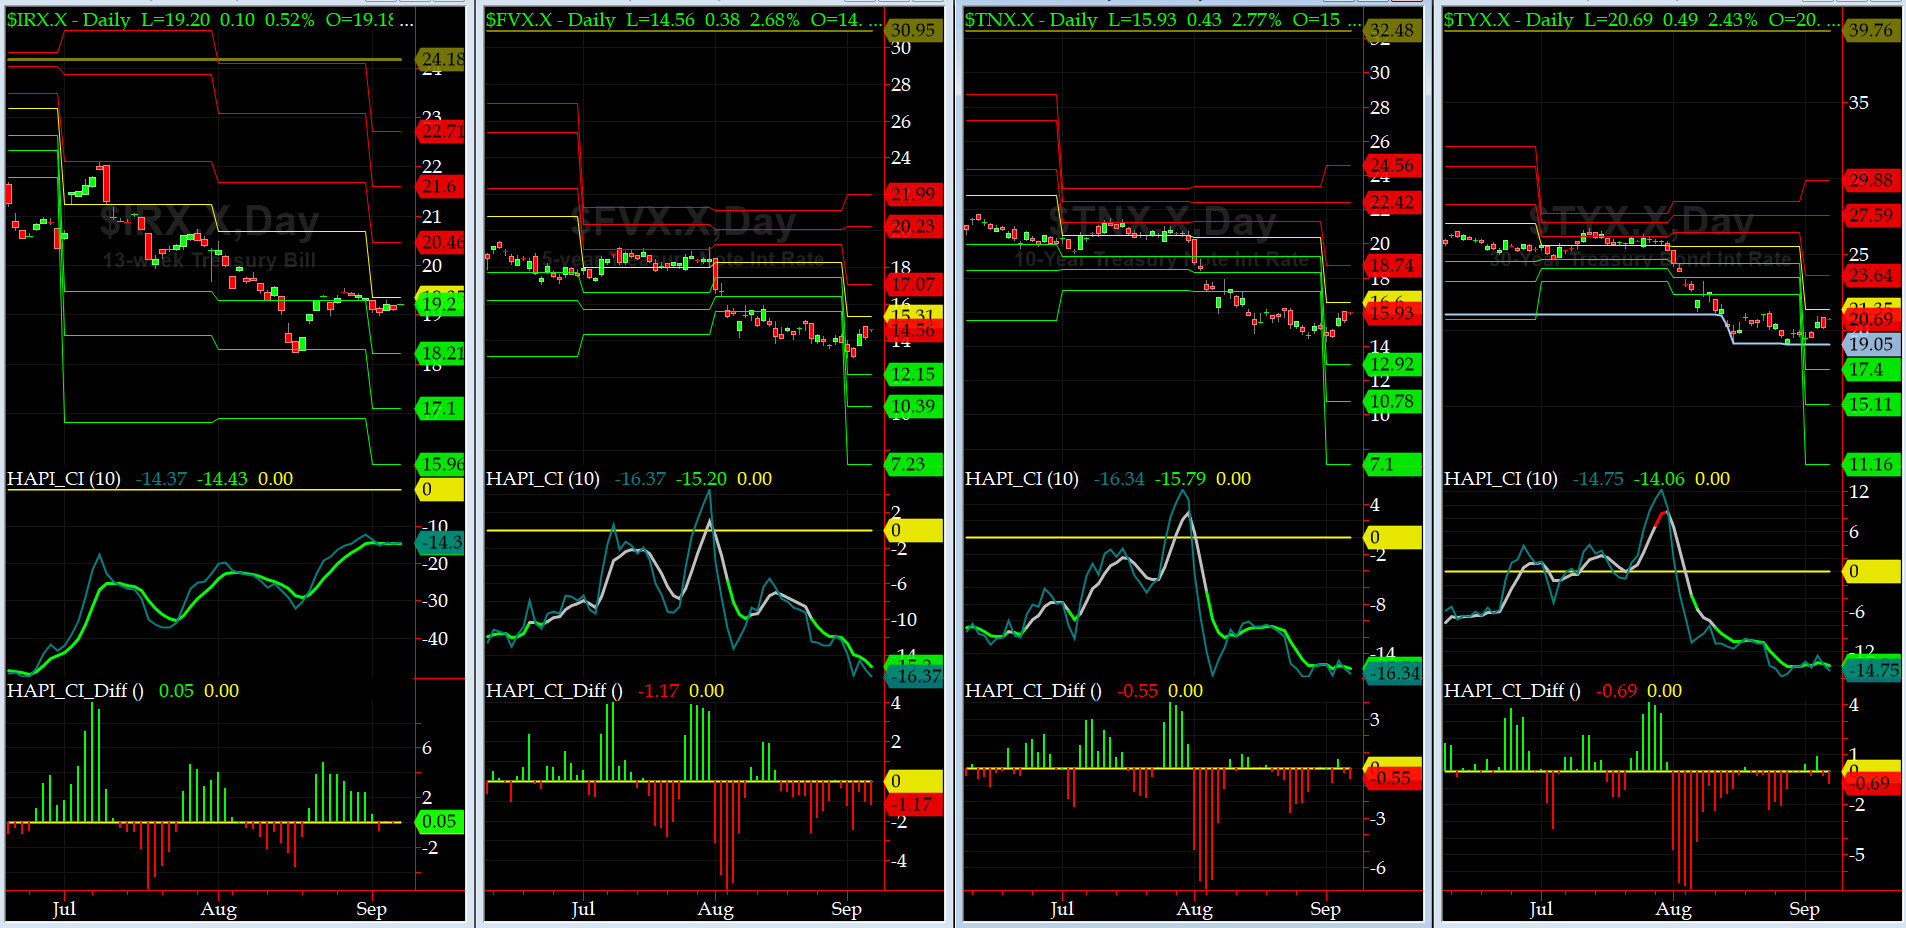
US Treasury T-Notes & T-Bonds Yields Chart
The Yield Curve (both front and bad end) may have signaled here with a flight to quality as we go into the crucial September FOMC Meeting.
Fari Hamzei
|


 Proactive Market Timing