|
Sunday, September 29, 2019, 2045ET
Market Timing Charts, Analysis & Commentary for Issue #308
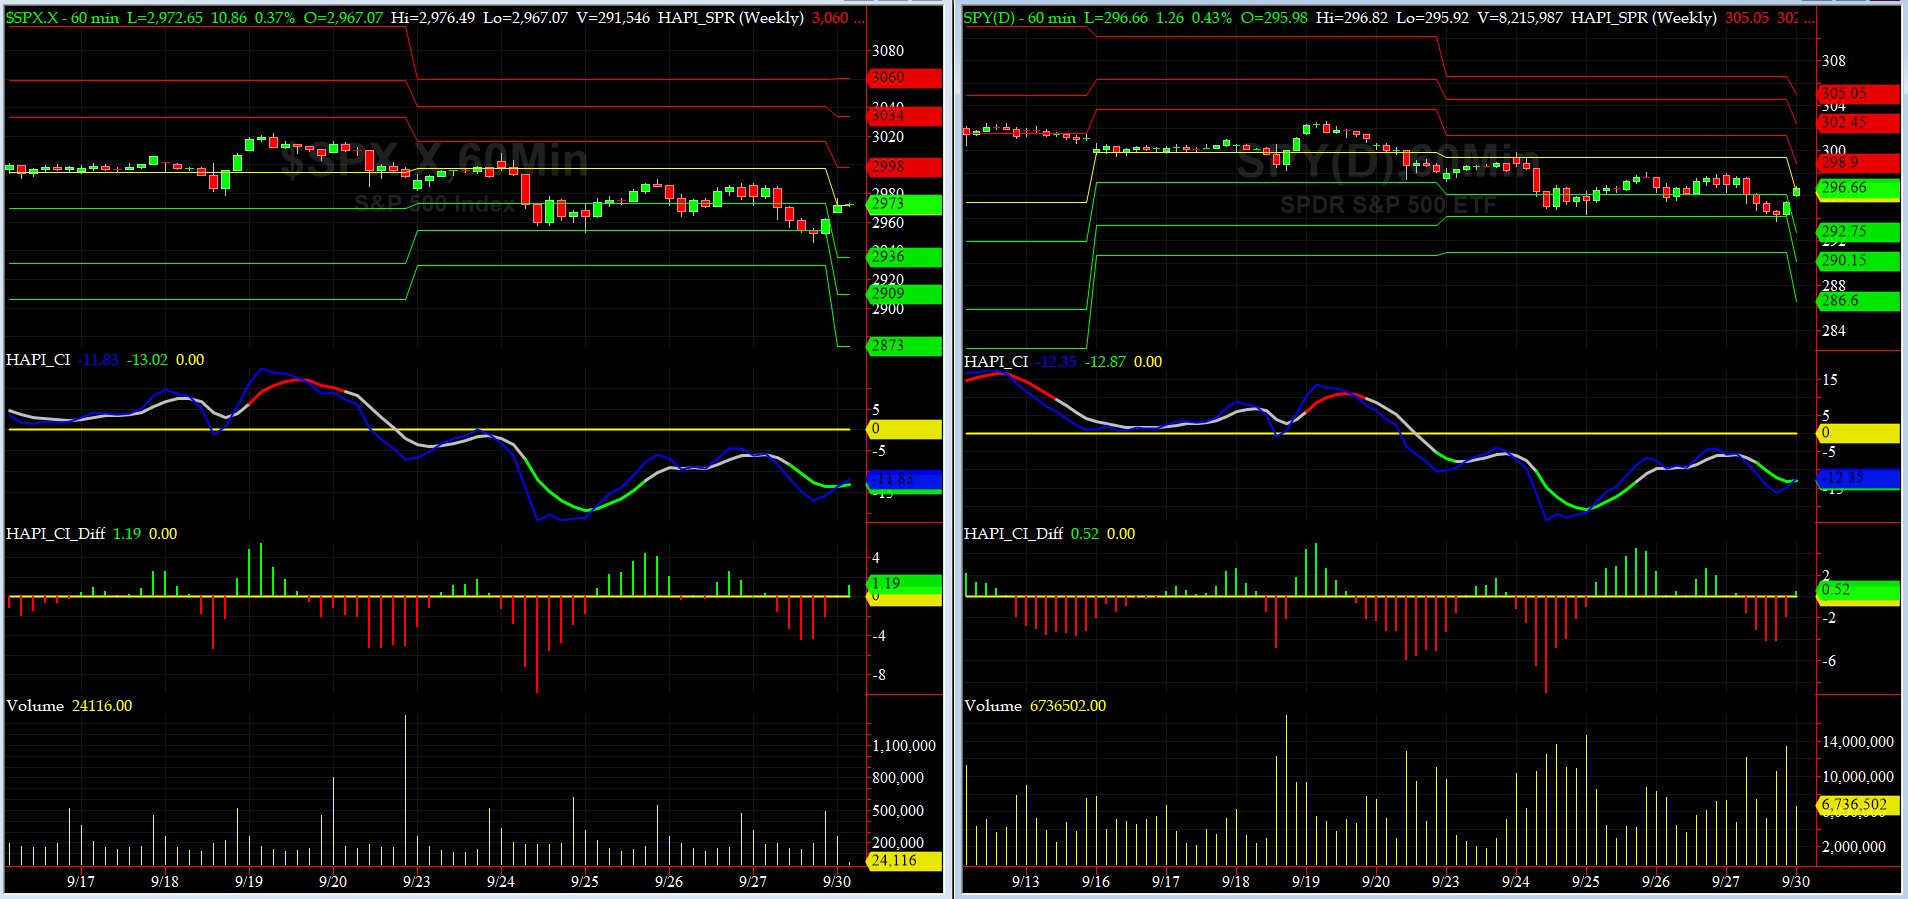
Timer Charts of S&P-500 Cash Index (SPX) + NASDAQ-100 Cash Index (NDX)
Most recent S&P-500 Cash Index (SPX) Close: 2962 down -30 (down -1%) for the week ending on Friday, September 27, 2019, which closed at its -1 sigma.
DJIA ALL TIME INTRADAY HIGH = 27398 (reached on Tuesday, July 16, 2019)
DJT ALL TIME INTRADAY HIGH = 11623 (reached on Friday, September 14, 2018)
SPX ALL TIME INTRADAY HIGH = 3028 (reached on Friday, July 26, 2019)
NDX ALL TIME INTRADAY HIGH = 8027 (reached on Friday, July 26, 2019)
RUT ALL TIME INTRADAY HIGH = 1742 (reached on Friday, August 31, 2018)
Current DAILY +2 Sigma SPX = 3035 with WEEKLY +2 Sigma = 3063
Current DAILY 0 Sigma SPX = 2980 with WEEKLY 0 Sigma = 2923
Current DAILY -2 Sigma SPX = 2924 with WEEKLY -2 Sigma = 2784
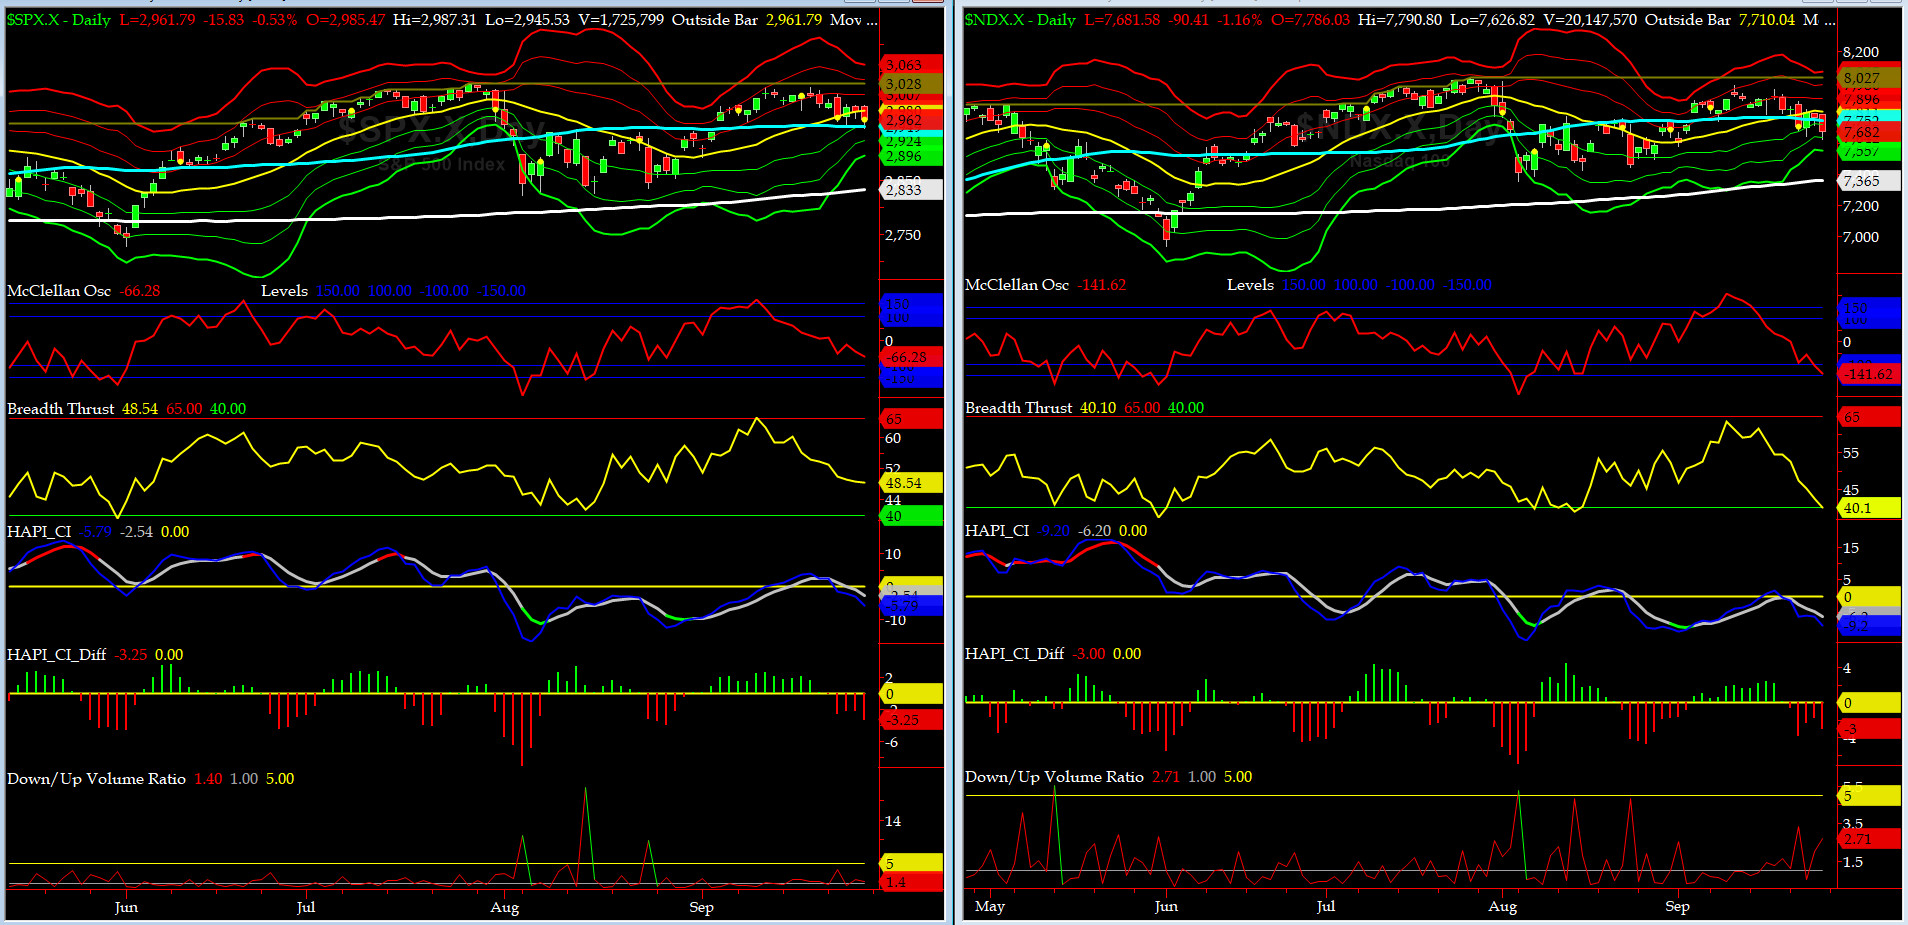
NYSE McClellan Oscillator = -66.3 (-150 is start of the O/S area; around -275 to -300 area or lower, we go into the �launch-pad� mode; over +150, we are in O/B area)
NYSE Breadth Thrust = 48.5 (40 is considered as oversold and 65 as overbought)
Each week we say "What a week it was" his week we have UN Gen Assembly and the start of High Holidays (SELL Rosh Hashanah & BUY Yom Kippur).

Canaries [in the Coal Mine] Chart for DJ TRAN & RUT Indices
200-Day MA DJ TRAN = 10,245 or 2% BELOW DJ TRAN (max observed in last 7 yrs = 20.2%, min = -20.3%)
200-Day MA RUT = 1518 or 2.7% BELOW RUT (max observed in last 7 yrs = 21.3%, min = -22.6%)
DJ Transportation Index (proxy for economic conditions 6 to 9 months hence) had another tough week.
Russell 2000 Small Caps Index (proxy for Risk ON/OFF) showing RISK ON has backed off.
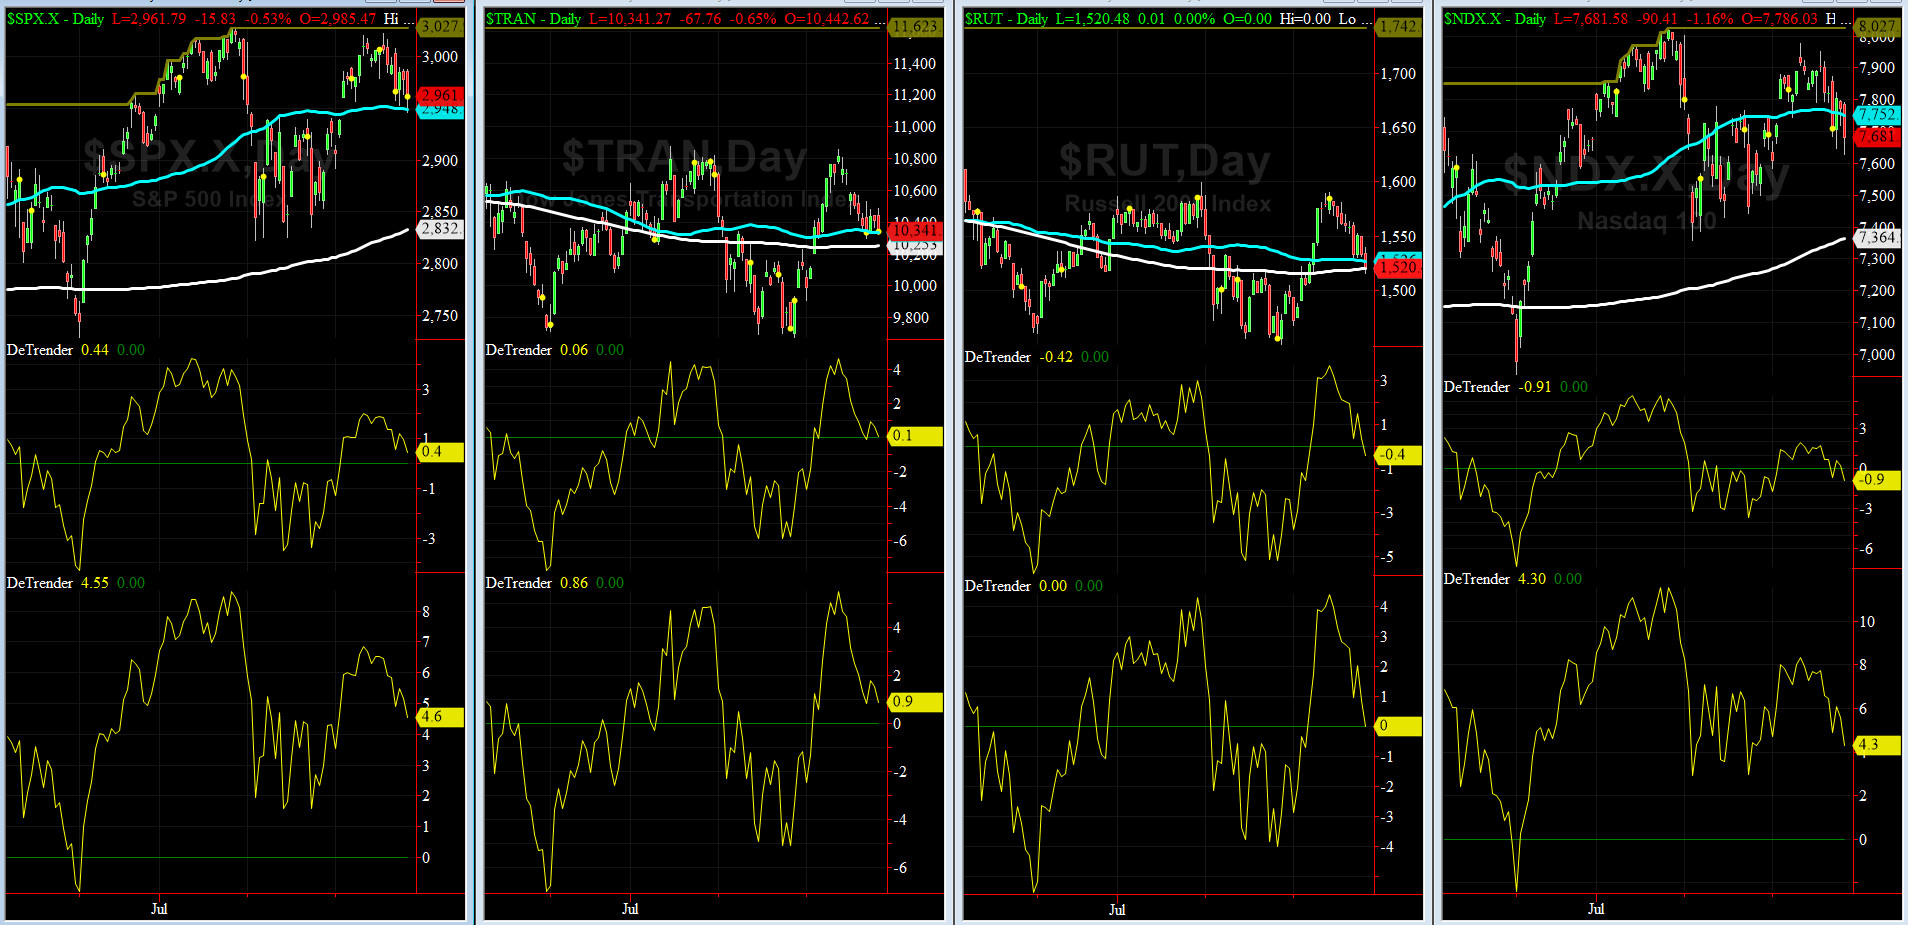
DeTrenders Charts for SPX, NDX, TRAN & RUT Indices
50-Day MA SPX = 2951 or 1.4% BELOW SPX (max observed in last 7 yrs = +8.6%, min = -9.3%)
200-Day MA SPX = 2825 or 5.9% BELOW SPX (max observed in last 7 yrs = 15.2%, min = -14%)
ALL of our EIGHT DeTrenders are in the POSITIVE territory. The DeTrenders for DJ Tran & RUT will continue to be harbingers of future price behavior in broad indices.
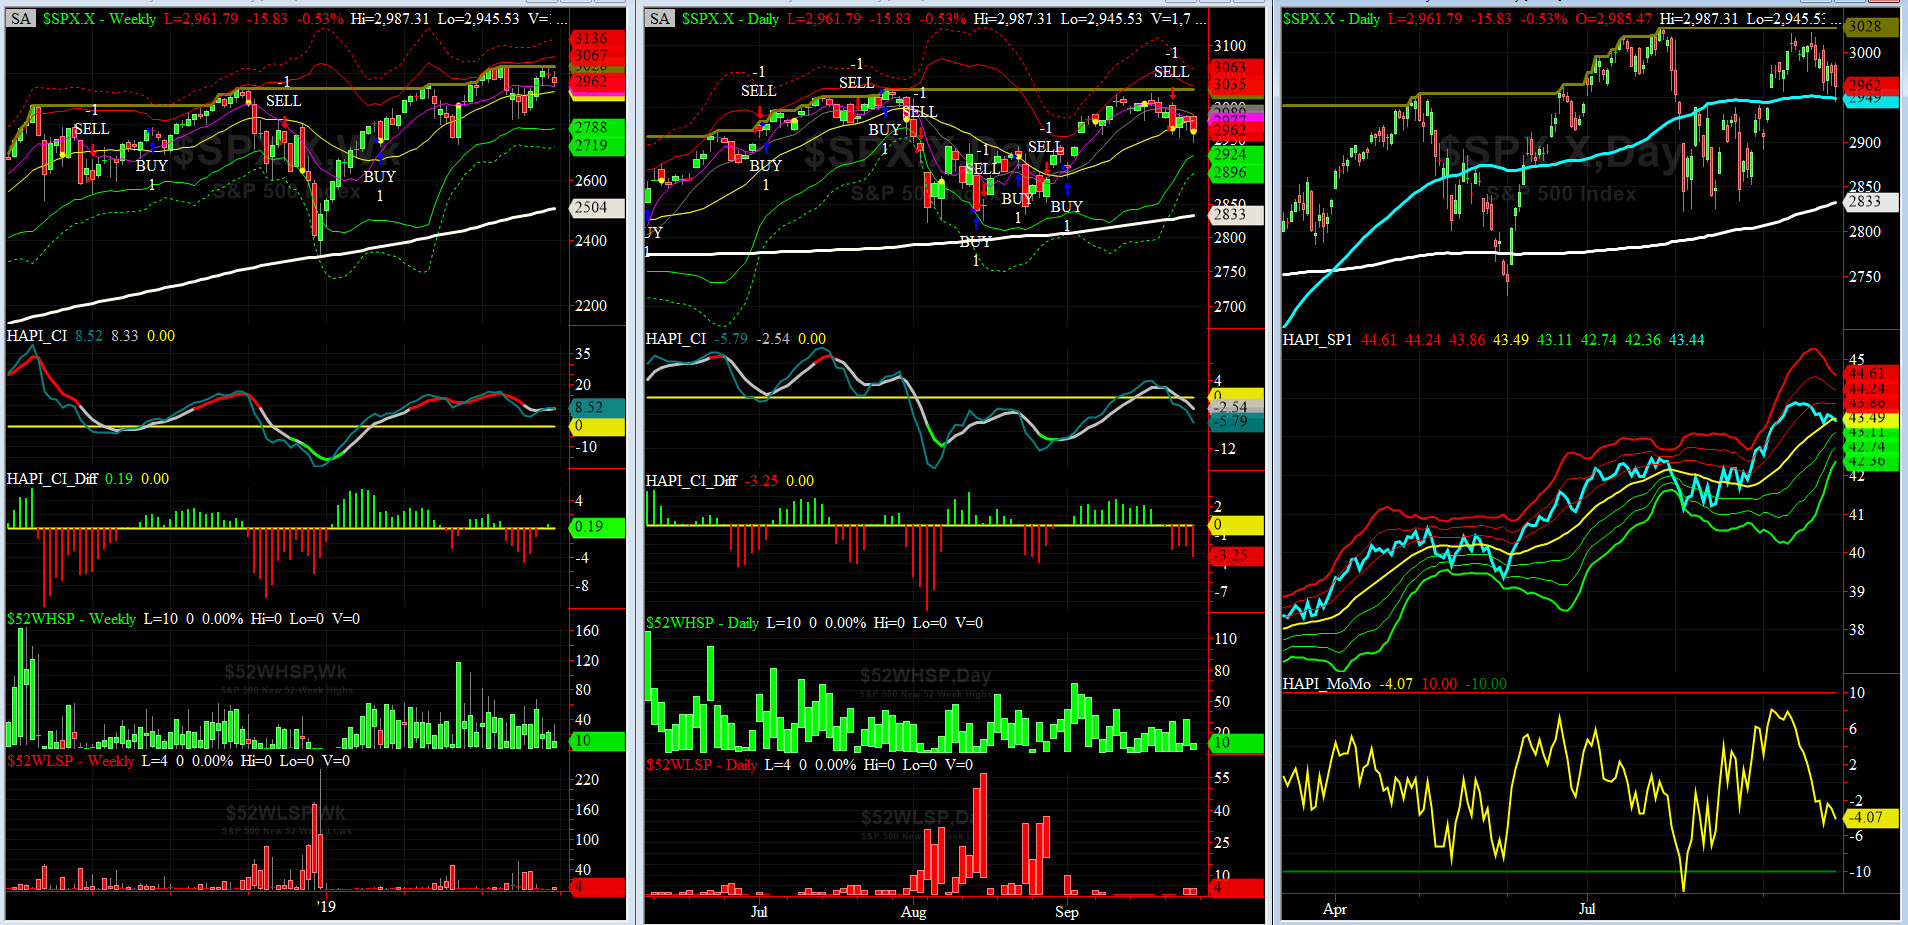
HA_SP1_Momo Chart
WEEKLY Timing Model = on a BUY Signal since Friday, March 8, 2019 CLOSE at 2743
DAILY Timing Model = on a BUY Signal since Tuesday, September 3, 2019 CLOSE at 2906
Max SPX 52wk-highs reading last week = 25 (over 120-140, the local maxima is in)
Max SPX 52wk-Lows reading last week = 1 (over 40-60, the local minima is in)
HA_SP1 closed near its +0.5 sigma channels
HA_Momo = +2.14 (reversals most likely occur above +10 or below -10)
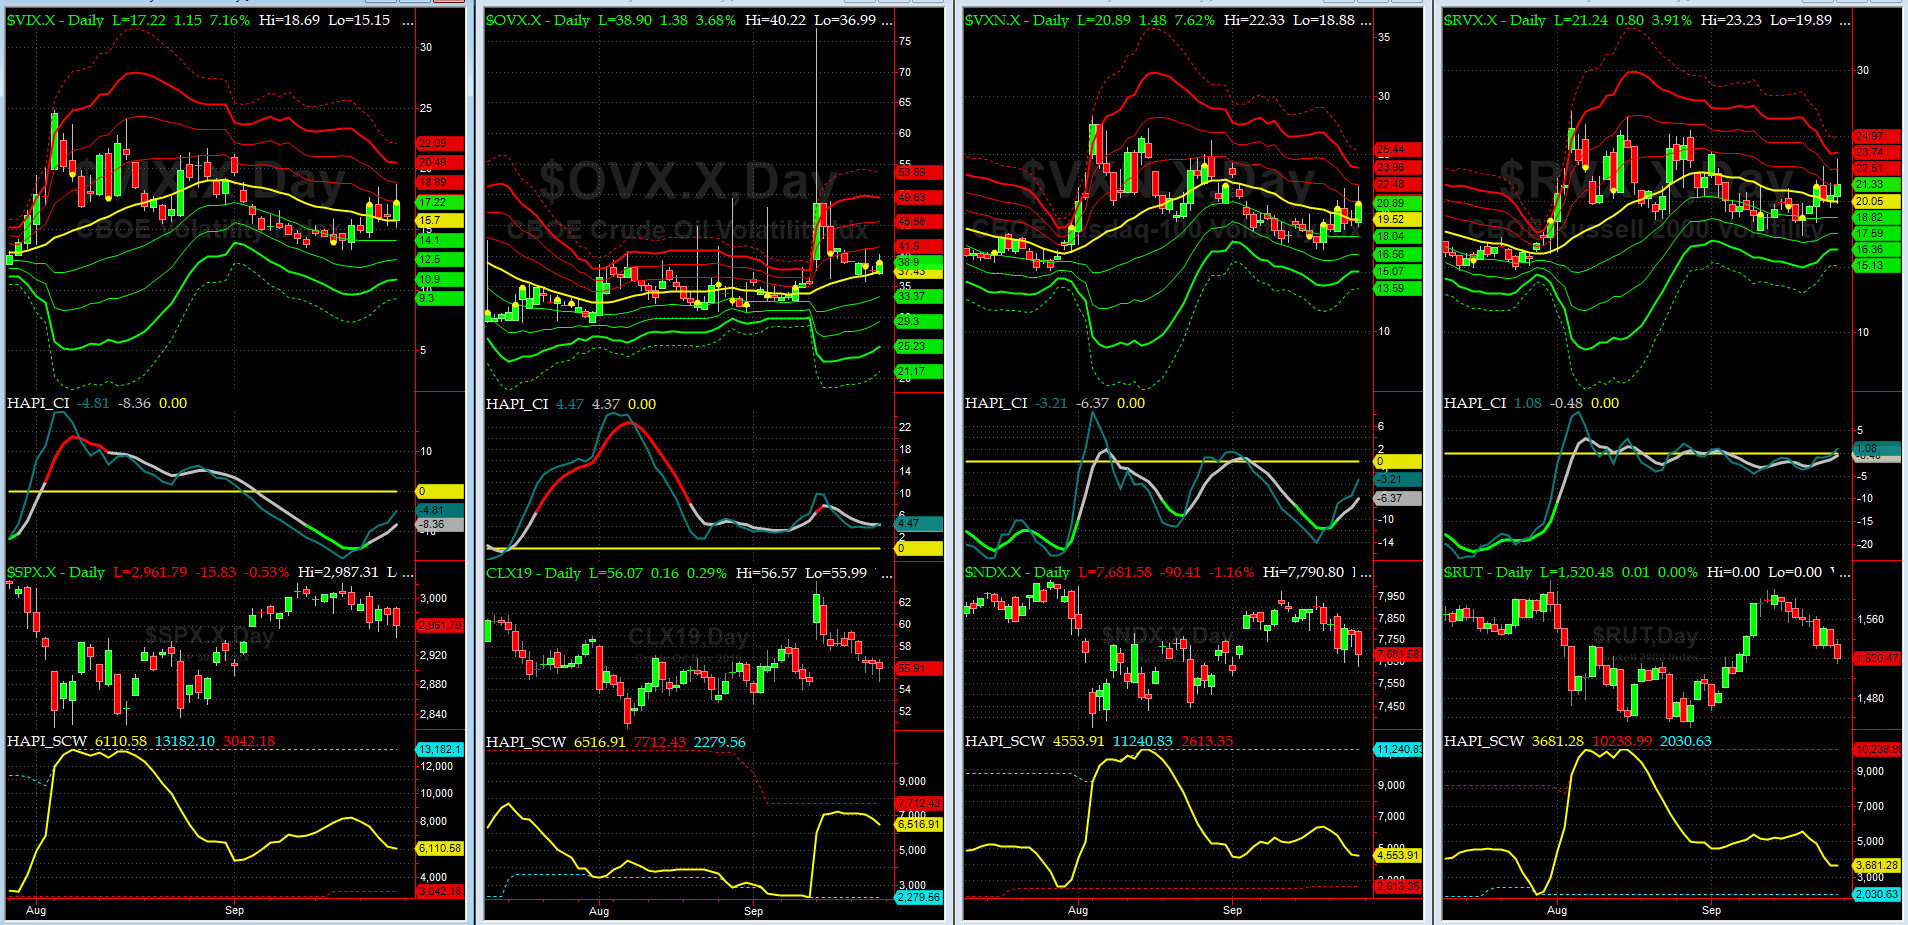
Vol of the Vols Chart
Spot VIX stood at 15.3 on Tuesday night, a tad below its -0.5 sigma (remember it's the VIX volatility pattern aka "its sigma channels" that matters, and not the level of VIX itself (this is per Dr. Robert Whaley, a great mentor and inventor of original VIX, now called VXO). VIX usually peaks around a test of its +4 sigma).
VIX up ticked a bit but nothing to write home about.
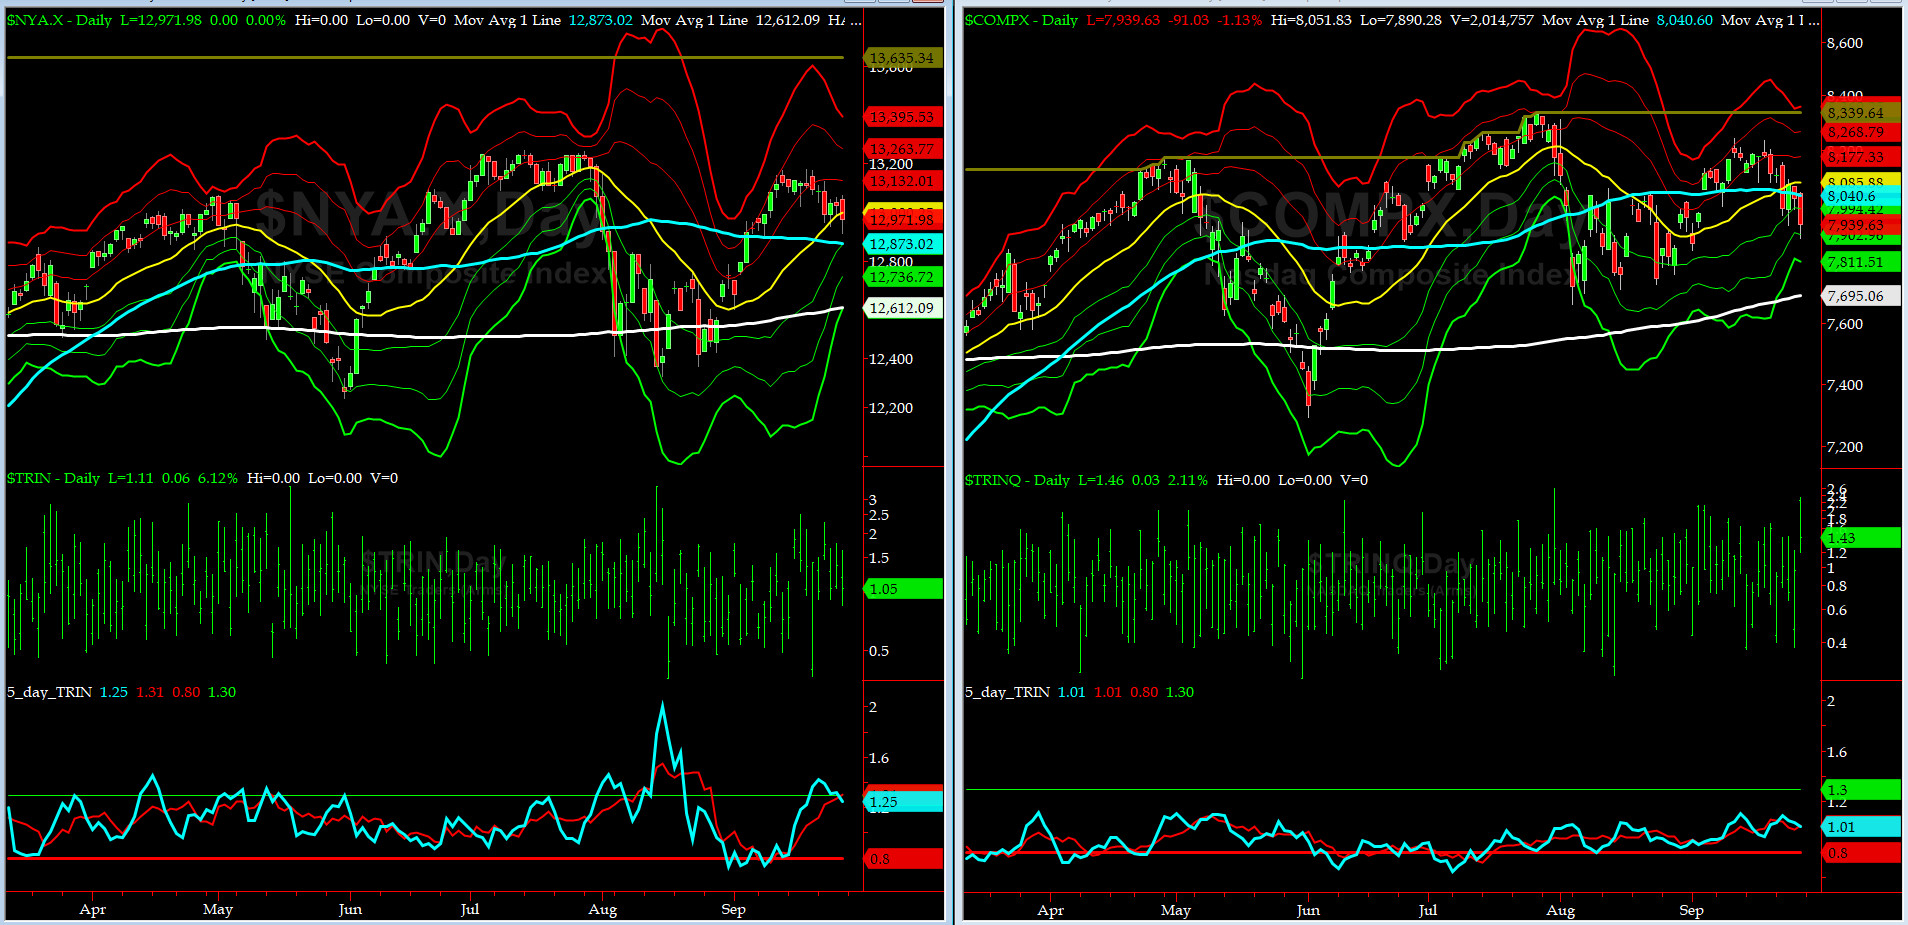
5-day TRIN & TRINQ Charts
NYSE 5-day TRIN is in clearly a BUY signal here while NASDAQ 5-day TRINQ is still in the NEUTRAL zone.
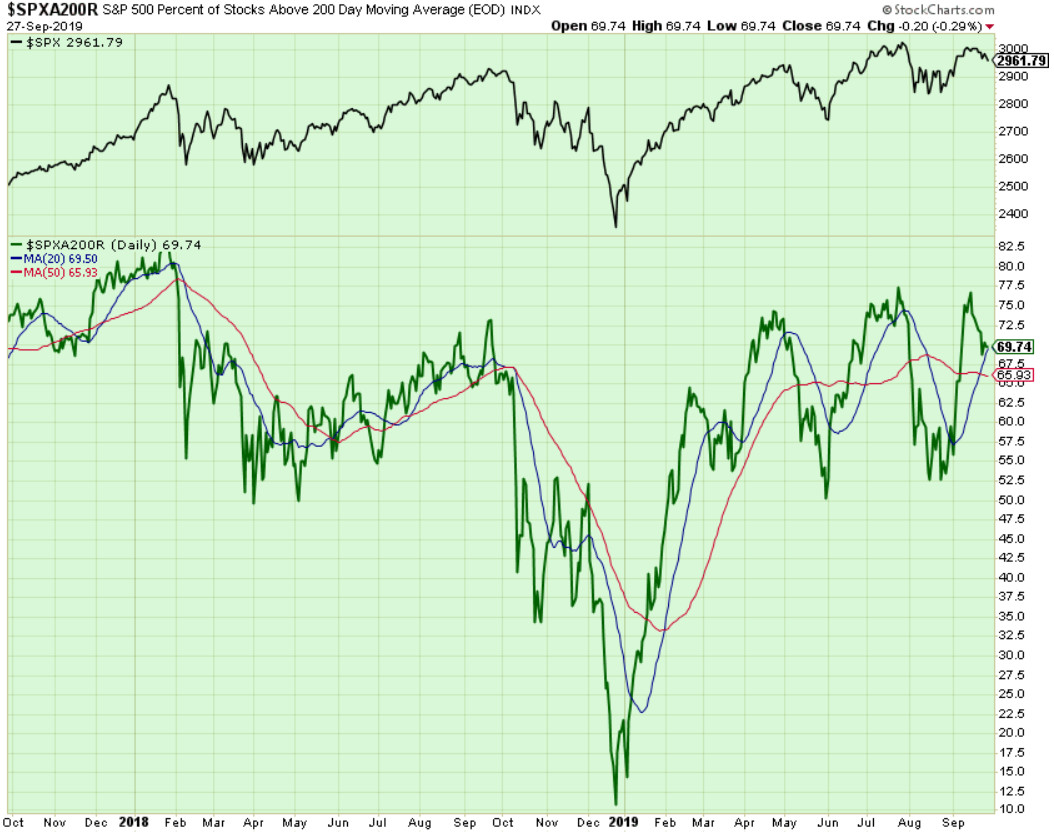
Components of SPX above their respective 200-day MA Chart
This scoring indicator could not get over 77%, and by Friday dropped to 72% continuing to build a triple-top (or as some prefer to call it a head-and-shoulder pattern) that we talked abut last week.
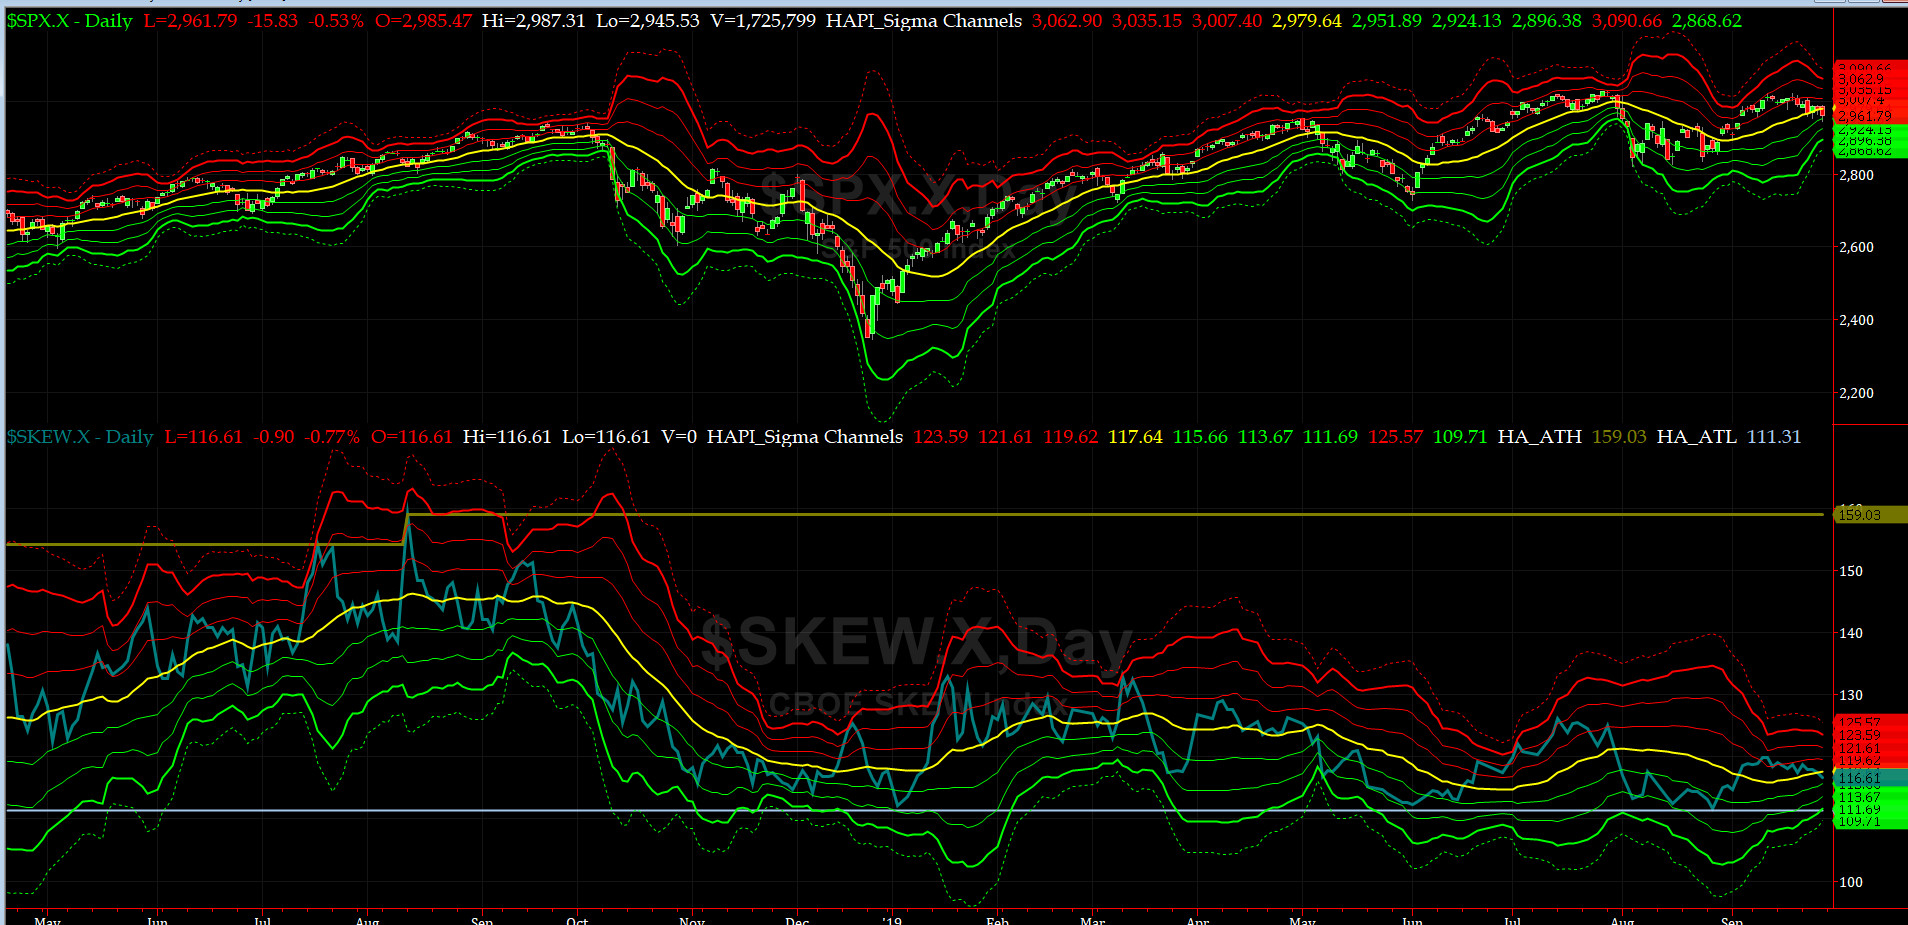
SPX SKEW (Downside Tail Risk) Chart
On Friday, SPX SKEW (Downside Tail Risk) rose pretty sharply to 117.5, now just a tad above its zero sigma (normal = 115, range 100-150).
All quiet on the Eastern & Mid-Western Fronts? our beloved HRH Capt. Tiko, KCPE, says YES (for now)...
How to interpret the value of SPX SKEW? (from CBOE white paper on SKEW)


3-month VIX Futures Spread(VX) Chart
This popular timing indicator for identifying tradable bottoms, (now long SEP19, & short DEEZ19 VIX Futures) hit -1.6 on Friday Close. That is a NEUTRAL signal. But remember, with continued Grumpino's erratic behavior, you never know.

HA_SP2 Chart
HA_SP2 = 48 (Buy signal <= 25, Sell Signal >= 75)
That as a huge drop in SP2 on Friday -- Thank you Grumpino !!! you are best that ever happened to day traders.
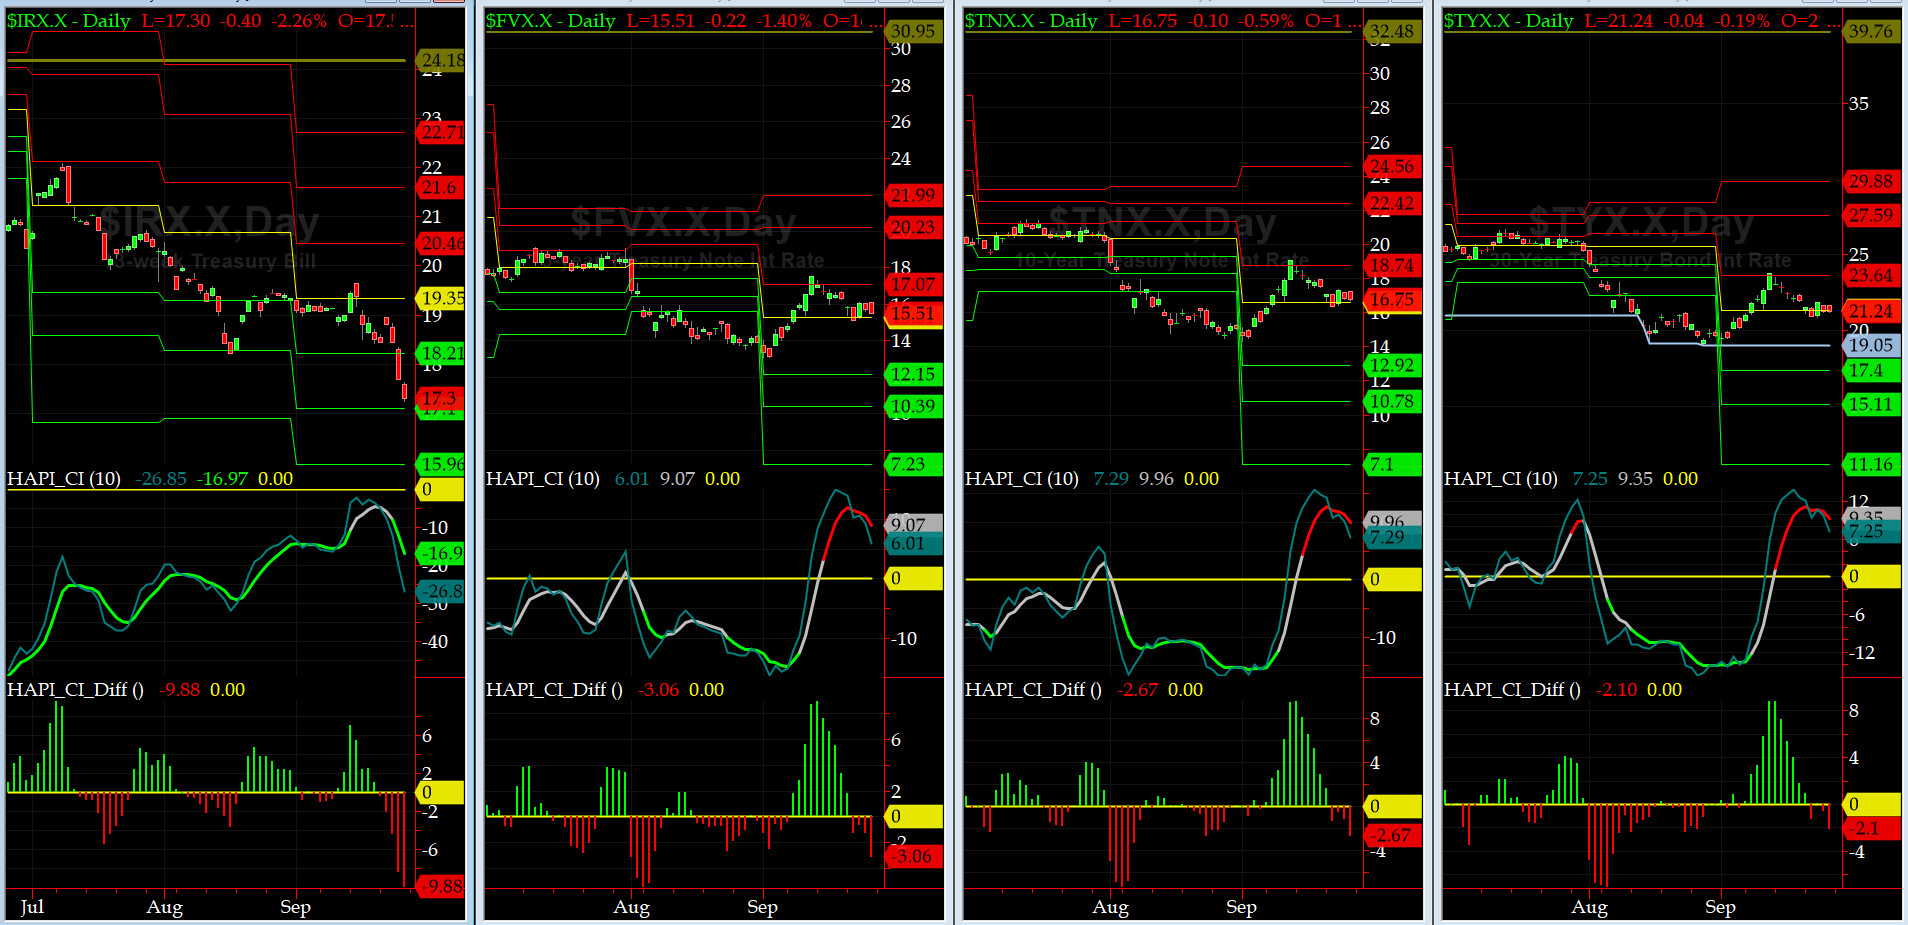
US Treasury T-Notes & T-Bonds Yields Chart
The Yield Curve (both front and back end) eased off last week. We hear Maury is not happy any more. He may have to change his analyst LOL.
Fari Hamzei
|


 Proactive Market Timing