
|
 |
 |
 |
 |
 |
 |
 |
 |
 Proactive Market Timing Proactive Market Timing
|
|
|
Most Recent PMT vs SPX Performance Chart

|
|
|
|
Wednesday, October 9, 2019, 1515ET
UPDATED Companion Chart for Market Bias Review, Issue #309

|
|
|
|
|
|
Wednesday, October 9, 2019, 1510ET
UPDATED Market Bias for Issue #309
Our current Market Bias with Timer Digest is LONG SPX as of OCT 8 at 2893
Our previous Market Bias was SHORT SPX as of SEPT 25 at 2984
Here are the trade parameters for this week:
SPX Secondary Profit Target for last 20% of our position = 2970
SPX Primary Profit Target for first 80% of our position = 2955
SPX BreakEven Stop (Current Price) for last 20% of our position = 2926
SPX Money Management Stop for 100% of our position = 2900
|
| Action |
Asset |
Expiration |
Strike |
Option |
| BUY |
SPY |
Friday NOV 1 |
292 |
Calls |
| SELL SHORT |
SPY |
Friday NOV 1 |
298 |
Calls |
| You need to execute both legs and hold it as a Call-Spread.
|
Note A:
Once the Primary Profit Target has been reached, traders are advised to close 80% of their position in order to lock in profits. The remaining balance can be carried over with a BreakEven STOP, based on the SPX level at the time of entry, in order to make the trade a zero-risk trade with the final position running to reach the Secondary Profit Target.
Once either Secondary Profit or Money Management (BreakEven STOP after the 80% peel-off) is hit, our Option/ETF trade for that week is over. Go to Cash and wait for the next PMT Issue.
Note B:
When we change our Market Bias with Timer Digest, You need to go FLAT asap. With PMT Pro, that is before the Close that day and with the basic PMT, at the open of the next day. The following trading day, we will issue new SPX targets and a new SPY options trade, as long our new market bias with Timer Digest is NOT flat.
Fari Hamzei
|
|
|
|
|
|
Tuesday, October 8, 2019, 2341ET
Notice of Change of Bias with Timer Digest
Dear Jim,
As promised, we SOLD SHORT SPX on Sept 25th, ahead of Rosh Hashanah, and now, we are getting LONG SPX on Yom Kippur for a cool 93 handles gain.
#onlyinAmerica
Cheers�.
Fari Hamzei
|
|
|
|
|
|
Monday, Octber 7, 2019, 1000ET
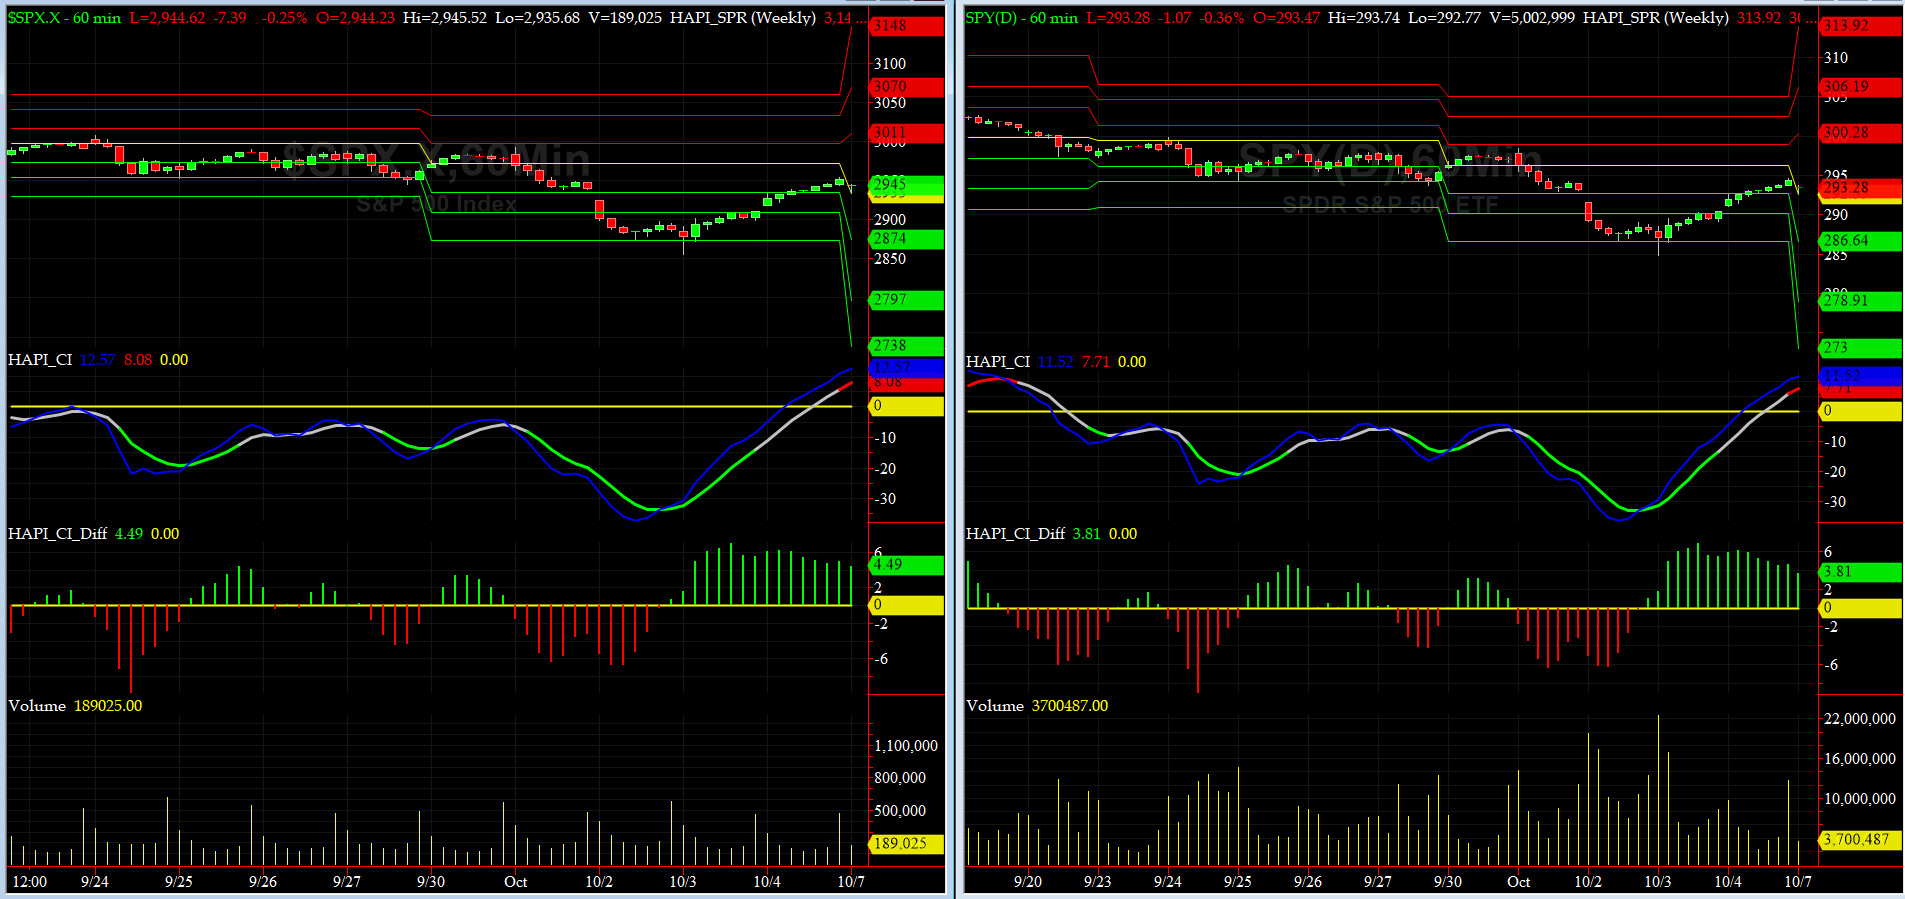
Companion Chart for Market Bias Review, Issue #309
|
|
|
|
|
|
Monday, October 7, 2019, 0955ET
Market Bias for Issue #309
Our current Market Bias with Timer Digest is SHORT SPX as of SEPT 25 from 2985
Our previous Market Bias was LONG SPX as of SEPT 19 from 3006
Here are the trade parameters for this week:
SPX Money Management Stop for 100% of our position = 2975
SPX BreakEven Stop (Current Price) for last 20% of our position = 2943
SPX Primary Profit Target for first 80% of our position = 2910
SPX Secondary Profit Target for last 20% of our position = 2880
|
| Action |
Asset |
Expiration |
Strike |
Option |
| BUY |
SPY |
Friday OCT 25 |
294 |
Puts |
| SELL SHORT |
SPY |
Friday OCT 25 |
288 |
Puts |
| You need to execute both legs and hold it as a Put-Spread.
|
Note A:
Once the Primary Profit Target has been reached, traders are advised to close 80% of their position in order to lock in profits. The remaining balance can be carried over with a BreakEven STOP, based on the SPX level at the time of entry, in order to make the trade a zero-risk trade with the final position running to reach the Secondary Profit Target.
Once either Secondary Profit or Money Management (BreakEven STOP after the 80% peel-off) is hit, our Option/ETF trade for that week is over. Go to Cash and wait for the next PMT Issue.
Note B:
When we change our Market Bias with Timer Digest, You need to go FLAT asap. With PMT Pro, that is before the Close that day and with the basic PMT, at the open of the next day. The following trading day, we will issue new SPX targets and a new SPY options trade, as long our new market bias with Timer Digest is NOT flat.
Fari Hamzei
|
|
|
|
|
|
Monday, October 7, 2019, 0830ET
Market Timing Charts, Analysis & Commentary for Issue #309
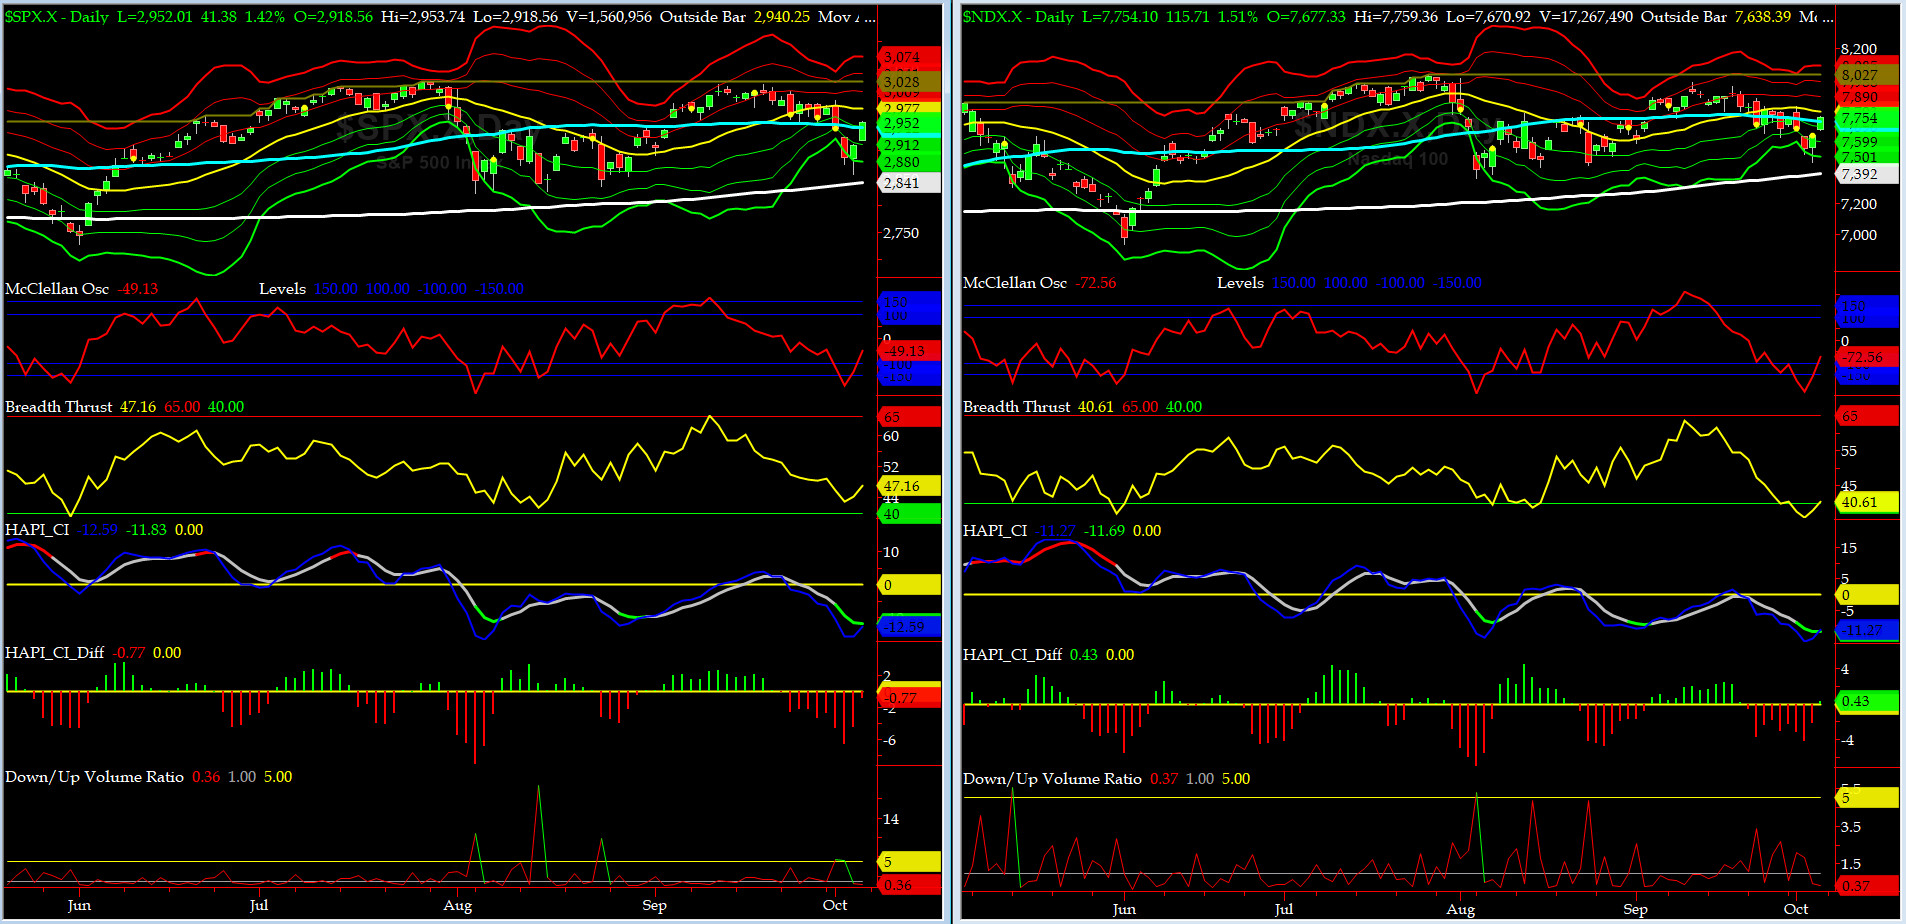
Timer Charts of S&P-500 Cash Index (SPX) + NASDAQ-100 Cash Index (NDX)
Most recent S&P-500 Cash Index (SPX) Close: 2952 down -10 (down -0.34%) for the week ending on Friday, October 4, 2019, which closed at its -0.5 sigma.
DJIA ALL TIME INTRADAY HIGH = 27398 (reached on Tuesday, July 16, 2019)
DJT ALL TIME INTRADAY HIGH = 11623 (reached on Friday, September 14, 2018)
SPX ALL TIME INTRADAY HIGH = 3028 (reached on Friday, July 26, 2019)
NDX ALL TIME INTRADAY HIGH = 8027 (reached on Friday, July 26, 2019)
RUT ALL TIME INTRADAY HIGH = 1742 (reached on Friday, August 31, 2018)
Current DAILY +2 Sigma SPX = 3041 with WEEKLY +2 Sigma = 3068
Current DAILY 0 Sigma SPX = 2977 with WEEKLY 0 Sigma = 2932
Current DAILY -2 Sigma SPX = 2912 with WEEKLY -2 Sigma = 2796
NYSE McClellan Oscillator = -49.1 (-150 is start of the O/S area; around -275 to -300 area or lower, we go into the �launch-pad� mode; over +150, we are in O/B area)
NYSE Breadth Thrust = 47.2 (40 is considered as oversold and 65 as overbought)
"SELL Rosh Hashanah & BUY Yom Kippur" worked for 3.25 days then we reversed. Tomorrow is Day of Atonement 5780 (Yom Kippur). Hard to say how exogenous political news plays into this week as we get ready for the Q4 Earnings Season. Stay nimble.

Canaries [in the Coal Mine] Chart for DJ TRAN & RUT Indices
200-Day MA DJ TRAN = 10,273 or 2.3% ABOVE DJ TRAN (max observed in last 7 yrs = 20.2%, min = -20.3%)
200-Day MA RUT = 1522 or 1.4% ABOVE RUT (max observed in last 7 yrs = 21.3%, min = -22.6%)
DJ Transportation Index (proxy for economic conditions 6 to 9 months hence) had a very rough week and we are near its death cross (50-day MA crossing BELOW its 200-day MA).
Russell 2000 Small Caps Index (proxy for Risk ON/OFF) also had a very rough week and saw its death cross on Friday. RISK IS OFF.
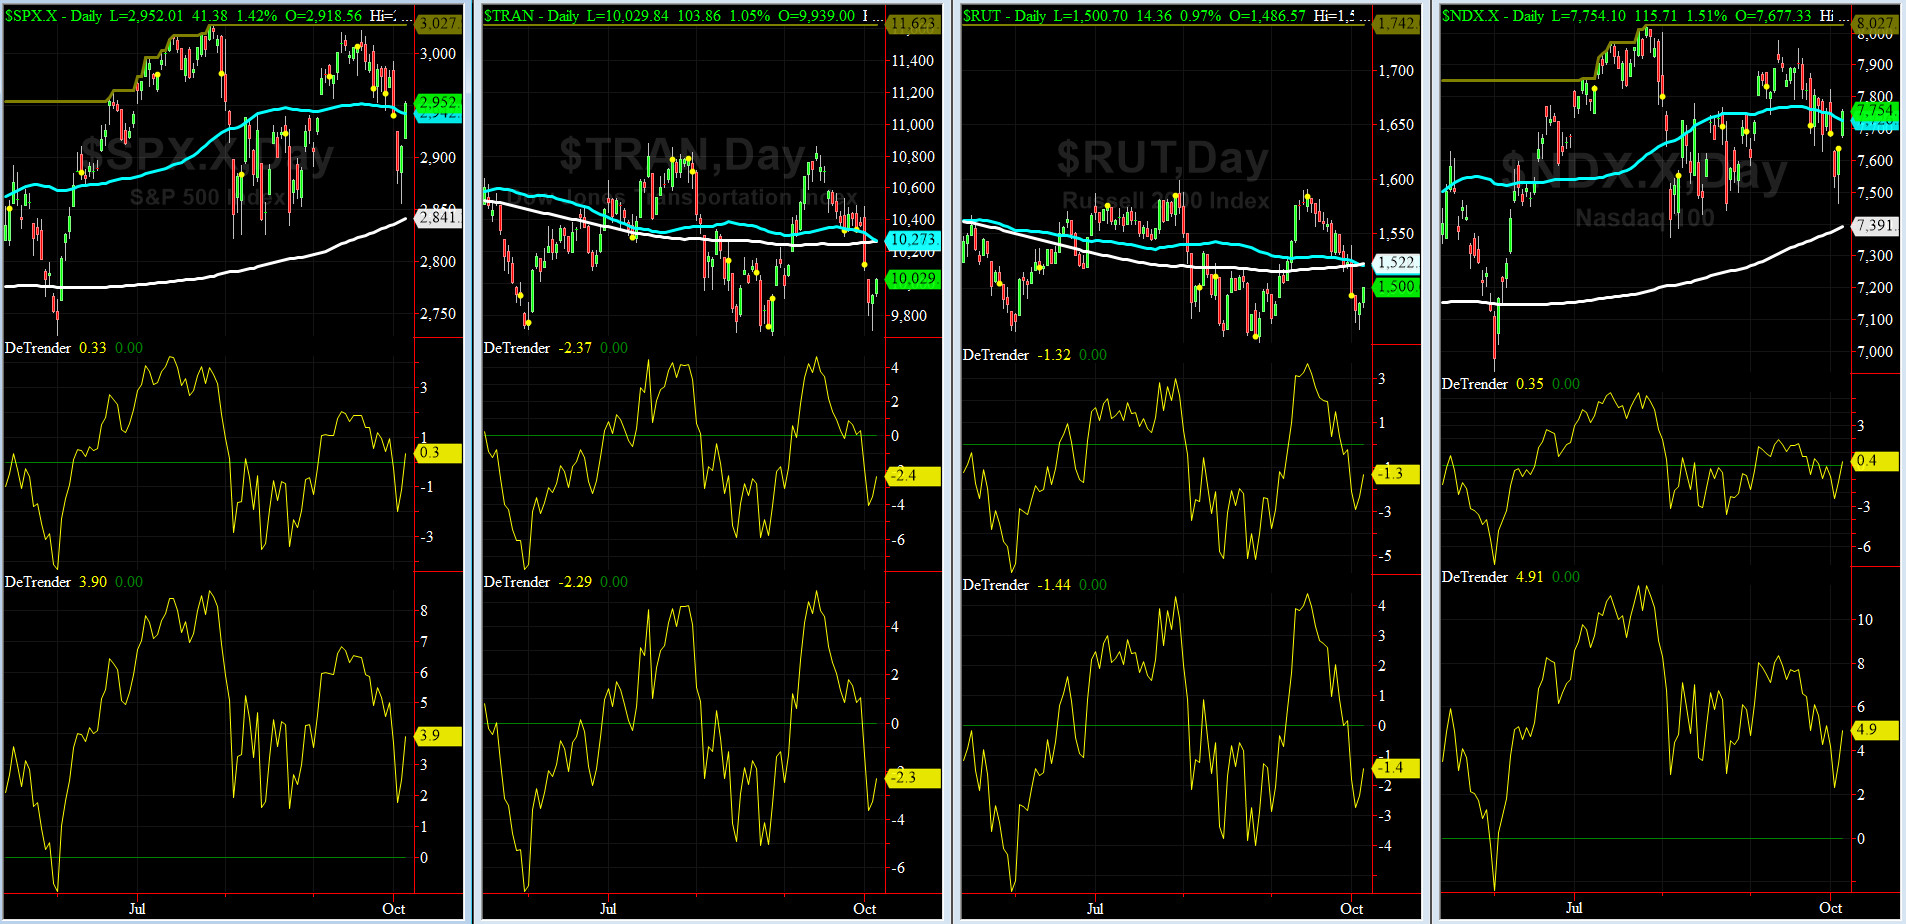
DeTrenders Charts for SPX, NDX, TRAN & RUT Indices
50-Day MA SPX = 2952 or 0.3% BELOW SPX (max observed in last 7 yrs = +8.6%, min = -9.3%)
200-Day MA SPX = 2841 or 3.9% BELOW SPX (max observed in last 7 yrs = 15.2%, min = -14%)
ALL of our EIGHT DeTrenders are in the POSITIVE territory. The DeTrenders for DJ Tran & RUT will continue to be harbingers of future price behavior in broad indices.
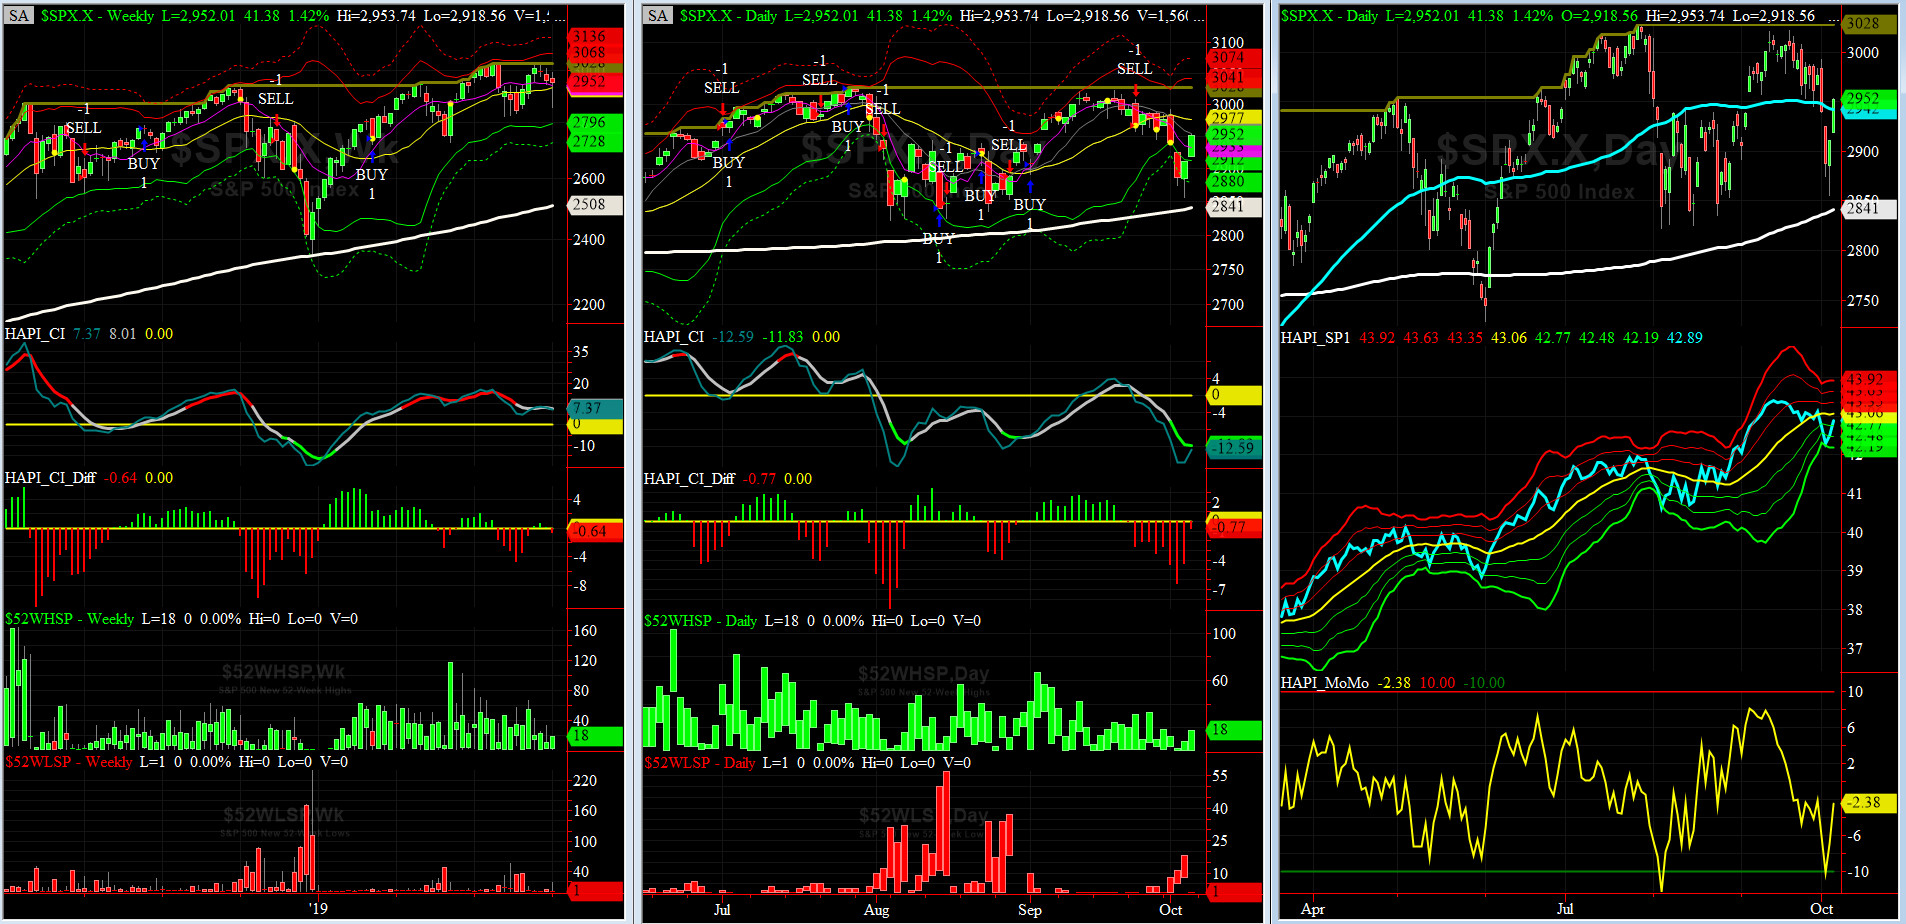
HA_SP1_Momo Chart
WEEKLY Timing Model = on a BUY Signal since Friday, March 8, 2019 CLOSE at 2743
DAILY Timing Model = on a SELL Signal since Tuesday, September 24, 2019 CLOSE at 2966
Max SPX 52wk-highs reading last week = 19 (over 120-140, the local maxima is in)
Max SPX 52wk-Lows reading last week = 18 (over 40-60, the local minima is in)
HA_SP1 closed near its +0.5 sigma channels
HA_Momo = +2.14 (reversals most likely occur above +10 or below -10)
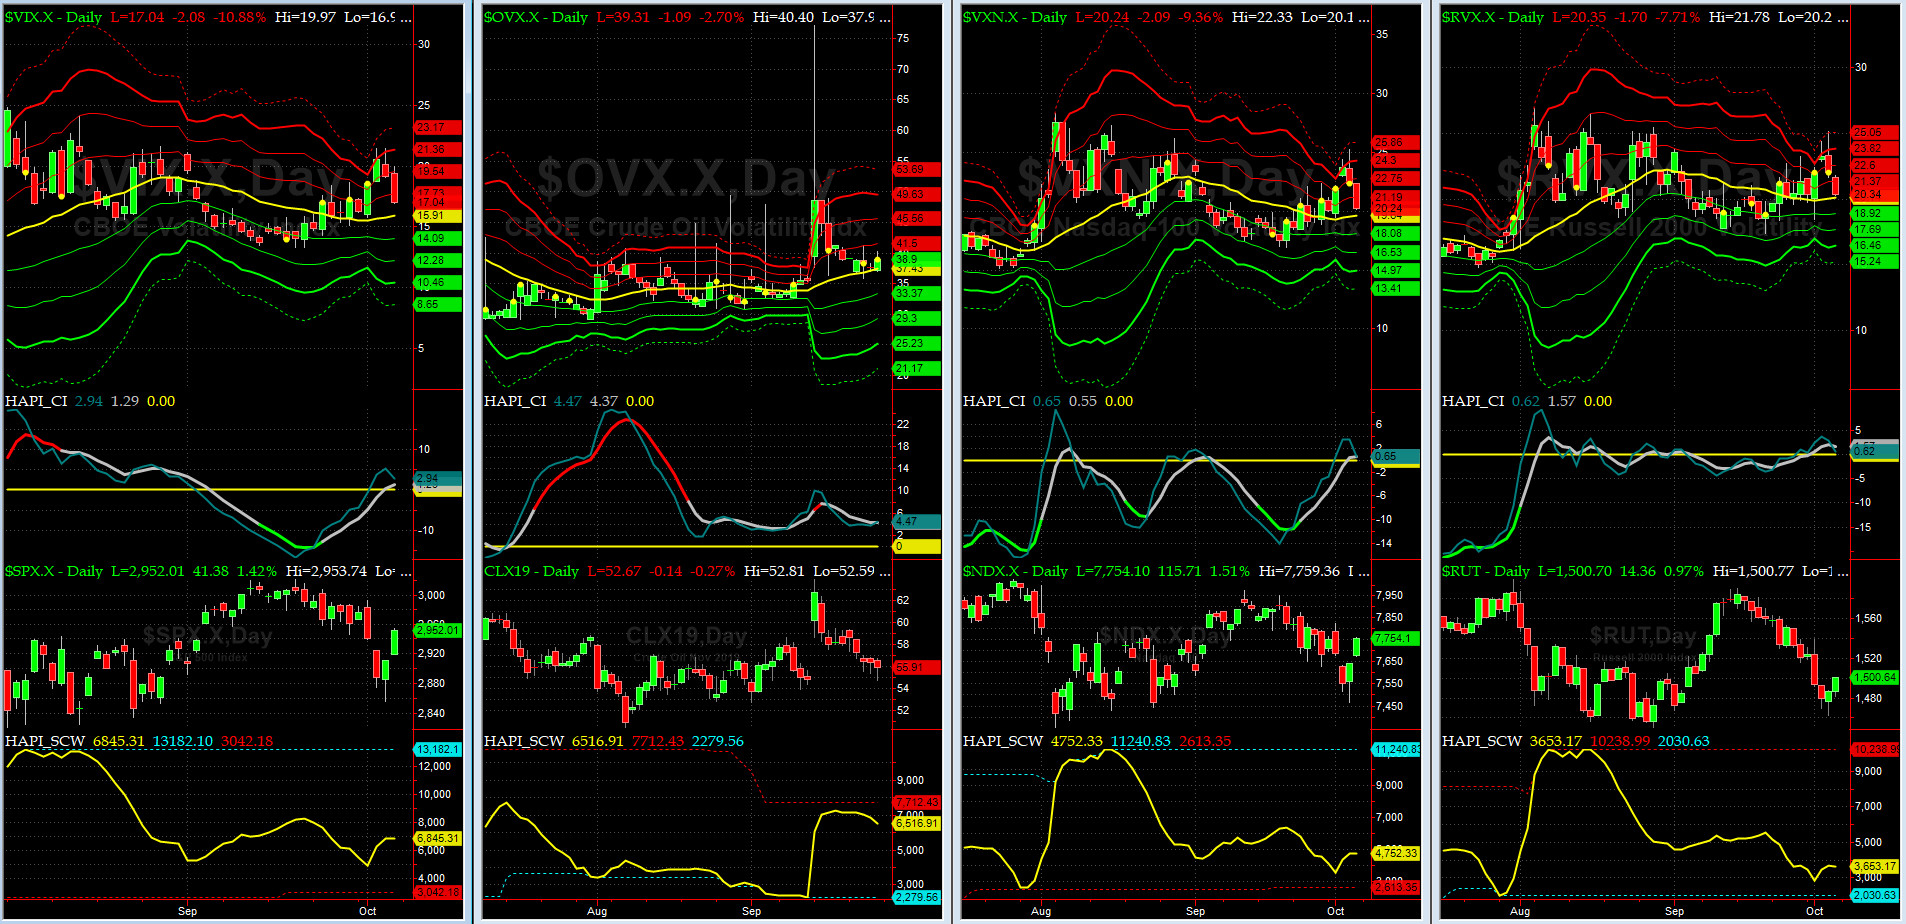
Vol of the Vols Chart
Spot VIX stood at 17.04 Friday night, a tad below its +1 sigma (remember it's the VIX volatility pattern aka "its sigma channels" that matters, and not the level of VIX itself (this is per Dr. Robert Whaley, a great mentor and inventor of original VIX, now called VXO). VIX usually peaks around a test of its +4 sigma).
Last week VIX went up to its +3 sigma (about 21.5) and then eased off into the weekend. IMHO, we are NOT done yet in this shockwave but who knows. Stay alert.

5-day TRIN & TRINQ Charts
NYSE 5-day TRIN is in clearly a BUY signal here while NASDAQ 5-day TRINQ is clearly in the SELL zone. We must confess we have NOT seen such bifurcation before.

Components of SPX above their respective 200-day MA Chart
This scoring indicator closed at 63.5% after a massive 10-pt drop in one week. We thank Grumpino for helping out ALL index day-traders.
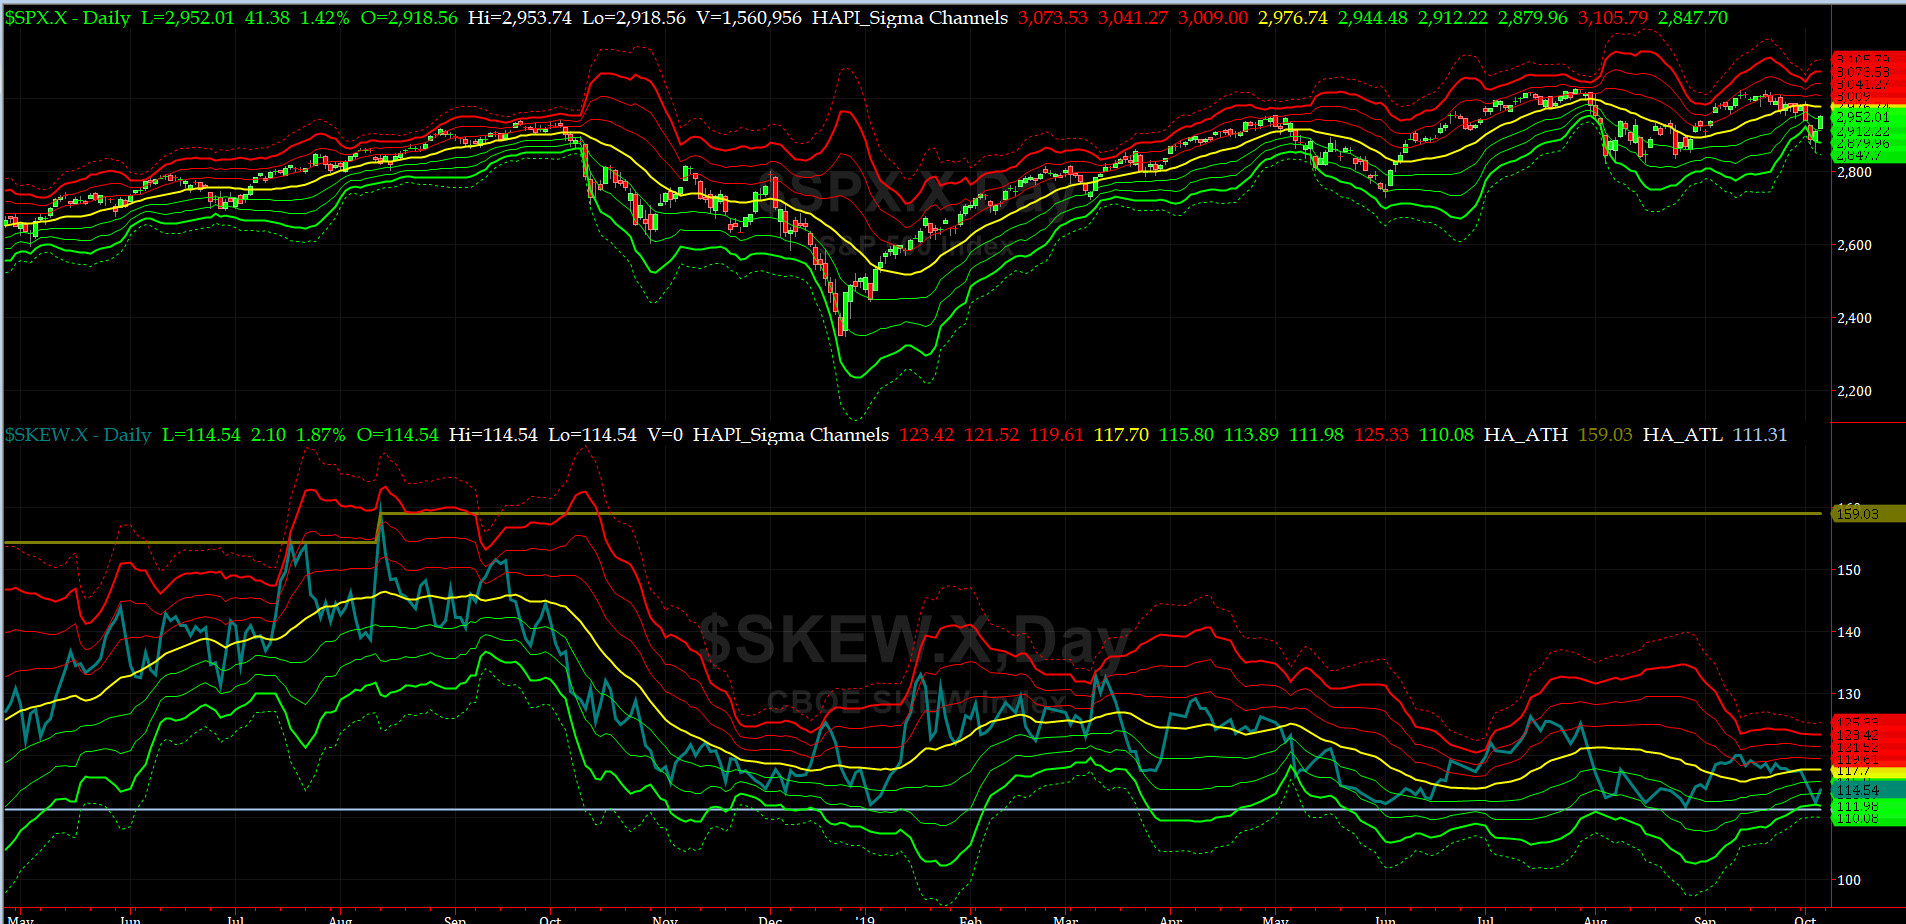
SPX SKEW (Downside Tail Risk) Chart
On Friday, SPX SKEW (Downside Tail Risk) rose pretty sharply to 114.5, now just a tad above its -2 sigma (normal = 115, range 100-150).
All quiet on the Eastern & Mid-Western Fronts? our beloved HRH Capt. Tiko, KCPE, still says YES...
How to interpret the value of SPX SKEW? (from CBOE white paper on SKEW)


3-month VIX Futures Spread(VX) Chart
This popular timing indicator for identifying tradable bottoms, (now long SEP19, & short DEEZ19 VIX Futures) hit -1.58 Friday Close . Again, that is a NEUTRAL signal.
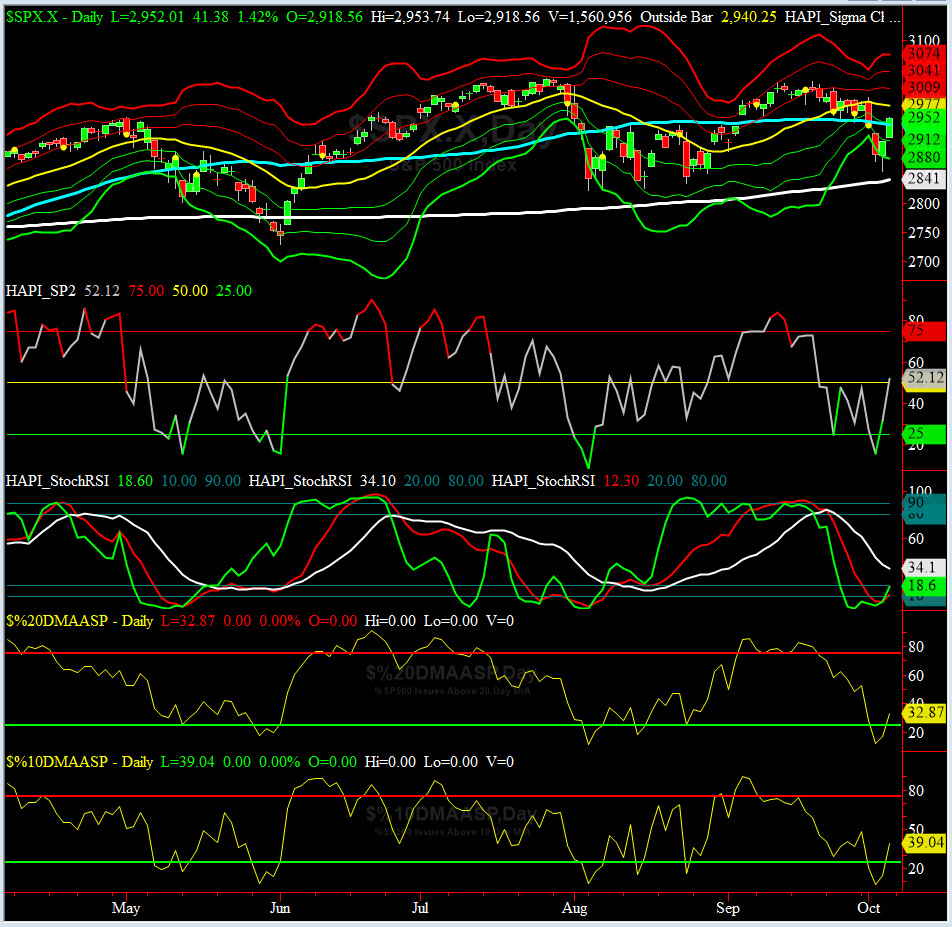
HA_SP2 Chart
HA_SP2 = 52.1 (Buy signal <= 25, Sell Signal >= 75)
That's also heading up and currently occupying the NEUTRAL zone.
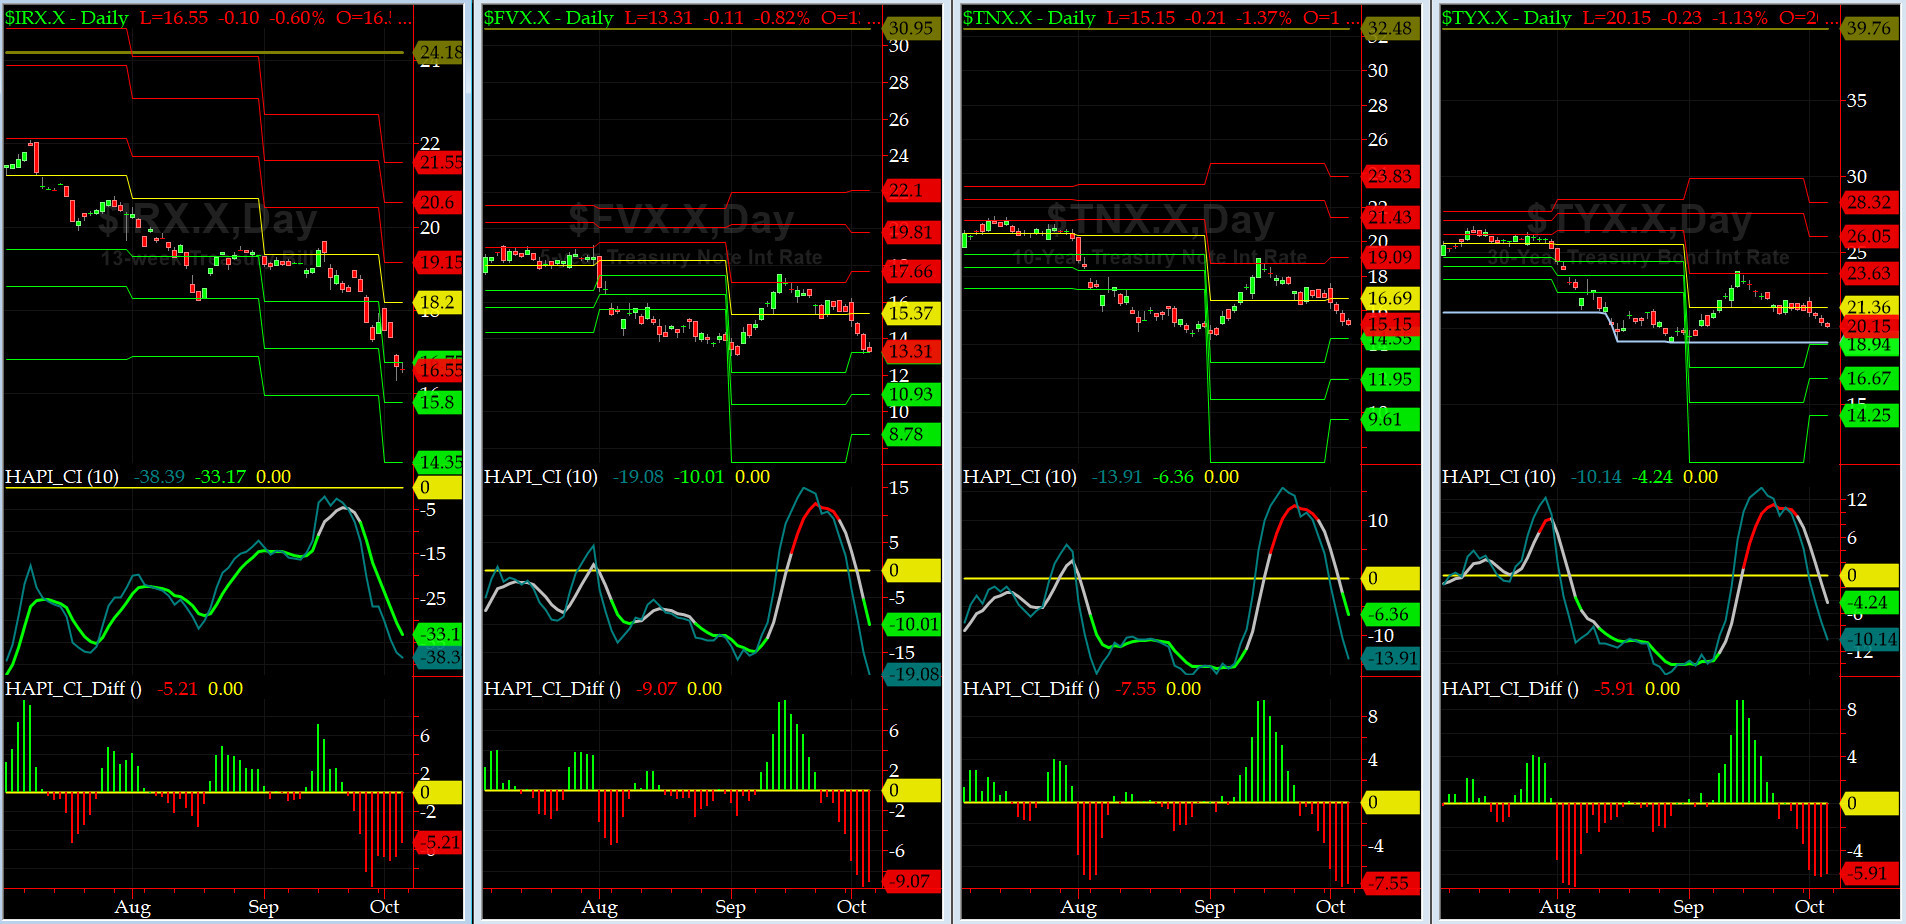
US Treasury T-Notes & T-Bonds Yields Chart
The Yield Curve (both front and back end) eased off more last week. We hear Maury is about to change his party and go with Dems. He has had it with Grumpino (his Vig income is down heavy).
Fari Hamzei
|
|
|
|
|
|
Customer Care:
|
|
|
|
|
|
|
 |
 |
|
 |
|
 |
 |
 |
HA YouTube Channel ::: HA Blog ::: Testimonials ::: Tutorials & FAQs ::: Privacy Policy
|
Trading Derivatives (Options & Futures) contains substantial risk and is not for every investor. An investor could potentially lose all or more than his/her initial investment.
Only risk capital should be used for trading and only those with sufficient risk capital should consider trading derivatives. Past performance is not
necessarily indicative of future results. Testimonials appearing on this website may not be representative of other clients or customers
and are not a guarantee of future performance or success.
|
| (c) 1998-2025, Hamzei Analytics, LLC.® All Rights Reserved. |
|
|