Investment Advice via real time put call ratio real time investment advice
Contact Us Home Products News About Members
Proactive Market Timing
 
Proactive Market Timing Service

Market Timer: Fari Hamzei

Executive Officer: @Fleet_Adm_Tiko

Editors: Nancy Scott

Here is the most recent How the PMT Market Bias Service Works Video

Weekly PMT Webinars on YouTube   PMT Archives   Current PMT Issue

Most Recent PMT vs SPX Performance Chart

Friday, November 15, 2019, 1600ET
Stopped Out Email -- Issue #313


SPX is trading at 3120.46 now
SPY is trading at 311.82 now

The midpoint price for our Long Put leg is trading approximately at 1.85 now
The midpoint price for our Short Put leg is trading approximately at 0.87 now

Therefore, the midpoint price for our Put Spread is trading approximately at 0.94 now

Fari Hamzei

Tuesday, November 12, 2019, 1536ET
Launch Command Email, Issue #313


SPX is trading at 3089.90 now
SPY is trading at 308.70 now

The midpoint price for our Long Put leg is trading approximately at 3.25 now
The midpoint price for our Short Put leg is trading approximately at 1.60 now

Therefore, the midpoint price for our Put Spread is trading approximately at 1.65 now

@Capt_Tiko: EXECUTE….. EXECUTE…..EXECUTE…………

Fari Hamzei

Tuesday, November 12, 2019, 1430ET
WEEKLY Support, Pivot & Resistance Levels for Issue #313

Tuesday, November 12, 2019, 1425 ET
Targets & Trade Setup for Issue #313

Our current Market Bias with Timer Digest is SHORT SPX as of OCT 22 from 2995
Our previous Market Bias was FLAT SPX as of OCT 15 from 2995


            Here are the trade parameters for this week:

SPX Money Management Stop for 100% of our position = 3120
SPX BreakEven Stop (Current Price) for last 20% of our position = 3092
SPX Primary Profit Target for first 80% of our position = 3040
SPX Secondary Profit Target for last 20% of our position = 3015


Action Asset Expiration Strike Option Mid-Point
BUY SPY Friday DEC 6 309 Puts 3.19
SELL SHORT SPY Friday DEC 6 303 Puts 1.68
You need to execute both legs and hold it as a Put-Spread.

Note A: Once the Primary Profit Target has been reached, traders are advised to close 80% of their position in order to lock in profits. The remaining balance can be carried over with a BreakEven STOP, based on the SPX level at the time of entry, in order to make the trade a zero-risk trade with the final position running to reach the Secondary Profit Target. Once either Secondary Profit or Money Management (BreakEven STOP after the 80% peel-off) is hit, our Option/ETF trade for that week is over. Go to Cash and wait for the next PMT Issue.

Note B: When we change our Market Bias with Timer Digest, You need to go FLAT asap. With PMT Pro, that is before the Close that day and with the basic PMT, at the open of the next day. The following trading day, we will issue new SPX targets and a new SPY options trade, as long our new market bias with Timer Digest is NOT flat.

Fari Hamzei

Monday, November 11, 2019, 1945ET
Market Timing Charts, Analysis & Commentary for Issue #313


Timer Charts of S&P-500 Cash Index (SPX) + NASDAQ-100 Cash Index (NDX)

Most recent S&P-500 Cash Index (SPX) Close: 3087 up +26 (up +0.87%) for the six trading days ending on Monday, November 11, 2019, which closed at its +1.5 sigma.

DJIA ALL TIME INTRADAY HIGH = 27775 (reached on Thursday, November 7, 2019)
DJT ALL TIME INTRADAY HIGH = 11623 (reached on Friday, September 14, 2018)
SPX ALL TIME INTRADAY HIGH = 3098 (reached on Thursday, November 7, 2019)
NDX ALL TIME INTRADAY HIGH = 8272 (reached on Thursday, November 7, 2019)
RUT ALL TIME INTRADAY HIGH = 1742 (reached on Friday, August 31, 2018)

Current DAILY +2 Sigma SPX = 3109 with WEEKLY +2 Sigma = 3104
Current DAILY 0 Sigma SPX = 3037 with WEEKLY 0 Sigma = 2982
Current DAILY -2 Sigma SPX = 2964 with WEEKLY -2 Sigma = 2860

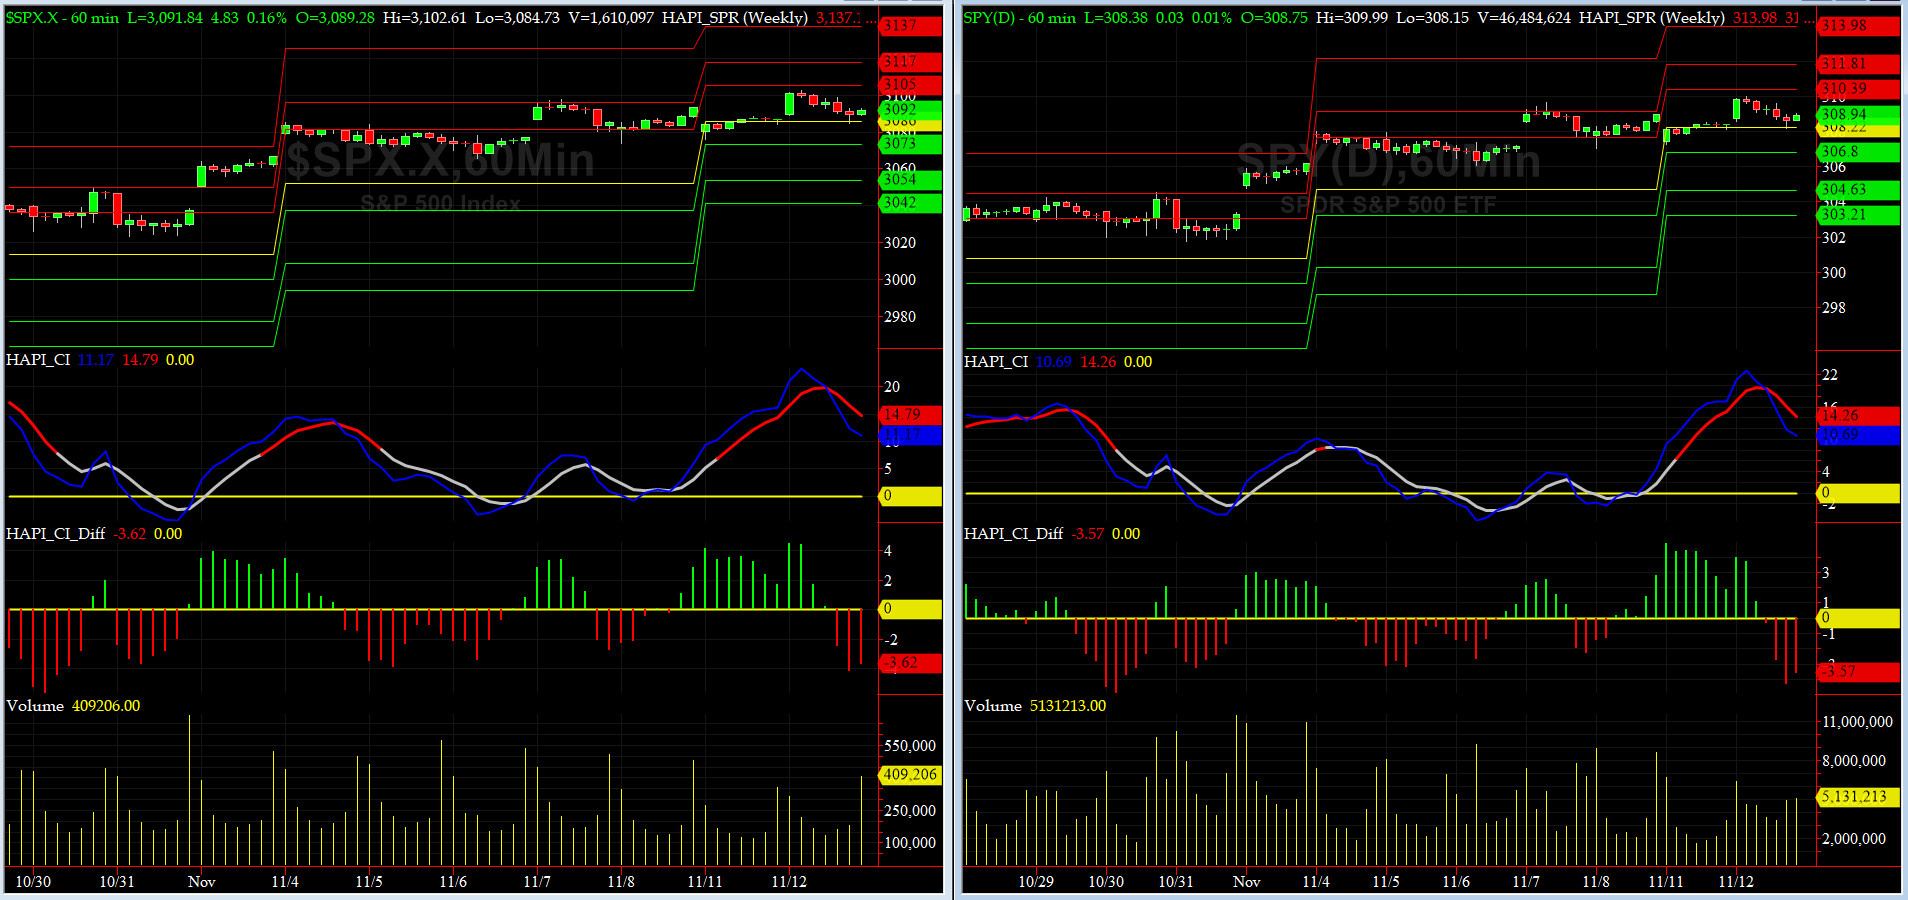
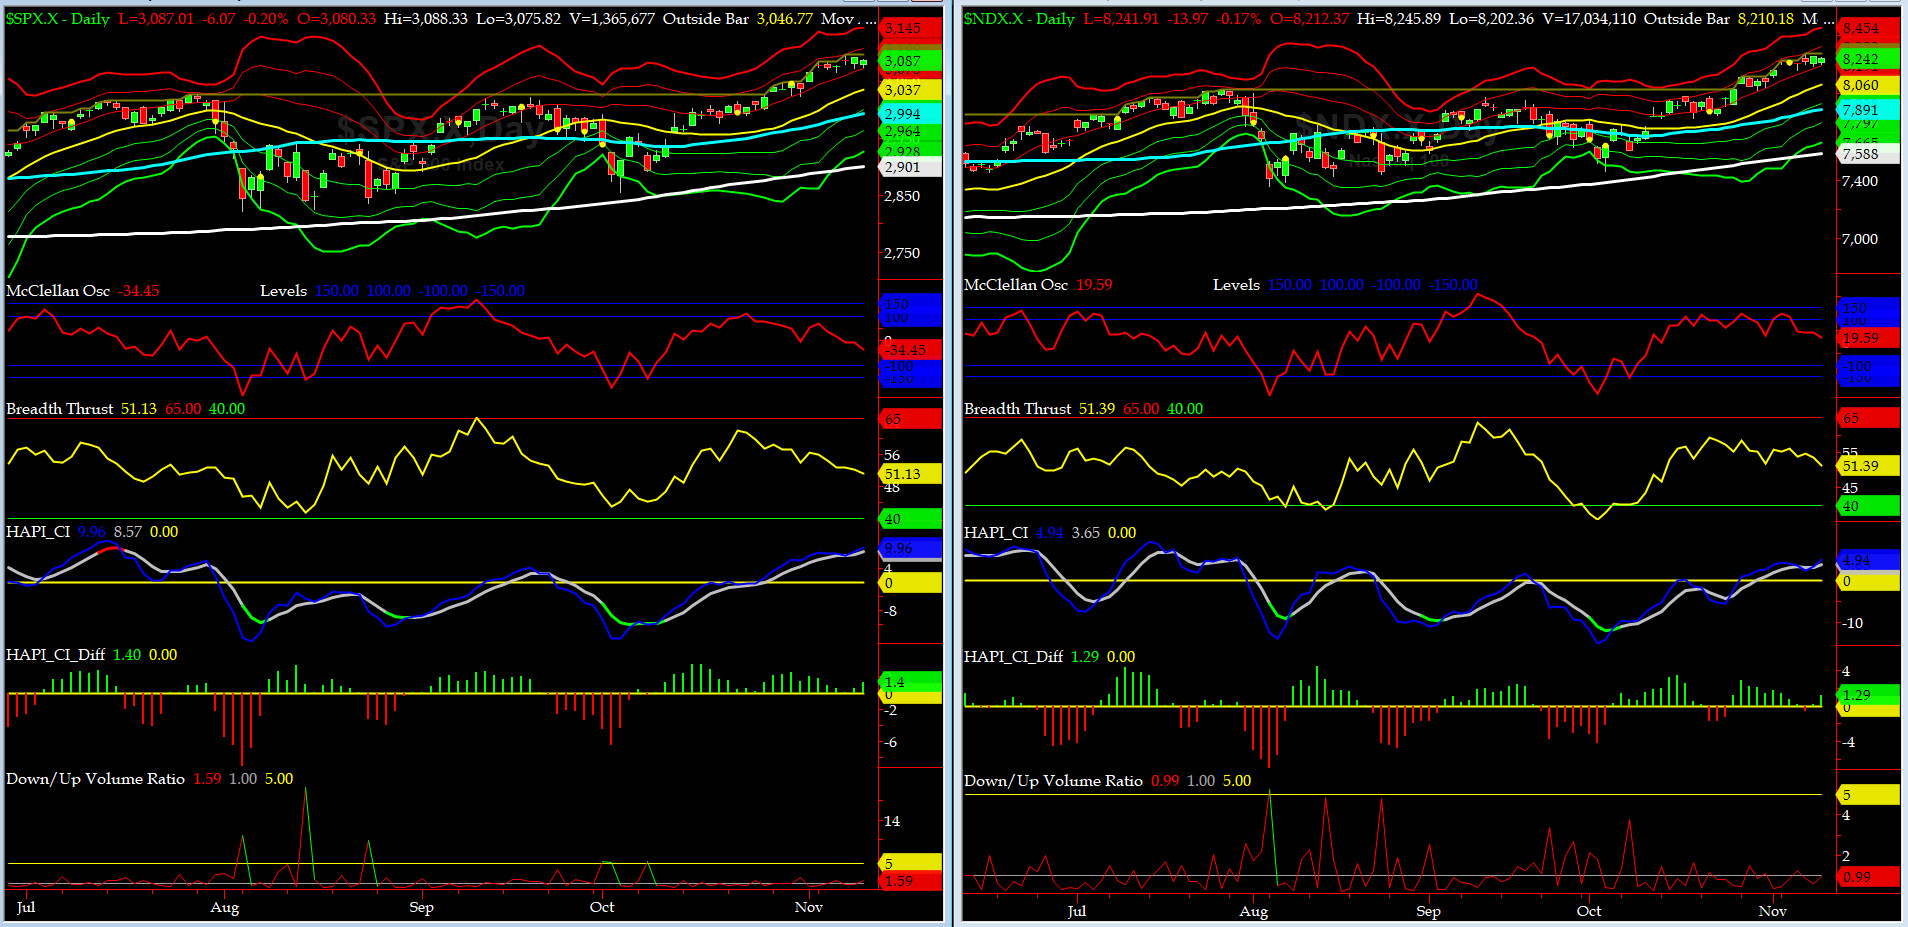
NYSE McClellan Oscillator = -34 (-150 is start of the O/S area; around -275 to -300 area or lower, we go into the “launch-pad” mode; over +150, we are in O/B area)
NYSE Breadth Thrust = 51.1 (40 is considered as oversold and 65 as overbought)

Bearish Divergences are showing on almost every chart. We will stay short SPX. We should be nearing some form of fireworks any day now.


DeTrenders Charts for SPX, NDX, TRAN & RUT Indices

200-Day MA DJ TRAN = 10,419 or 5.9% ABOVE the DJ TRAN (max observed in last 7 yrs = 20.2%, min = -20.3%)
200-Day MA RUT = 1541 or 3.4% ABOVE RUT (max observed in last 7 yrs = 21.3%, min = -22.6%)

50-Day MA SPX = 2993 or 3.1% BELOW SPX (max observed in last 7 yrs = +8.6%, min = -9.3%)
200-Day MA SPX = 2900 or 6.4% BELOW SPX (max observed in last 7 yrs = 15.2%, min = -14%)

DJ Transportation Index (proxy for economic conditions 6 to 9 months hence) has had a great run-up in the last 2 weeks.

Russell 2000 Small Caps Index (proxy for Risk ON/OFF) also has had a somewhat of a solid run-up in the last 2 weeks displaying a bearish divergence. RISK ON remains so-so.

All EIGHT of our EIGHT DeTrenders are in the POSITIVE territory. The DeTrenders for DJ Tran & RUT will continue to be harbingers of future price behavior in broad indices.


HA_SP1_Momo Chart

WEEKLY Timing Model = on a BUY Signal since Friday, March 8, 2019 CLOSE at 2743
DAILY Timing Model = on a BUY Signal since Friday, October 11, 2019 CLOSE at 2970
Max SPX 52wk-highs reading last week = 68 (over 120-140, the local maxima is in)
Max SPX 52wk-Lows reading last week = 5 (over 40-60, the local minima is in)
HA_SP1 closed near its +1 sigma channels
HA_Momo = -0.53 (reversals most likely occur above +10 or below -10)


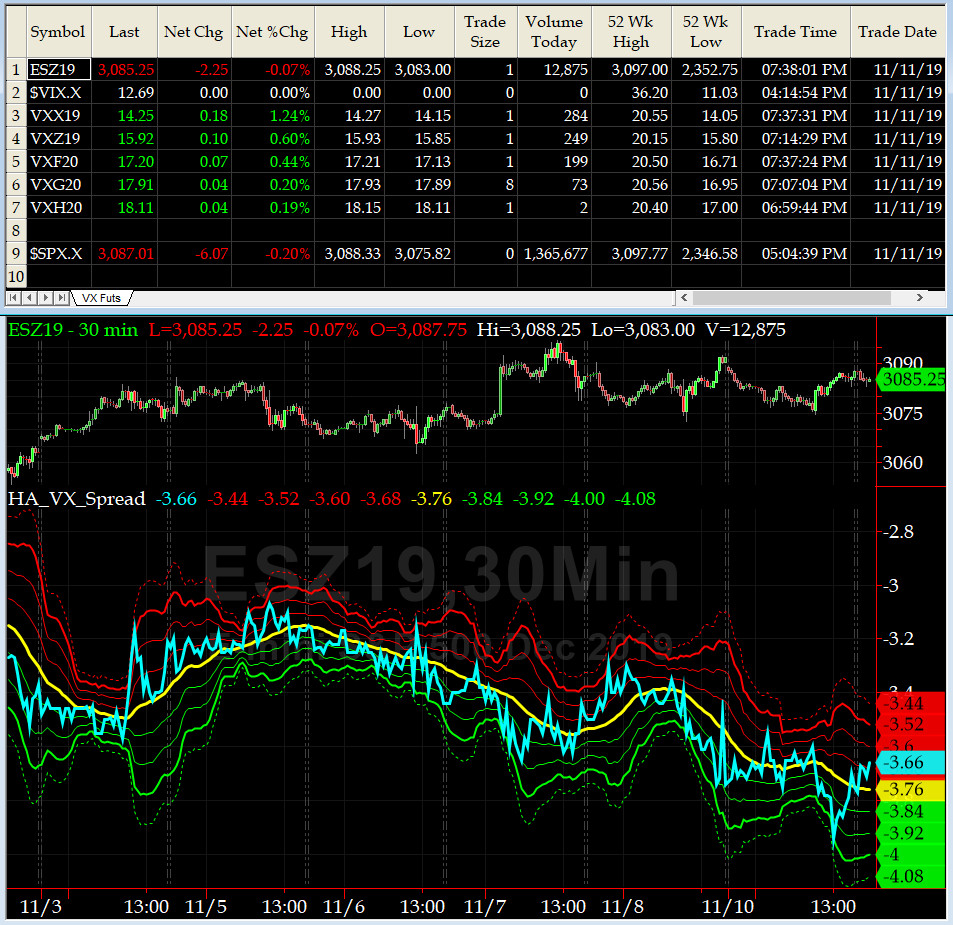
3-month VIX Futures Spread(VX) Chart

This popular timing indicator for identifying tradable bottoms, (now long NOV19, & short FEB20 VIX Futures) hit -3.7 today at the Close. We are clearly at overbought zone here.


HA_SP2 Chart

HA_SP2 = 73.8 (Buy signal <= 25, Sell Signal >= 75)

This indicator has shows signs that the overall market is OVERBOUHT & tired [and could be susceptible to a pullback].

Fari Hamzei


Customer Care:


Chat with Fari on TradeStation.com Fari Hamzei writes for CBOE Options Hub on event-deriven basis       Futures & Options for Stock Indices
HA YouTube Channel  :::  HA Blog  :::  Testimonials  :::  Tutorials & FAQs  :::  Privacy Policy
(c) 1998-2024, Hamzei Analytics, LLC.   All Rights Reserved.