|
Wednesday, December 25, 2019, 2345ET
Market Timing Charts, Analysis & Commentary for Issue #316
Timer Charts of S&P-500 Cash Index (SPX) + NASDAQ-100 Cash Index (NDX)
Most recent S&P-500 Cash Index (SPX) Close: 3223 up +103 (up +3.3%) for the 12 trading days ending on Tuesday, December 24, 2019, which closed very near its +2 sigma.
DJIA ALL TIME INTRADAY HIGH = 28609 (reached on Friday, December 20, 2019)
DJT ALL TIME INTRADAY HIGH = 11623 (reached on Friday, September 14, 2018)
SPX ALL TIME INTRADAY HIGH = 3227 (reached on Monday, December 23, 2019)
NDX ALL TIME INTRADAY HIGH = 8711 (reached on Monday, November 23, 2019)
RUT ALL TIME INTRADAY HIGH = 1742 (reached on Friday, August 31, 2018)
Current DAILY +2 Sigma SPX = 3239 with WEEKLY +2 Sigma = 3250
Current DAILY 0 Sigma SPX = 3161 with WEEKLY 0 Sigma = 3040
Current DAILY -2 Sigma SPX = 3083 with WEEKLY -2 Sigma = 2830
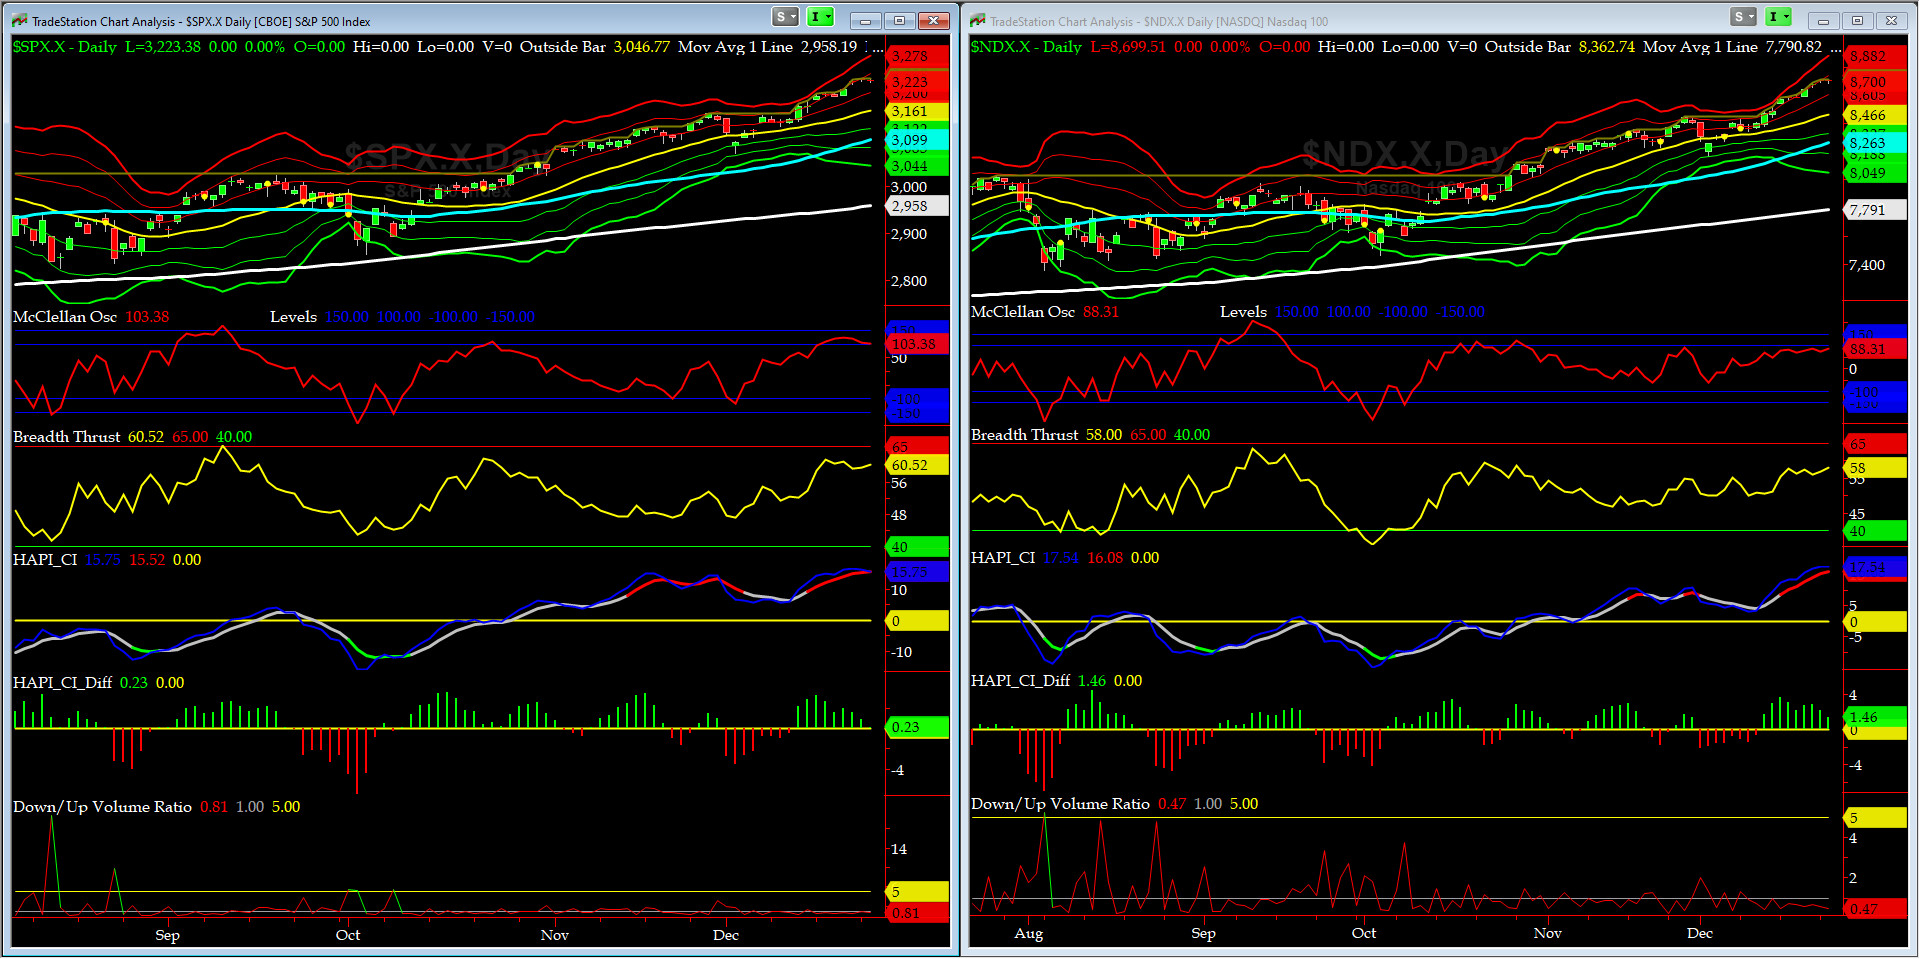
NYSE McClellan Oscillator = +103 (-150 is start of the O/S area; around -275 to -300 area or lower, we go into the �launch-pad� mode; over +150, we are in O/B area)
NYSE Breadth Thrust = 60.5 (40 is considered as oversold and 65 as overbought)
This market is BID no matter what..... very scary, but we go with the flow. We have to. The old Wall Street adage applies here: "Trend is Your Friend..."
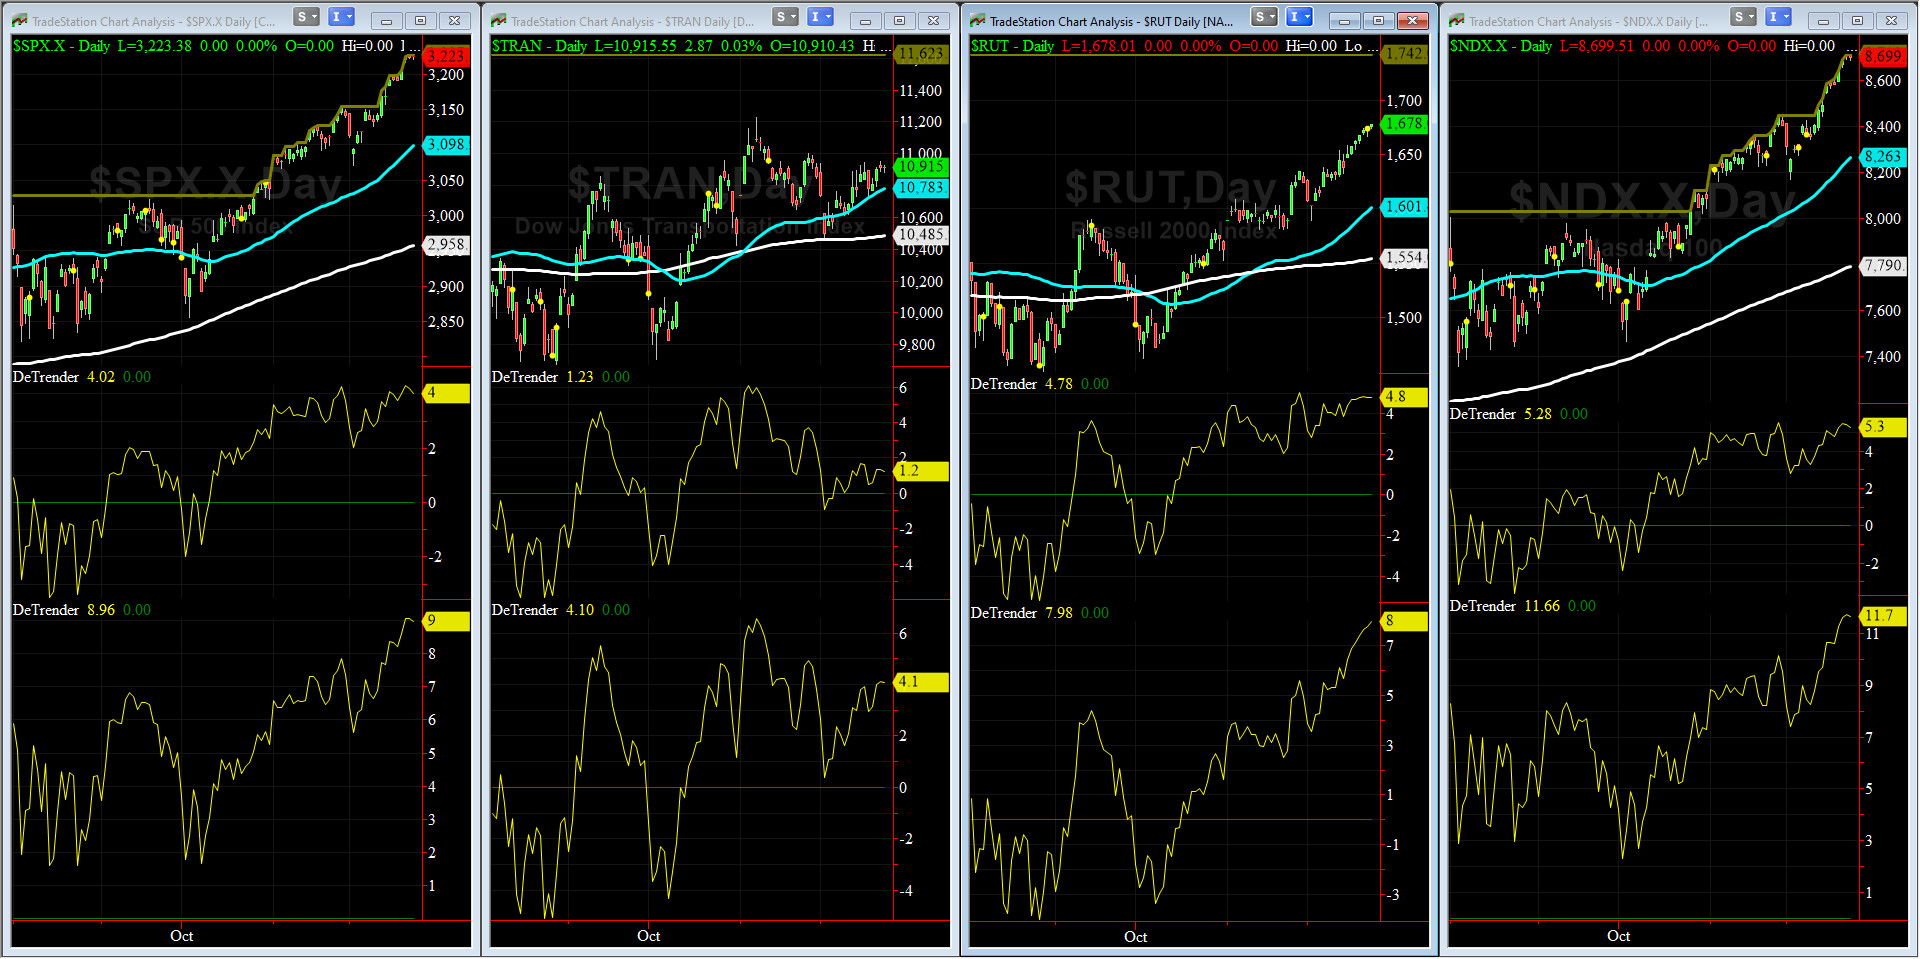
DeTrenders Charts for SPX, NDX, TRAN & RUT Indices
200-Day MA DJ TRAN = 10,485 or 4.1% ABOVE the DJ TRAN (max observed in last 7 yrs = 20.2%, min = -20.3%)
200-Day MA RUT = 1554 or 8% ABOVE RUT (max observed in last 7 yrs = 21.3%, min = -22.6%)
50-Day MA SPX = 3098 or 4% BELOW SPX (max observed in last 7 yrs = +8.6%, min = -9.3%)
200-Day MA SPX = 2958 or 8% BELOW SPX (max observed in last 7 yrs = 15.2%, min = -14%)
DJ Transportation Index (proxy for economic conditions 6 to 9 months hence) had a nice week but pulled back on Friday.
Russell 2000 Small Caps Index (proxy for Risk ON/OFF) had a great week but also pulled back on Friday. RISK ON remains so-so.
All EIGHT of our EIGHT DeTrenders are in the POSITIVE territory. The DeTrenders for DJ Tran & RUT will continue to be harbingers of future price behavior in broad indices.
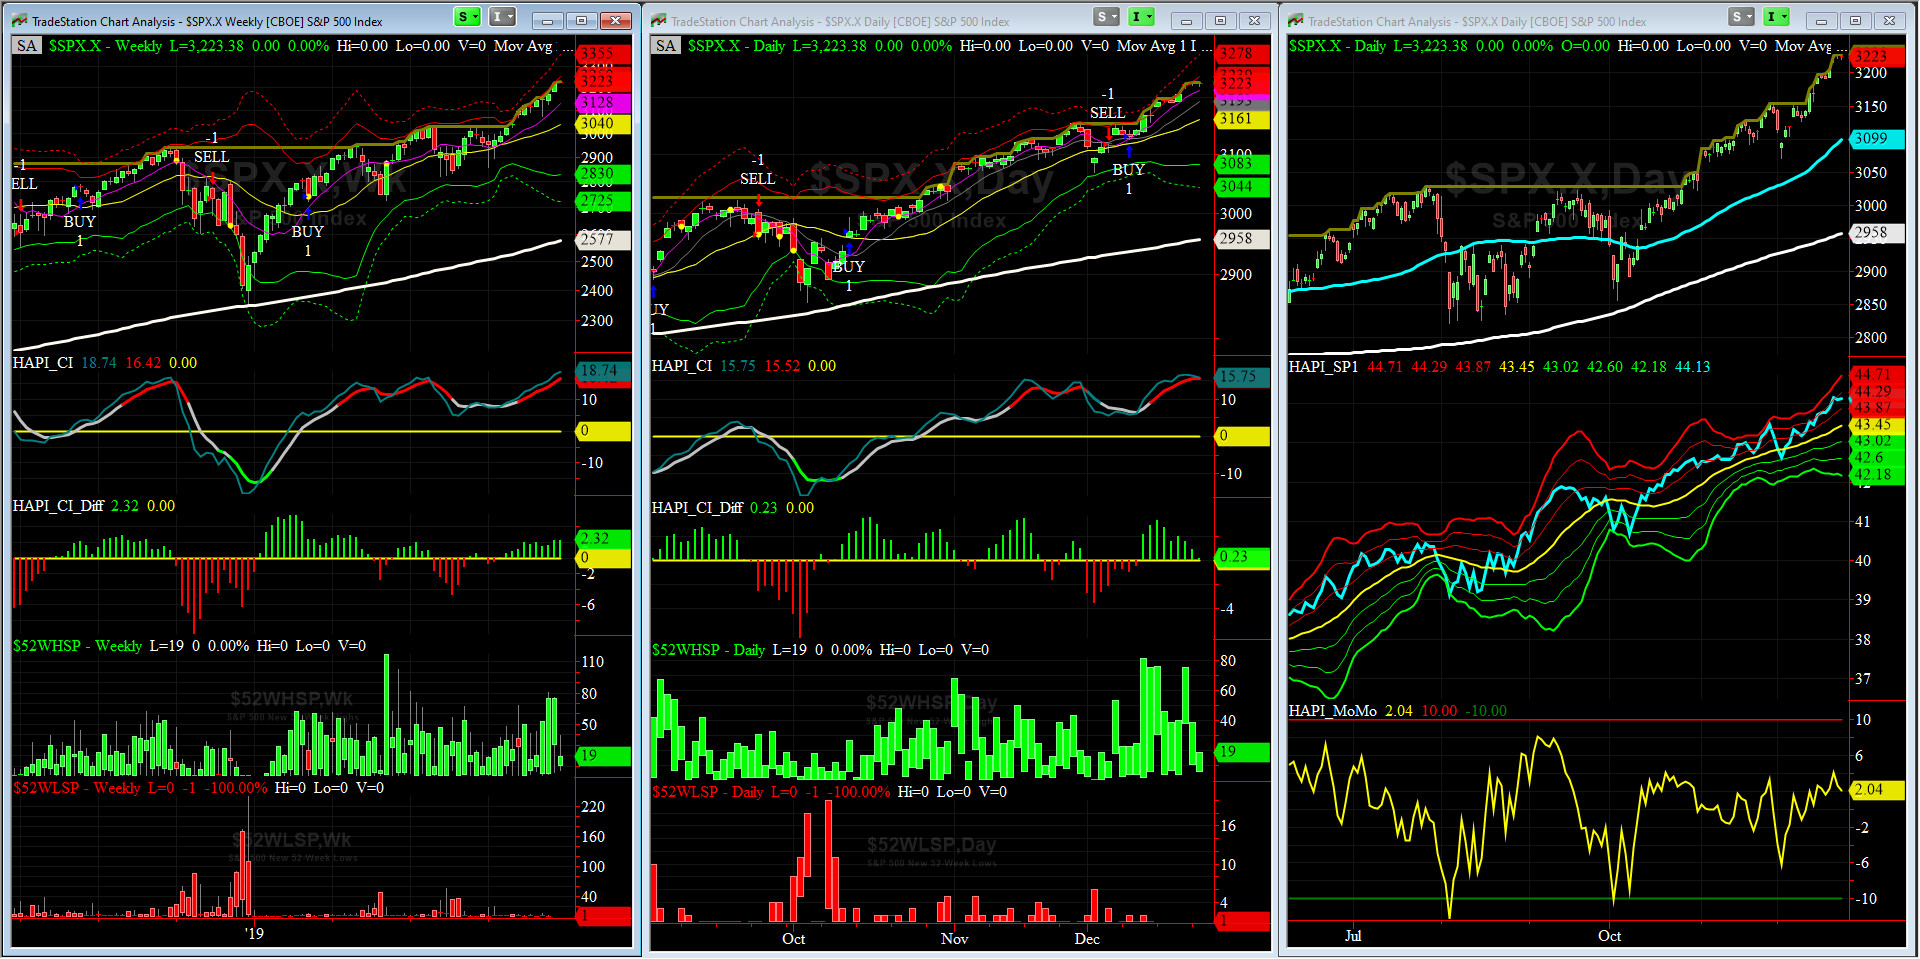
HA_SP1_Momo Chart
WEEKLY Timing Model = on a BUY Signal since Friday, March 8, 2019 CLOSE at 2743
DAILY Timing Model = on a BUY Signal since Tuesday, December 10, 2019 CLOSE at 3132
Max SPX 52wk-highs reading last week = 75 (over 120-140, the local maxima is in)
Max SPX 52wk-Lows reading last week = 2 (over 40-60, the local minima is in)
HA_SP1 closed near its +1.5 sigma channels
HA_Momo = +2.04 (reversals most likely occur above +10 or below -10)

SPX SKEW (Downside Tail Risk) Chart
Since December 3, SPX SKEW (Downside Tail Risk) has risen pretty sharply to 144, now about its +2 sigma (normal = 115, range 100-150).
All quiet on the Eastern & Mid-Western Fronts? our beloved HRH Capt. Tiko, KCPE, still says NO MAS.
How to interpret the value of SPX SKEW? (from CBOE white paper on SKEW)

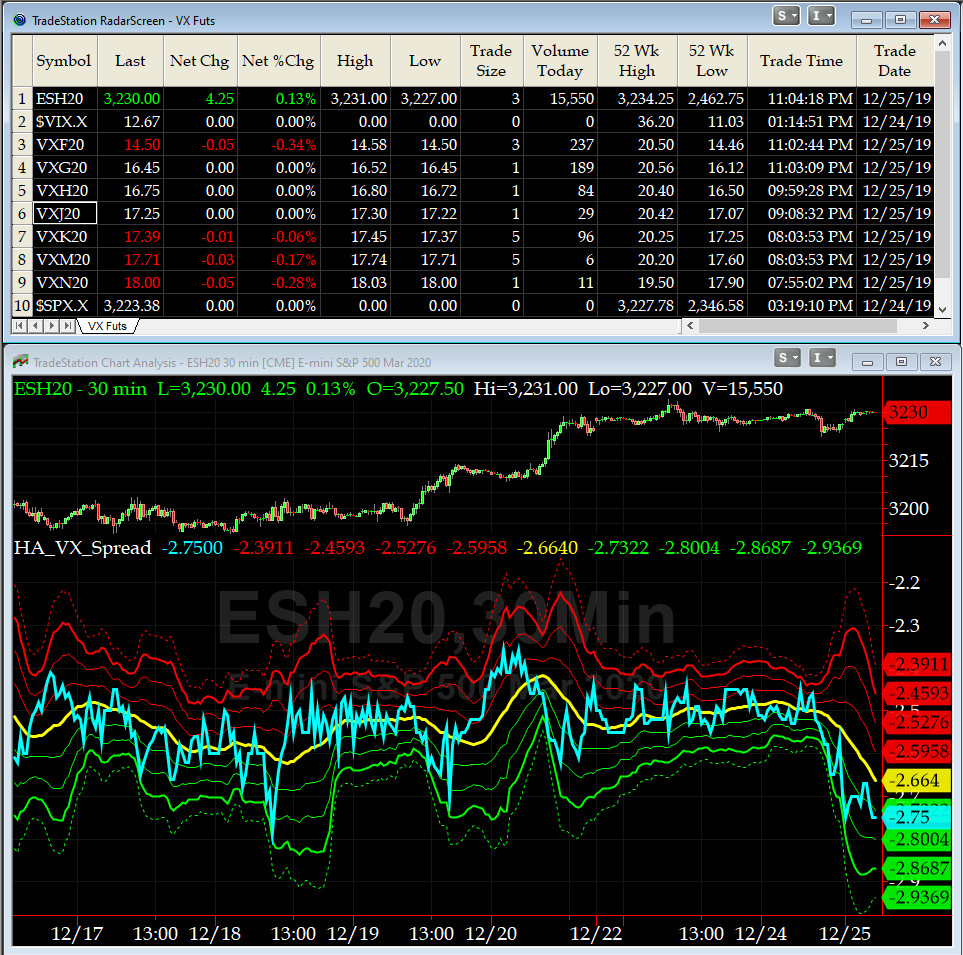
3-month VIX Futures Spread(VX) Chart
This popular timing indicator for identifying tradable bottoms, (now long JAN20, & short APR20 VIX Futures) hit -2.7 today at the Close. We are still in the overbought zone here.
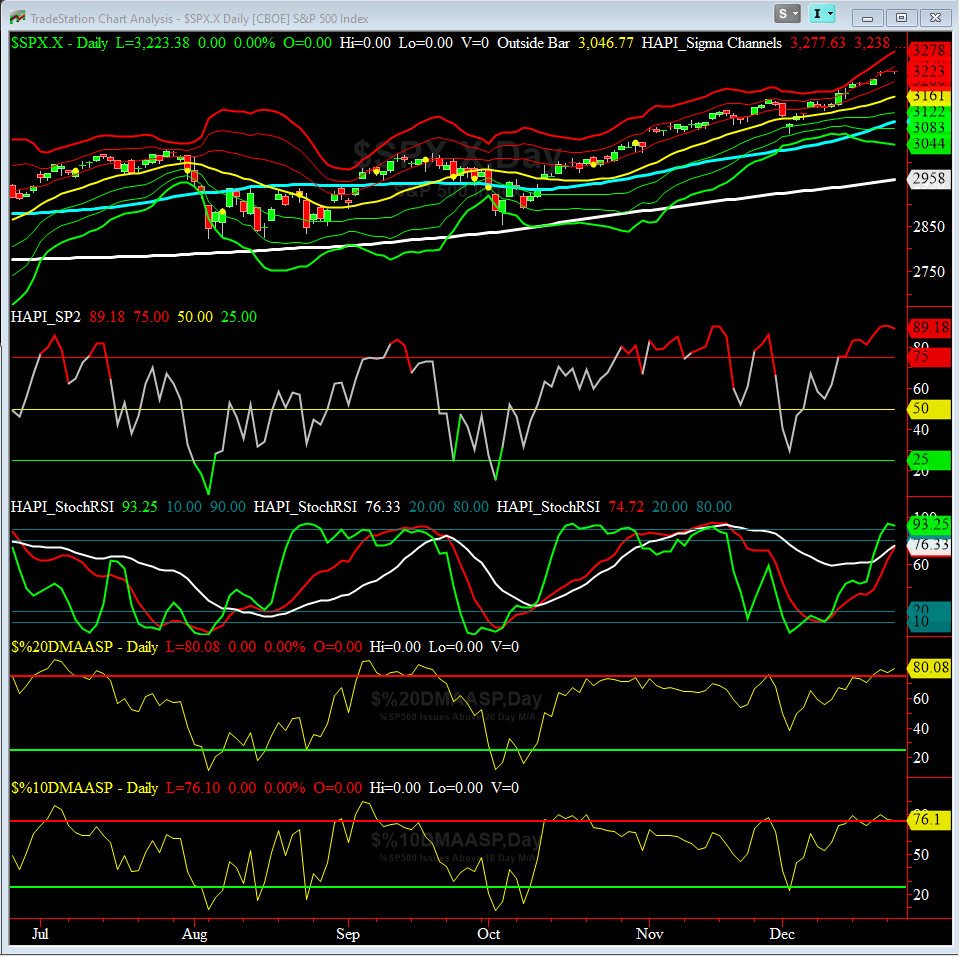
HA_SP2 Chart
HA_SP2 = 89.2 (Buy signal <= 25, Sell Signal >= 75)
This indicator also shows we were in overbought zone. We need to be vigilant here with our long [high-beta] positions.
Fari Hamzei
|


 Proactive Market Timing


