Investment Advice via real time put call ratio real time investment advice
Contact Us Home Products News About Members
Proactive Market Timing
 
Proactive Market Timing Service

Market Timer: Fari Hamzei

Executive Officer: @Fleet_Adm_Tiko

Editors: Nancy Scott

Here is the most recent How the PMT Market Bias Service Works Video

Weekly PMT Webinars on YouTube   PMT Archives   Current PMT Issue

Most Recent PMT vs SPX Performance Chart

Wednesday, January 8, 2020, 1152ET
Stopped Out for Issue #317


PMT Money Management STOP of SPX at 3260 was hit as NYC was getting ready to go to Lunch

At that time, the following prices were observed:

SPX traded at 3260
SPY traded at 325.03

The midpoint price for our Long Put leg was approximately at 2.88
The midpoint price for our Short Put leg was approximately at 1.30

The midpoint price for our Put Spread was approximately at 1.58

Our Market Bias with Timer Digest still remains SHORT SPX

Fari Hamzei

Monday, January 6, 2020, 1506ET
Launch Command Email, Issue #317


SPX is trading at 3239.50 now
SPY is trading at 322.94 now

The midpoint price for our Long Put leg is trading approximately at 4.10 now
The midpoint price for our Short Put leg is trading approximately at 2.07 now

Therefore, the midpoint price for our Put Spread is trading approximately at 2.03 now

Fari Hamzei

Monday, January 6, 2020, 1420ET
WEEKLY Support, Pivot & Resistance Levels for Issue #317

Monday, January 6, 2020, 1415ET
Targets & Trade Setup for Issue #317

Our current Market Bias with Timer Digest is SHORT SPX as of JAN 3 from 3235
Our previous Market Bias was FLAT SPX as of JAN 2 from 3258


            Here are the trade parameters for this week:

SPX Money Management Stop for 100% of our position = 3260
SPX BreakEven Stop (Current Price) for last 20% of our position = 3240
SPX Primary Profit Target for first 80% of our position = 3200
SPX Secondary Profit Target for last 20% of our position = 3170


Action Asset Expiration Strike Option Mid-Point
BUY SPY Friday JAN 31 324 Puts 4.10
SELL SHORT SPY Friday JAN 31 316 Puts 2.17
You need to execute both legs and hold it as a Put-Spread.

Note A: Once the Primary Profit Target has been reached, traders are advised to close 80% of their position in order to lock in profits. The remaining balance can be carried over with a BreakEven STOP, based on the SPX level at the time of entry, in order to make the trade a zero-risk trade with the final position running to reach the Secondary Profit Target. Once either Secondary Profit or Money Management (BreakEven STOP after the 80% peel-off) is hit, our Option/ETF trade for that week is over. Go to Cash and wait for the next PMT Issue.

Note B: When we change our Market Bias with Timer Digest, You need to go FLAT asap. With PMT Pro, that is before the Close that day and with the basic PMT, at the open of the next day. The following trading day, we will issue new SPX targets and a new SPY options trade, as long our new market bias with Timer Digest is NOT flat.

Fari Hamzei

Monday, January 6, 2019, 0900ET
Market Timing Charts, Analysis & Commentary for Issue #317


Timer Charts of S&P-500 Cash Index (SPX) + NASDAQ-100 Cash Index (NDX)

Most recent S&P-500 Cash Index (SPX) Close: 3234 up +11 (up +0.34%) for the 12 trading days ending on Tuesday, December 24, 2019, which closed very near its +2 sigma.

DJIA ALL TIME INTRADAY HIGH = 28871 reached on Thursday, January 2, 2020
DJT ALL TIME INTRADAY HIGH = 11623 reached on Friday, September 14, 2018
SPX ALL TIME INTRADAY HIGH = 3258 reached on Thursday, January 2, 2020
NDX ALL TIME INTRADAY HIGH = 8873 reached on Thursday, January 2, 2020
RUT ALL TIME INTRADAY HIGH = 1742 reached on Friday, August 31, 2018

Current DAILY +2 Sigma SPX = 3277 with WEEKLY +2 Sigma = 3275
Current DAILY 0 Sigma SPX = 3194 with WEEKLY 0 Sigma = 3058
Current DAILY -2 Sigma SPX = 3112 with WEEKLY -2 Sigma = 2841

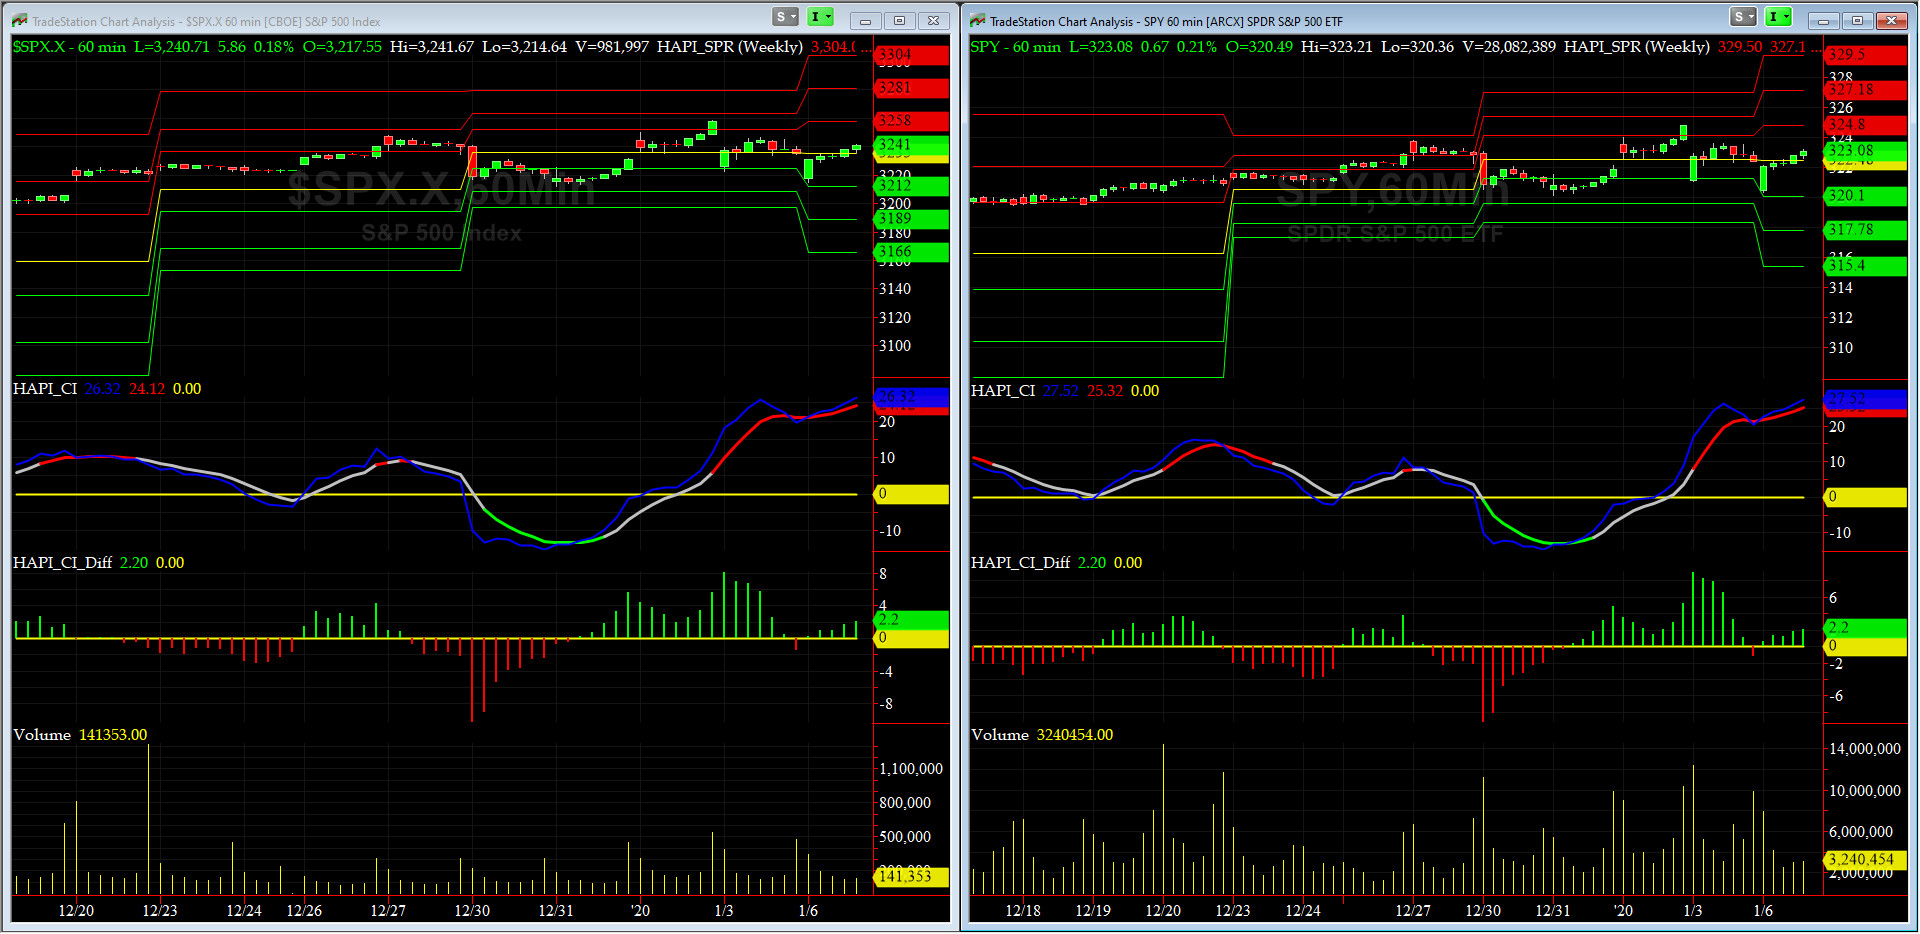
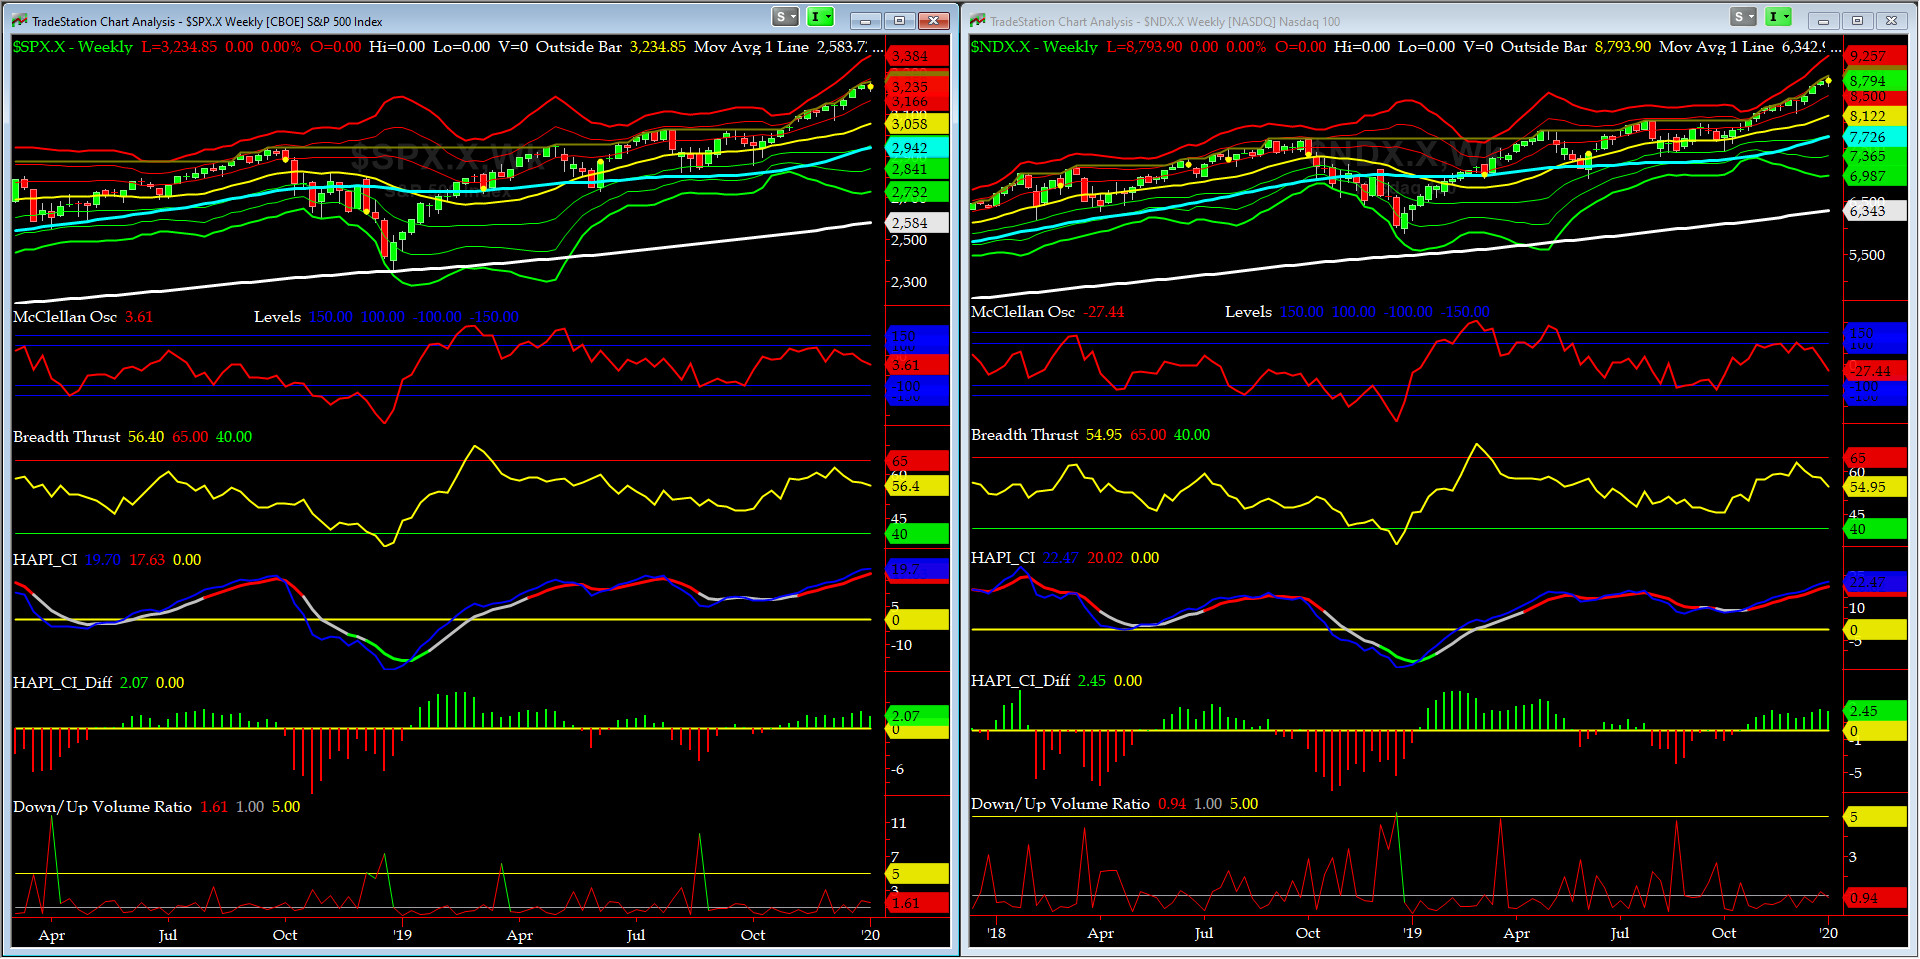
NYSE McClellan Oscillator = +35 (-150 is start of the O/S area; around -275 to -300 area or lower, we go into the “launch-pad” mode; over +150, we are in O/B area)
NYSE Breadth Thrust = 55.1 (40 is considered as oversold and 65 as overbought)

This market is BID no more..... as in the recent past, exogenous news have a way of taking over. stay tuned, we shall take one day at the time.


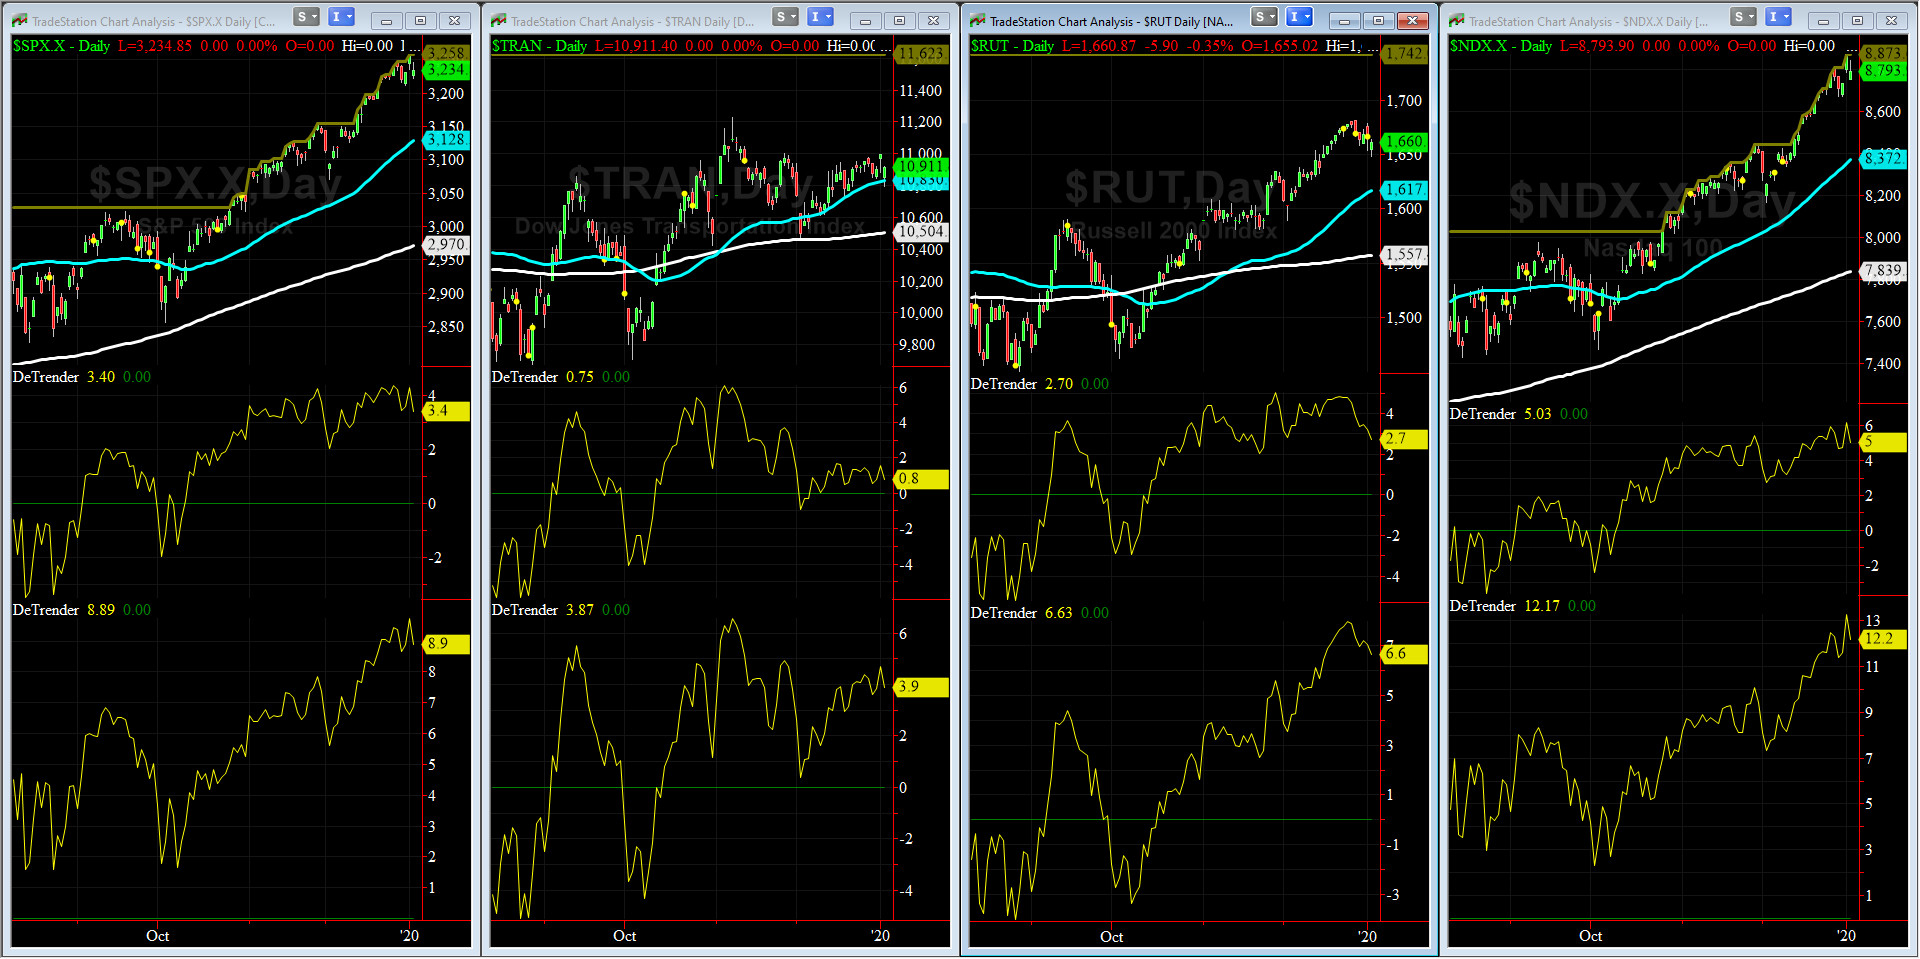
DeTrenders Charts for SPX, NDX, TRAN & RUT Indices

200-Day MA DJ TRAN = 10,504 or 3.9% ABOVE the DJ TRAN (max observed in last 7 yrs = 20.2%, min = -20.3%)
200-Day MA RUT = 1557 or 6.6% ABOVE RUT (max observed in last 7 yrs = 21.3%, min = -22.6%)

50-Day MA SPX = 3128 or 3.4% BELOW SPX (max observed in last 7 yrs = +8.6%, min = -9.3%)
200-Day MA SPX = 2970 or 8.9% BELOW SPX (max observed in last 7 yrs = 15.2%, min = -14%)

DJ Transportation Index (proxy for economic conditions 6 to 9 months hence) had a nice week but pulled back on Friday.

Russell 2000 Small Caps Index (proxy for Risk ON/OFF) had a great week but also pulled back on Friday. RISK ON remains so-so.

All EIGHT of our EIGHT DeTrenders are in the POSITIVE territory. The DeTrenders for DJ Tran & RUT will continue to be harbingers of future price behavior in broad indices.
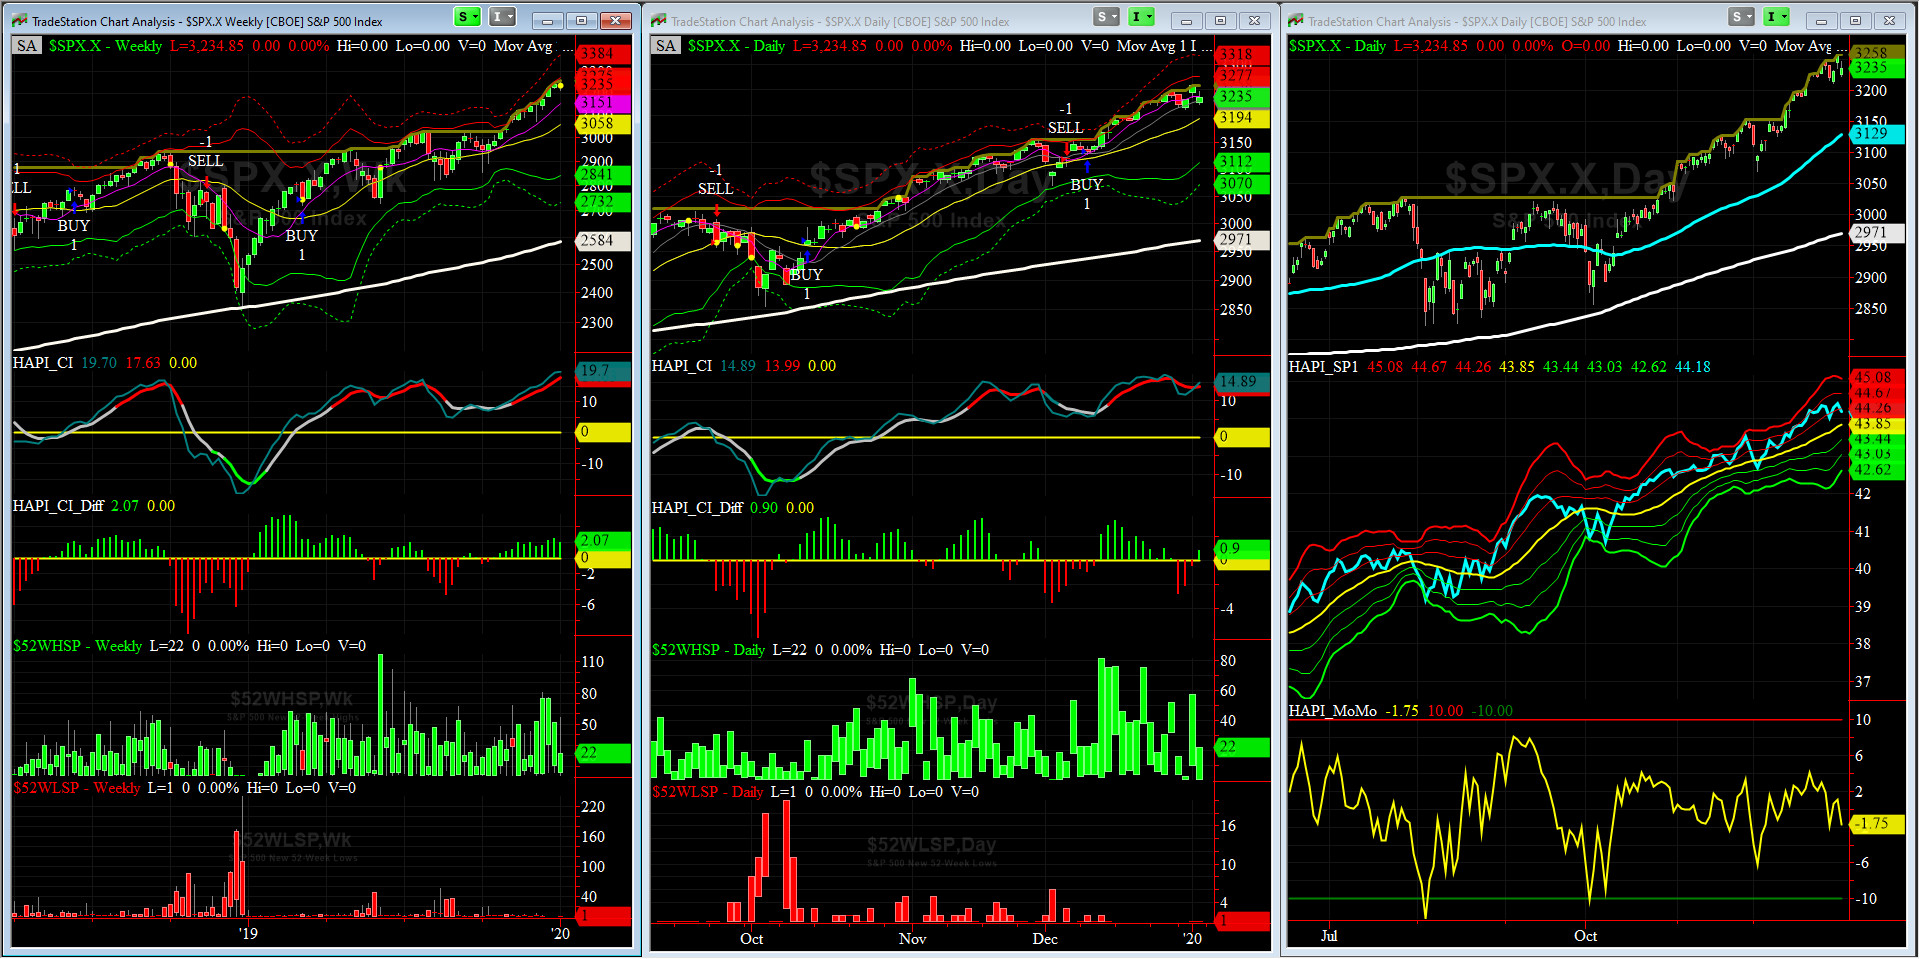


HA_SP1_Momo Chart

WEEKLY Timing Model = on a BUY Signal since Friday, March 8, 2019 CLOSE at 2743
DAILY Timing Model = on a BUY Signal since Tuesday, December 10, 2019 CLOSE at 3132
Max SPX 52wk-highs reading last week = 57 (over 120-140, the local maxima is in)
Max SPX 52wk-Lows reading last week = 1 (over 40-60, the local minima is in)
HA_SP1 closed near its +1 sigma channels
HA_Momo = -1.75 (reversals most likely occur above +10 or below -10)


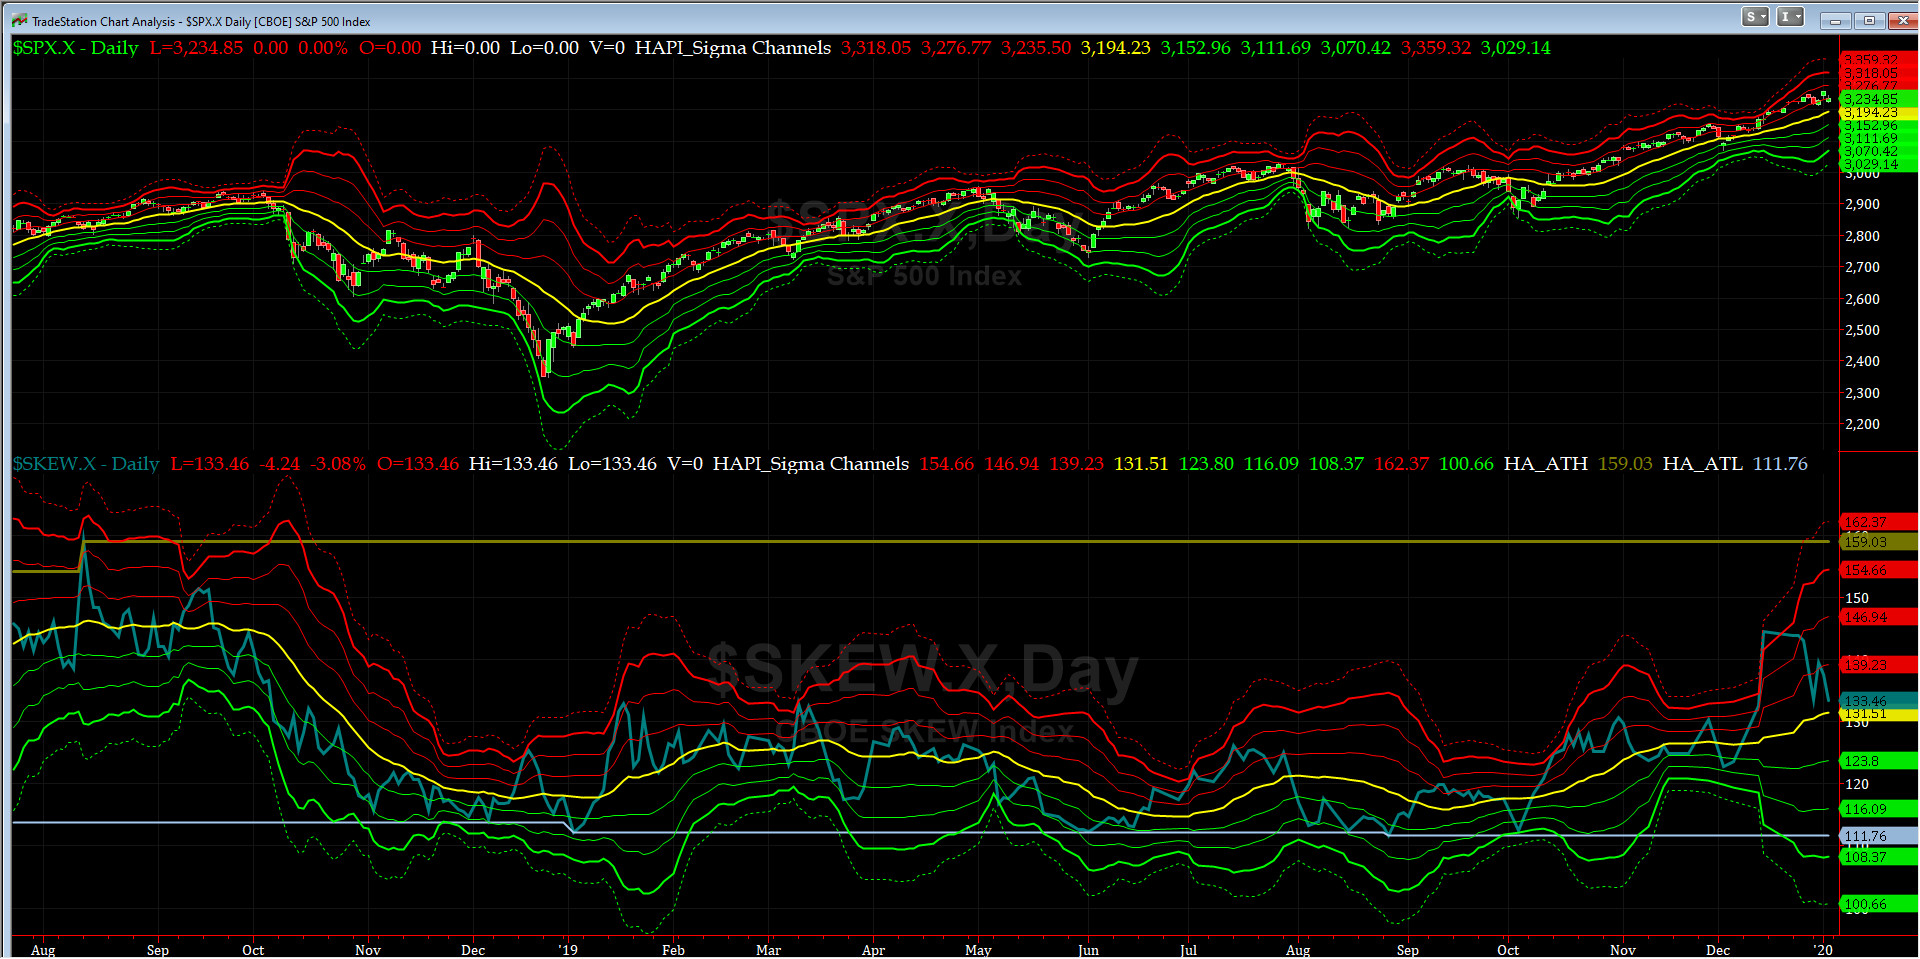
SPX SKEW (Downside Tail Risk) Chart

Since December 13, SPX SKEW (Downside Tail Risk) has eased off and closed on Friday at 133, now about its zero sigma (normal = 115, range 100-150).

All quiet on the Eastern & Mid-Western Fronts? our beloved & newly promoted Vice Admiral Tiko, KCPE, says NO MAS.


How to interpret the value of SPX SKEW? (from CBOE white paper on SKEW)


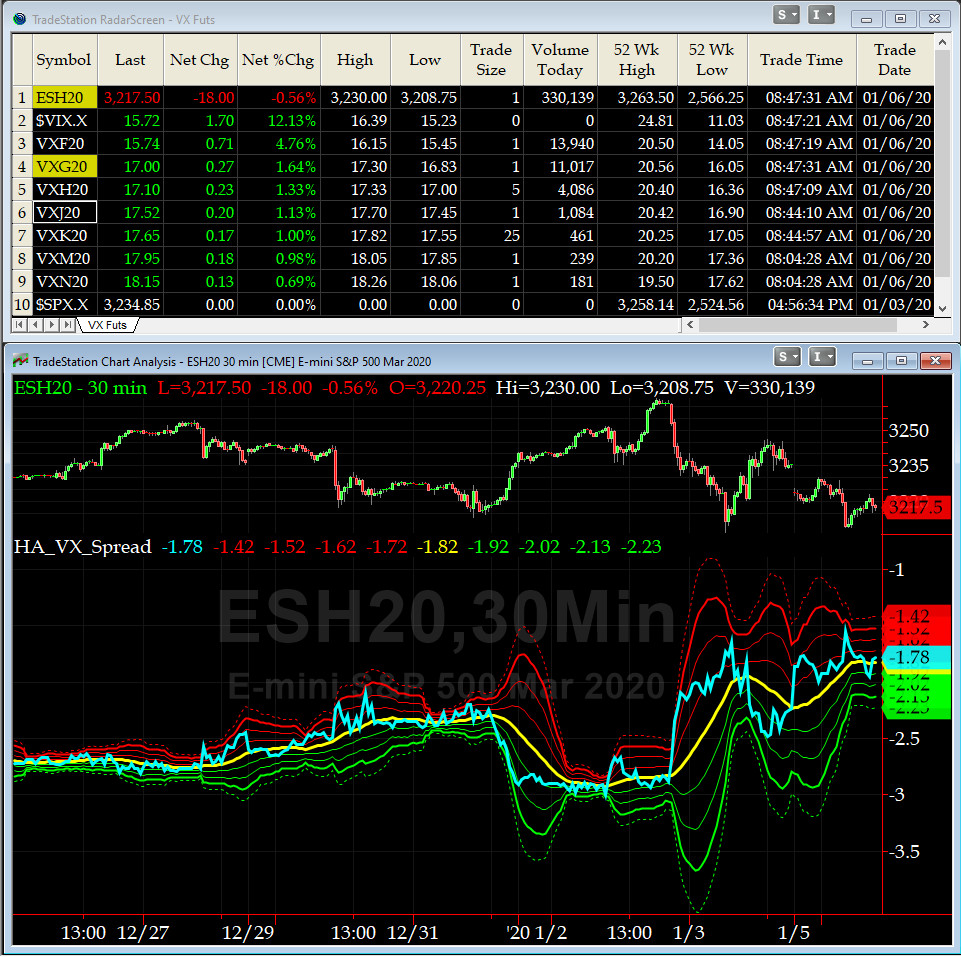
3-month VIX Futures Spread(VX) Chart

This popular timing indicator for identifying tradable bottoms, (now long JAN20, & short APR20 VIX Futures) hit -2.23 Friday at the Close.
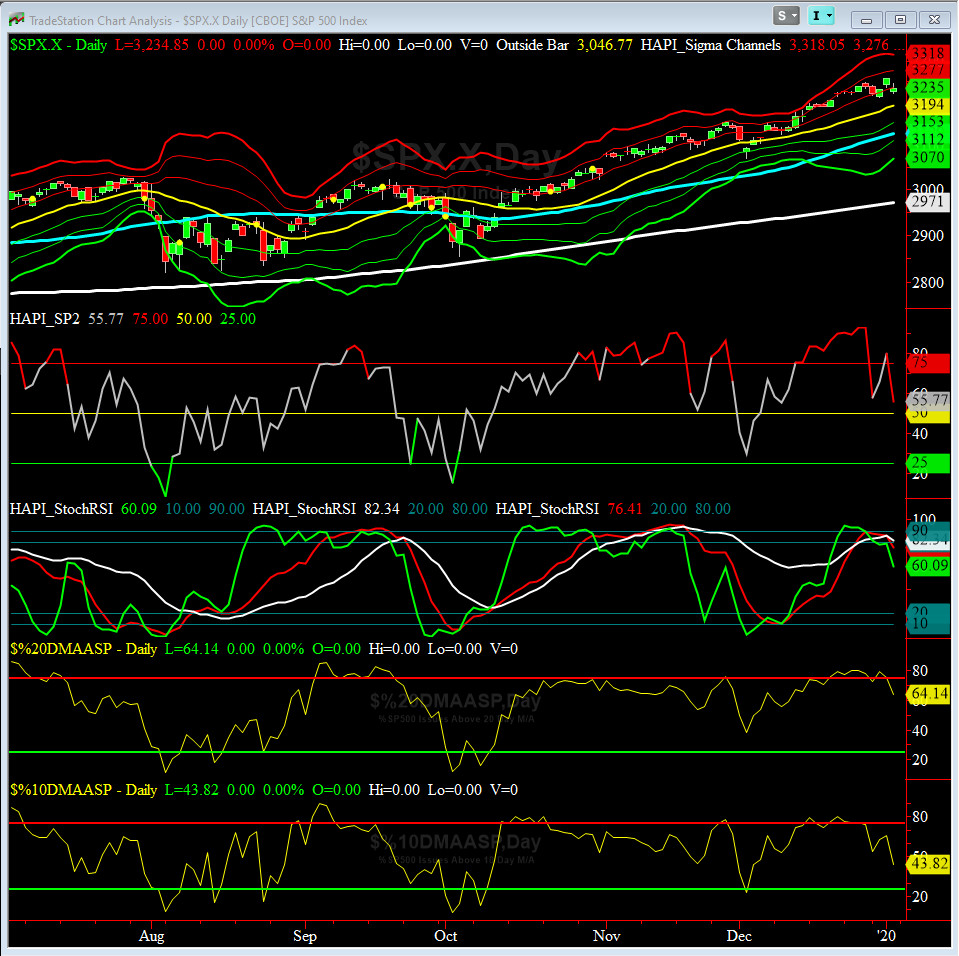


HA_SP2 Chart

HA_SP2 = 55.7 (Buy signal <= 25, Sell Signal >= 75)

This indicator says we are in neutral zone for now but the tilt is to the downside.

Fari Hamzei

Sunday, January 5, 2020, 1808ET
Notice of Change of Bias with Timer Digest


Dear Jim,

We are going short SPX now...

Fari Hamzei


Customer Care:


Chat with Fari on TradeStation.com Fari Hamzei writes for CBOE Options Hub on event-deriven basis       Futures & Options for Stock Indices
HA YouTube Channel  :::  HA Blog  :::  Testimonials  :::  Tutorials & FAQs  :::  Privacy Policy
(c) 1998-2024, Hamzei Analytics, LLC.   All Rights Reserved.