|
Monday, April 6, 2020, 1930ET
Market Timing Charts, Analysis & Commentary for Issue #321
Timer Charts of S&P-500 Cash Index (SPX) + NASDAQ-100 Cash Index (NDX)
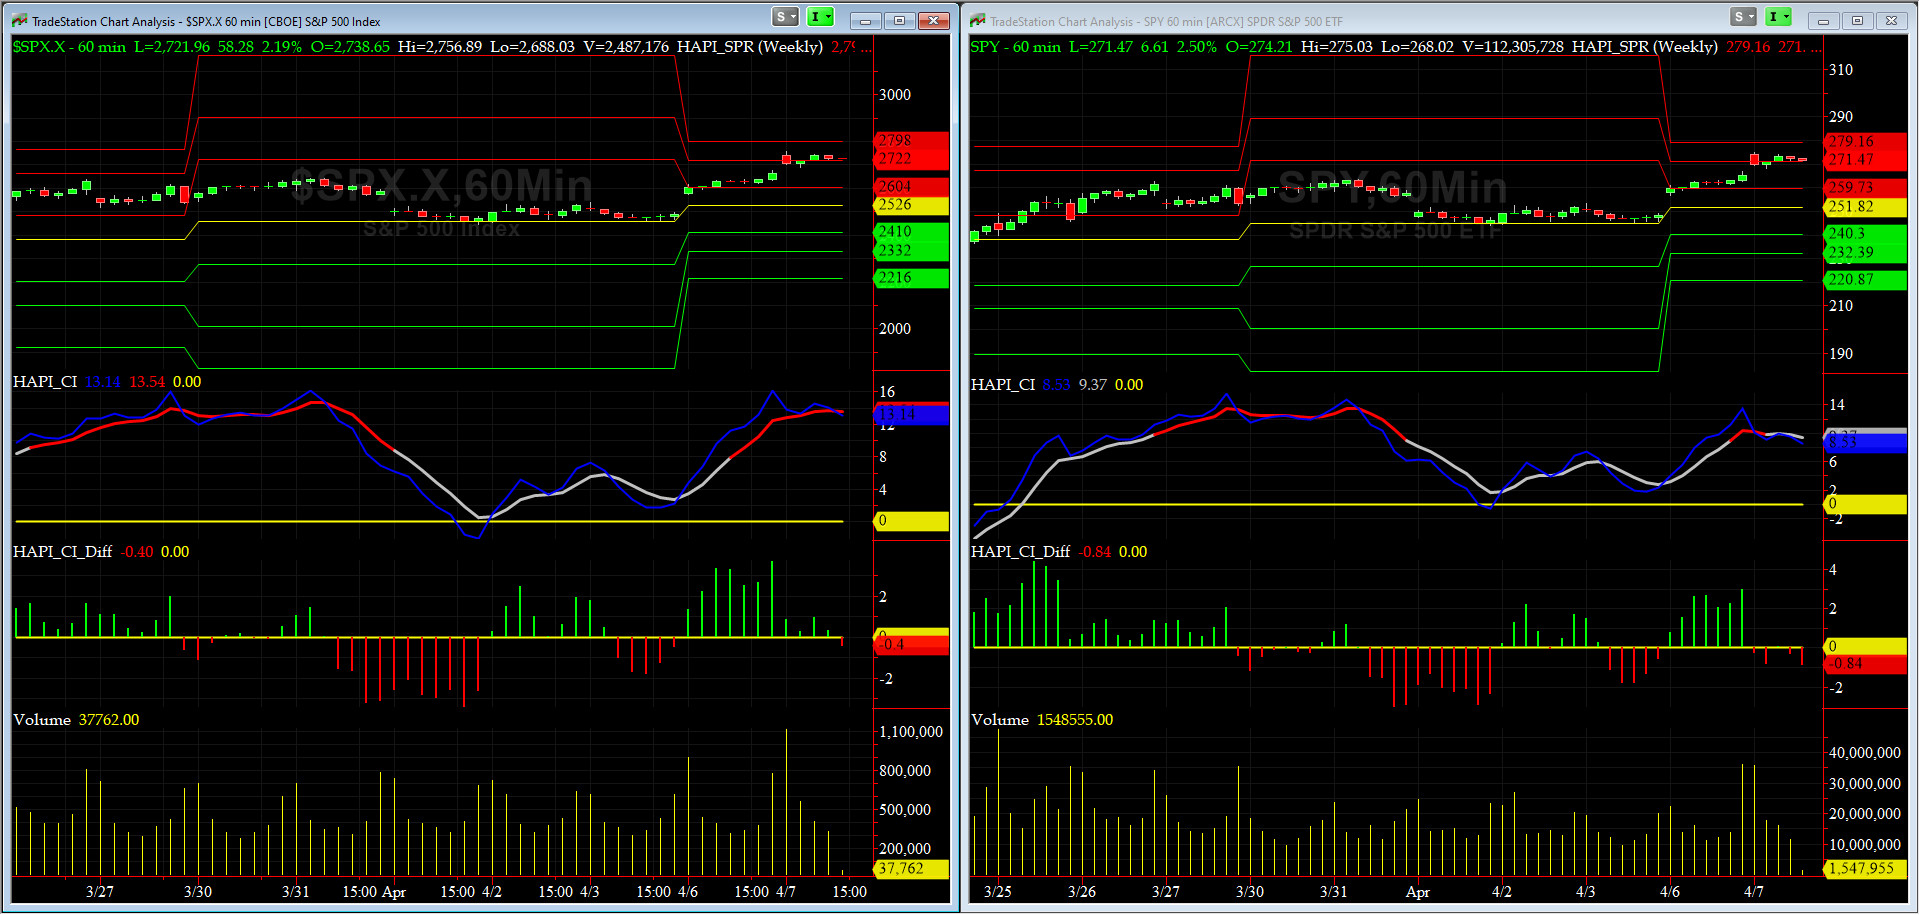
Most recent S&P-500 Cash Index (SPX) Close: 2663 up 425 (up +19%) for last two weeks ending on Monday, April 6, 2020, which closed very near its +1 sigma.
DJIA ALL TIME INTRADAY HIGH = 29568 reached on Wednesday, February 12, 2020
DJT ALL TIME INTRADAY HIGH = 11623 reached on Friday, September 14, 2018
SPX ALL TIME INTRADAY HIGH = 3258 reached on Wednesday, February 19, 2020
NDX ALL TIME INTRADAY HIGH = 8873 reached on Wednesday, February 19, 2020
RUT ALL TIME INTRADAY HIGH = 1742 reached on Friday, August 31, 2018
Current DAILY +2 Sigma SPX = 2826 with WEEKLY +2 Sigma = 3484
Current DAILY 0 Sigma SPX = 2527 with WEEKLY 0 Sigma = 3047
Current DAILY -2 Sigma SPX = 2227 with WEEKLY -2 Sigma = 2411
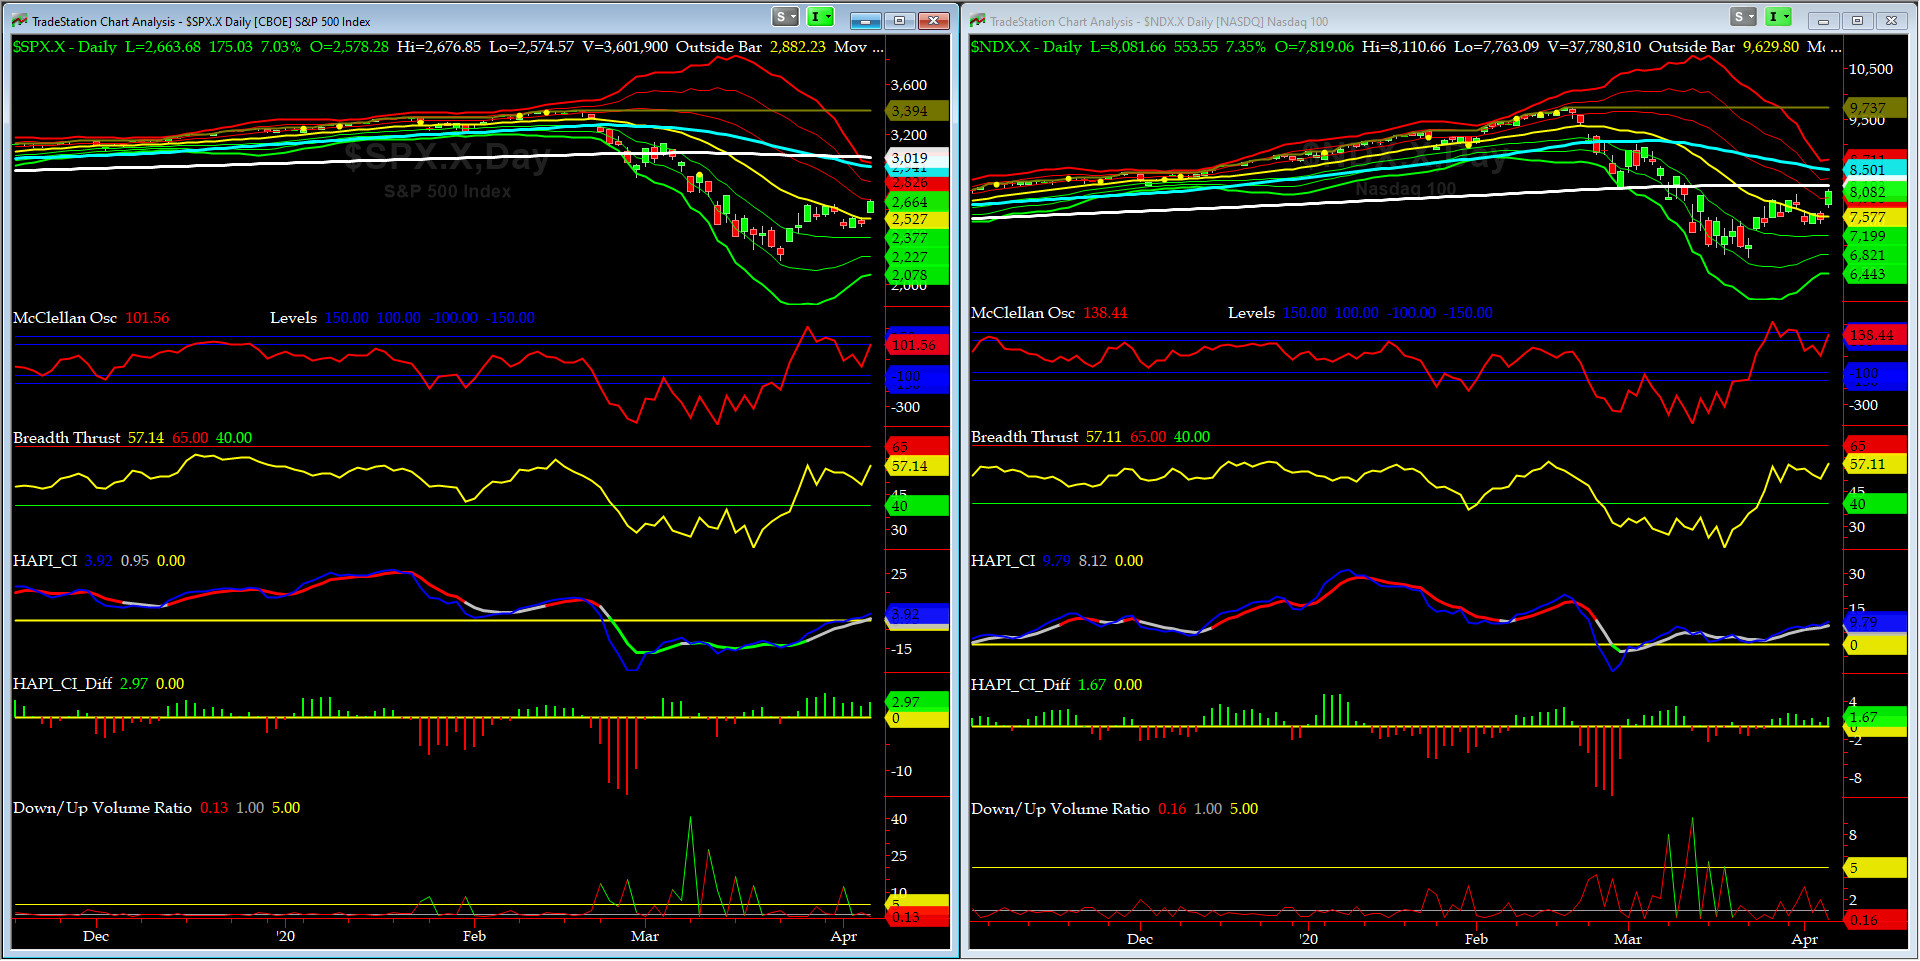
NYSE McClellan Oscillator = +101.8 (-150 is start of the O/S area; around -275 to -300 area or lower, we go into the �launch-pad� mode; over +150, we are in O/B area)
NYSE Breadth Thrust = 57.14 (40 is considered as oversold and 65 as overbought)
This market continues to be totally news driven..... 18,000 (Nov 2016 lows) was almost taken out Sunday evening March 22 (Spring Equinox +1 trading day) and since then we have slowly pulled up. Late last week, we managed to put an island formation after we gapped up today, which is very bullish. Our next target is 2825 and then 2950.
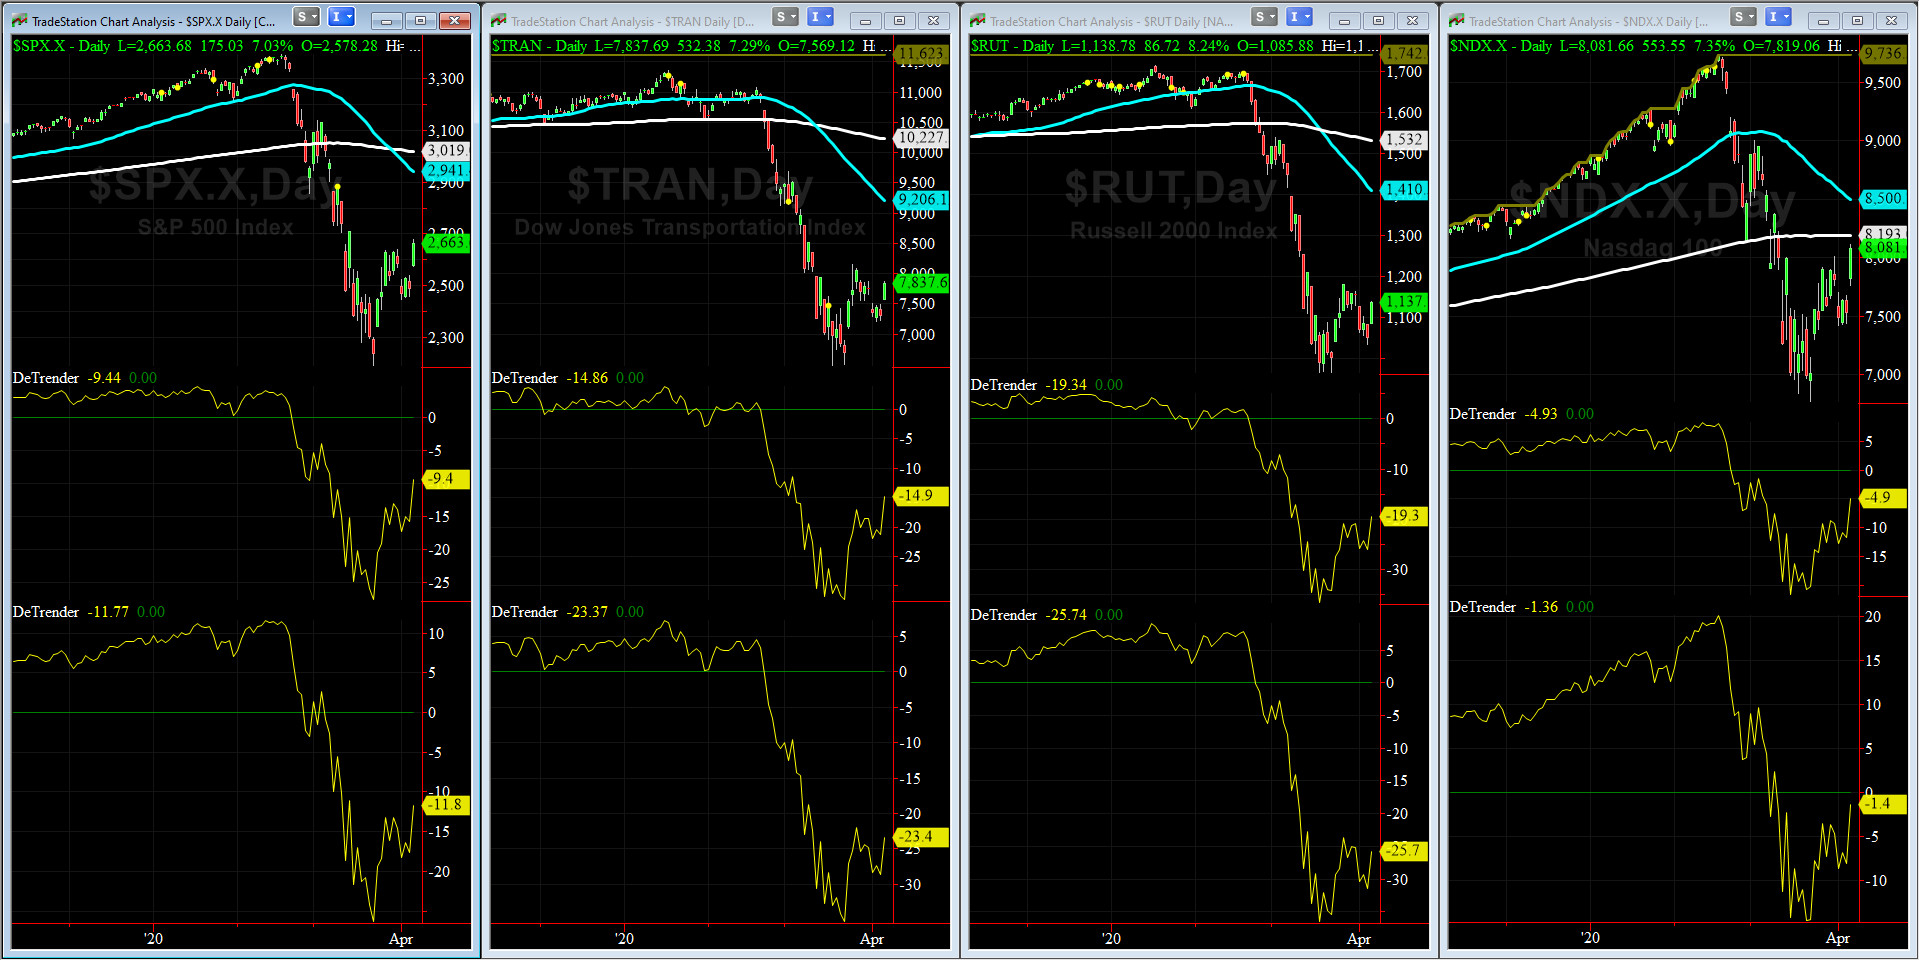
DeTrenders Charts for SPX, NDX, TRAN & RUT Indices
200-Day MA DJ TRAN = 10,277 or 23.4% ABOVE the DJ TRAN (max observed in last 7 yrs = 20.2%, min = -20.3%)
200-Day MA RUT = 1532 or 25.7% ABOVE RUT (max observed in last 7 yrs = 21.3%, min = -22.6%)
50-Day MA SPX = 2941 or 9.4% ABOVE SPX (max observed in last 7 yrs = +8.6%, min = -9.3%)
200-Day MA SPX = 3018 or 11.8% ABOVE SPX (max observed in last 7 yrs = 15.2%, min = -14%)
DJ Transportation Index (proxy for economic conditions 6 to 9 months hence) has tried to stabilize during last two weeks.
Russell 2000 Small Caps Index (proxy for Risk ON/OFF) also behaved pretty much the same. RISK remains nonexistent for now.
NONE of our EIGHT DeTrenders are in the POSITIVE territory. The DeTrenders for DJ Tran & RUT will continue to be harbingers of future price behavior in broad indices.
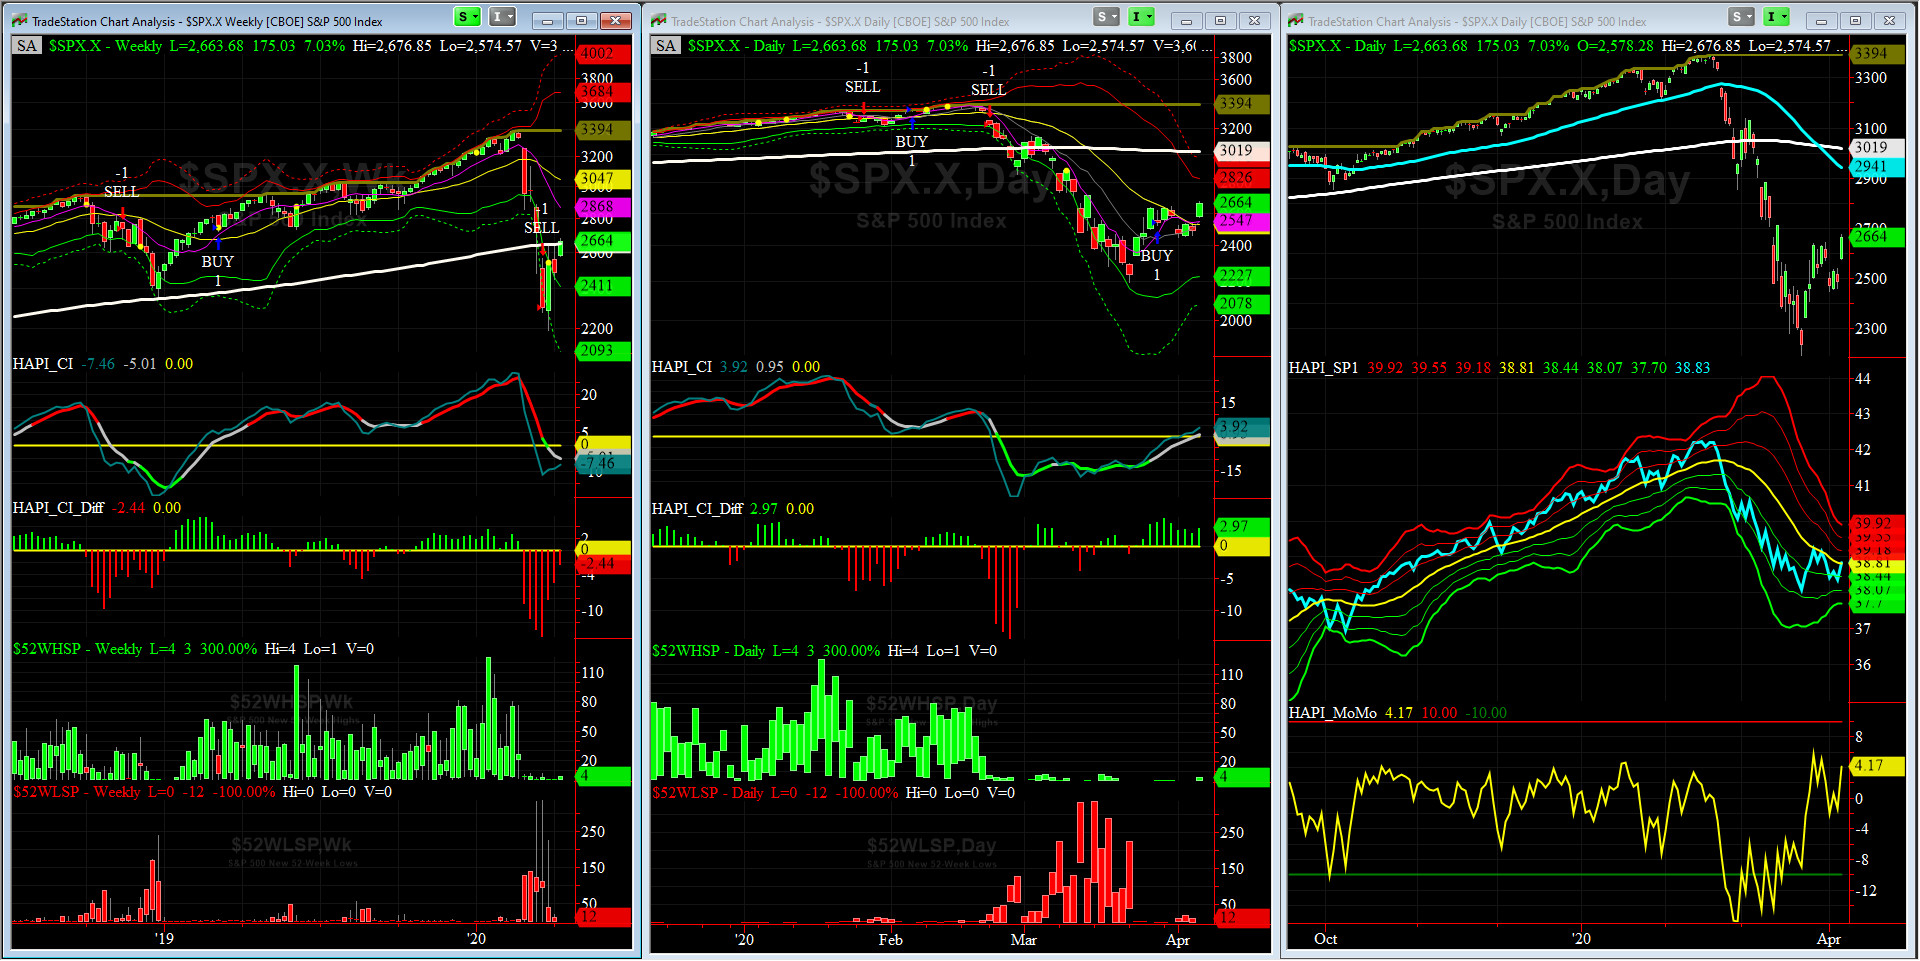
HA_SP1_Momo Chart
WEEKLY Timing Model = on a SELL Signal since Friday, March 20, 2019 CLOSE at 2304
DAILY Timing Model = on a BUY Signal since Friday, March 27, 2020 CLOSE at 2541
Max SPX 52wk-highs reading last week = 4 (over 120-140, the local maxima is in)
Max SPX 52wk-Lows reading last week = 225 (over 40-60, the local minima is in)
HA_SP1 closed near its zero sigma channels
HA_Momo = +4.2 (reversals most likely occur above +10 or below -10)
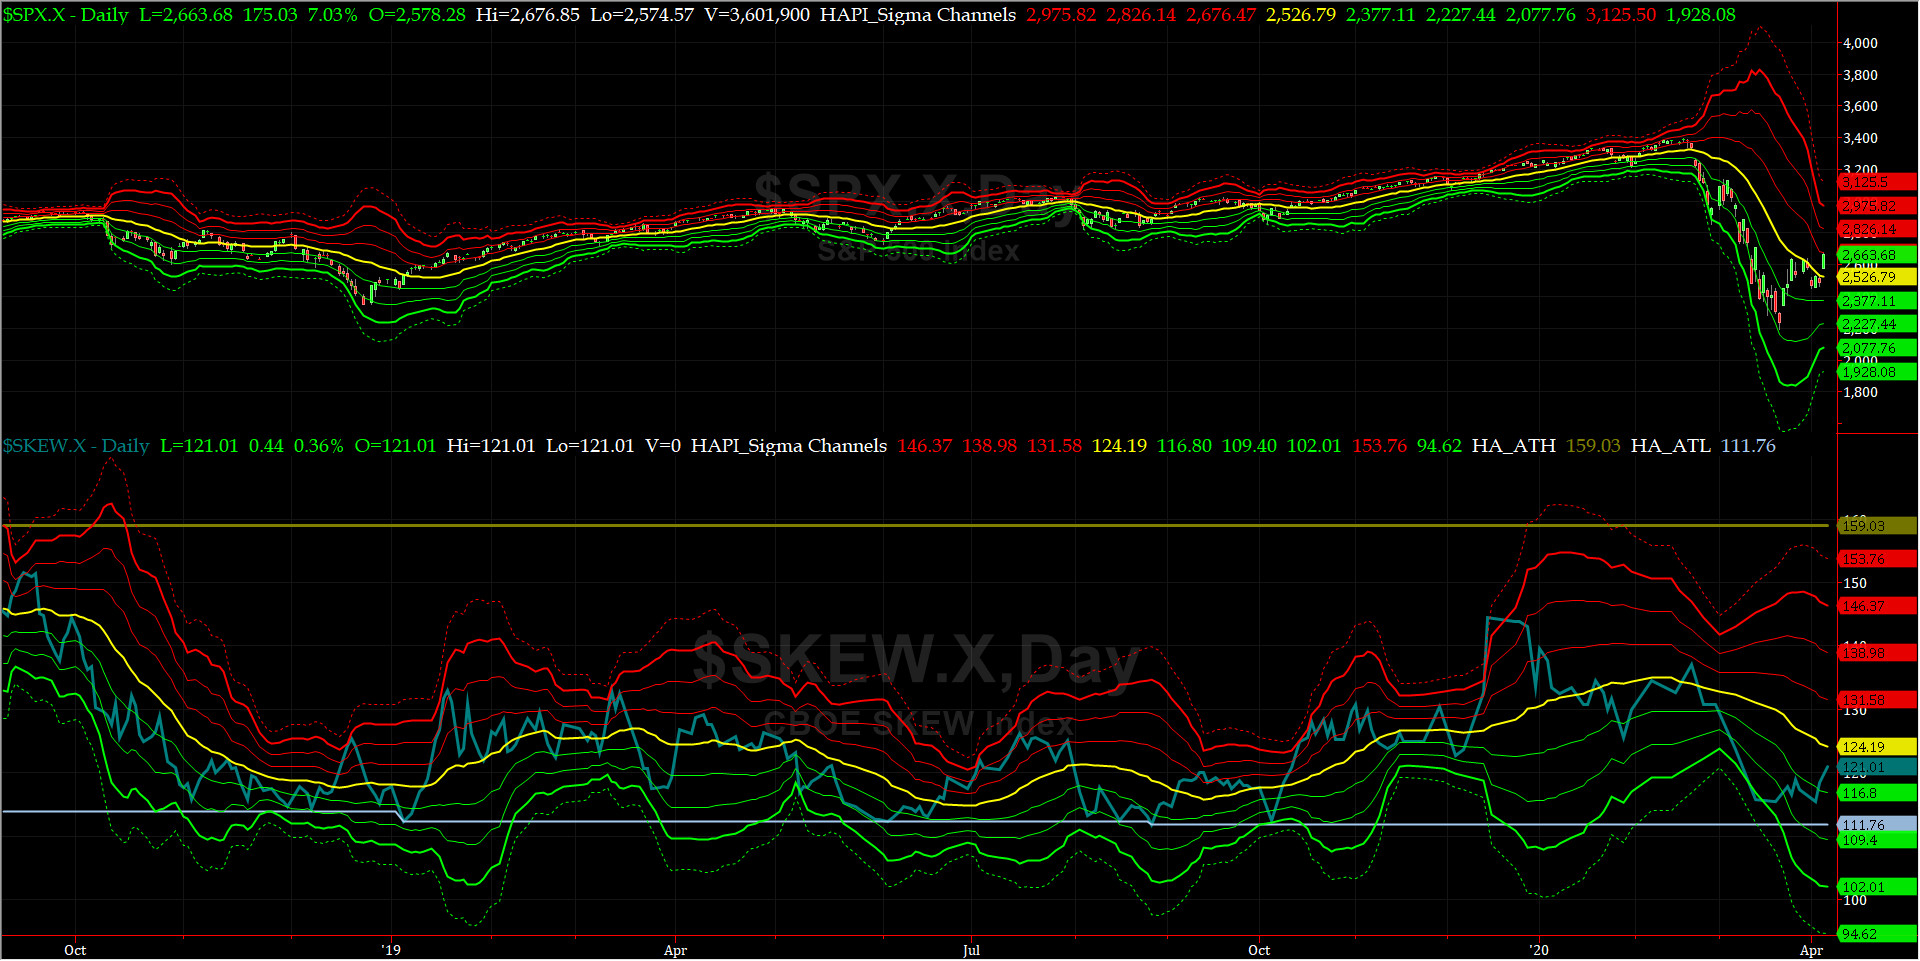
SPX SKEW (Downside Tail Risk) Chart
1
This week SPX SKEW (Downside Tail Risk) eased off on Thursday (SKEW is NOT computed every day any more) and closed at 121, now about its negative 0.5 sigma (normal = 115, range 100-150).
All quiet on the Eastern & Mid-Western Fronts? our beloved & newly promoted HRH Admiral Tiko, KCPE, says NO, ALL IS NOT WELL..... (ADM Tiko notes that on Feb 20, SKEW was at 137+ or its +1 sigma)
How to interpret the value of SPX SKEW? (from CBOE white paper on SKEW)

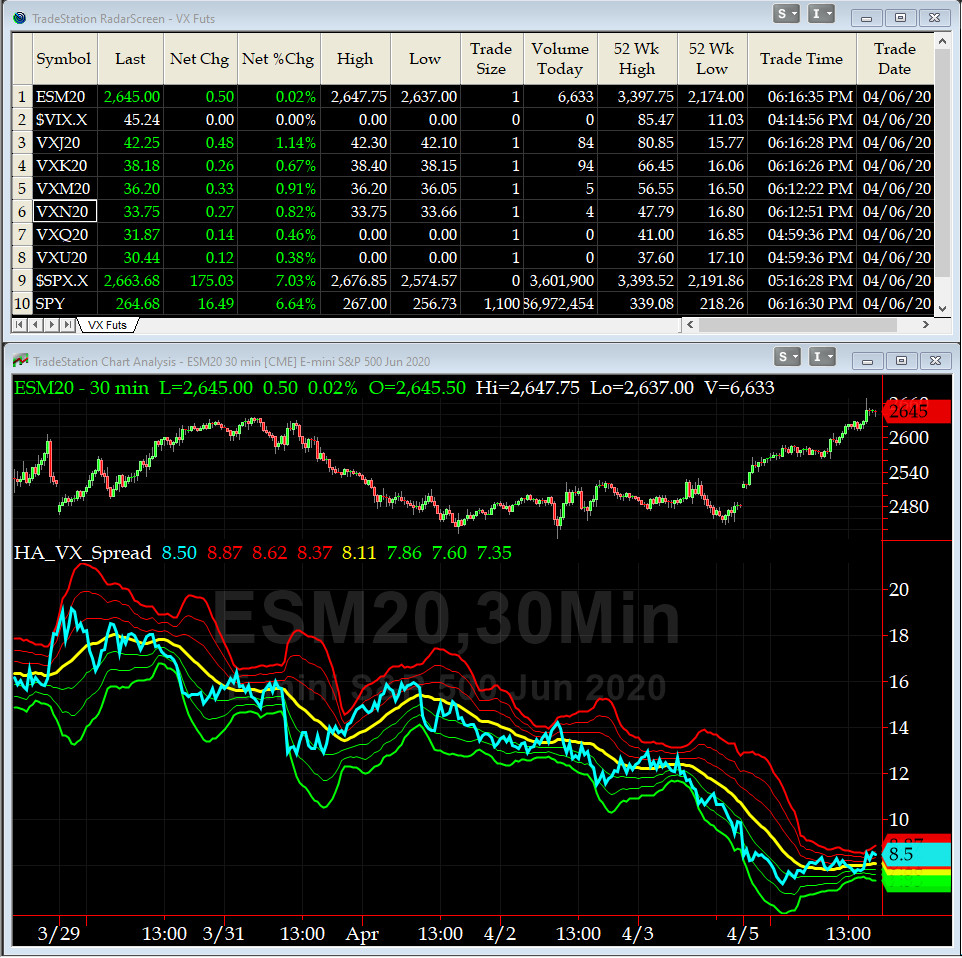
3-month VIX Futures Spread(VX) Chart
This popular timing indicator for identifying tradable bottoms, (now long APR20, & short JUL20 VIX Futures) hit +8.6 Friday at the Close. We continue to observe values for this spread that we have never seen before (note: we were NOT running this chart during 2008-2009 financial debacle).

HA_SP2 Chart
HA_SP2 = 64.4 (Buy signal <= 25, Sell Signal >= 75)
This indicator says we are slowly approaching overbought condition if we cross 75 and go higher.
Fari Hamzei
|


 Proactive Market Timing